

Virtually Implementing Chemistry Projects
source link: https://devm.io/java/java-chemistry-science
Go to the source link to view the article. You can view the picture content, updated content and better typesetting reading experience. If the link is broken, please click the button below to view the snapshot at that time.

Digitization is in full swing in the chemistry industry, thanks to subjects like chemical informatics and bioinformatics. But many chemists prefer using Excel and similar tools to evaluate measurement series. If suitable tools were available, data analysis could be performed more efficiently and diagrams could be designed to look nicer.
There are already several databases that offer information about chemical compounds. This especially applies to the sites PubChem and Chemie.de. Besides these, there are also web portals that deal with chemistry-related topics. This includes Rxlist.com, a site primarily aimed at pharmacists and medical chemistry students. Some websites provide interactive access to chemistry, like Molinspiration. Its editor can be used to draw or view molecules and perform various calculations. In the offline domain, there’s the JChemPaint software, which is used to paint all kinds of molecules. JChemPaint is based on the well-known Java library Chemistry Development Kit (CDK). However, it doesn’t use the current version of CDK and was last updated in 2017.
Throughout this article, you will learn about new features in the current version of CDK 2.5, how CDK can be integrated into a JavaFX project, and how a measurement series can be evaluated with various Java libraries.
Chemistry Development Kit (CDK)
If you want to implement a software project that deals with representing molecules, you can't avoid CDK. It’s used especially in chemistry and bioinformatics and has been around for several years. CDK can determine all possible structural formulas on the basis of the atoms that will occur, including their maximum weight [8]. CDK also outputs an atom’s isotopes and calculates the weight of a chemical formula.
CDK also supports both SMILES and SMARTS notation. SMILES notation represents a 2D molecule as a string. The SMARTS representation of a molecule is basically the same as the SMILES notation. This is because the SMARTS notation also recognizes a SMILES string. SMARTS is an extension of SMILES and is used in many chemistry databases for searching, but unlike SMILES, SMARTS allows wildcards. It can be used to find molecules containing the molecule you’re looking for. In addition to smaller molecules, CDK can also be used to draw more complex molecules. For instance, CDK can draw rings. Chemical compounds can also be formed from several atoms and the type of compound, such as the hybridization of a central atom, can be determined.
CDK used to be closely linked to Java Swing, but since version 2.0, CDK supports other GUI frameworks like JavaFX. You can integrate CDK with JavaFX using the MVC pattern. To do so, start a JavaFX application in the class with the Main method, as seen in Listing 1.
Listing 1
import javafx.application.Application;
import javafx.stage.*;
public class App extends Application
{
  public static void main( String[] args )
  {
    launch(args);
  }
  // launches the JavaFX sample application
  public void start(Stage primaryStage) throws Exception {
    // Model
    Data data = new Data(primaryStage,"Chocolate",1000,800);
    Controller mycon = new Controller(data);
  }
}
The model, which corresponds to the sample application’s Data class, stores an instance of PrimaryStage and the application’s height and width. It also contains the createMolecule method, which generates an image based on a SMILES string (Listing 2).
Listing 2
import java.awt.image.BufferedImage;
import org.openscience.cdk.CDKConstants;
import org.openscience.cdk.depict.Depiction;
import org.openscience.cdk.depict.DepictionGenerator;
import org.openscience.cdk.exception.CDKException;
import org.openscience.cdk.exception.InvalidSmilesException;
import org.openscience.cdk.interfaces.IAtomContainer;
import org.openscience.cdk.interfaces.IChemObjectBuilder;
import org.openscience.cdk.silent.SilentChemObjectBuilder;
import org.openscience.cdk.smiles.SmilesParser;

// generates an image of a chemical compound
public BufferedImage createMolecule(String compound, String title) {
  IChemObjectBuilder bldr   = SilentChemObjectBuilder.getInstance();
  SmilesParser smipar = new SmilesParser(bldr);
  IAtomContainer mol = null;
  try {
    mol = smipar.parseSmiles(compound);
  } catch (InvalidSmilesException e) {
    e.printStackTrace();
  }
  mol.setProperty(CDKConstants.TITLE, title);
  Depiction dptgen = null;
  try {
    dptgen = new DepictionGenerator().depict(mol);
  } catch (CDKException e) {
    e.printStackTrace();
  }
  BufferedImage img = dptgen.toImg();
  return img;
}
The window is implemented using the View class. View uses the model to represent the window’s height and width. The View class’ elements are stored in the BorderPane container, and molecule images are stored in a VBox (Listing 3).
Listing 3
import javafx.scene.layout.*;
import javafx.stage.Stage;
import java.awt.image.BufferedImage;
import javafx.embed.swing.SwingFXUtils;
import javafx.scene.image.*;
import javafx.scene.Scene;
import javafx.geometry.Pos;
import javafx.scene.text.Text;
import javafx.scene.layout.VBox;

// View class draws the application window
public class View {
  private Data data;
  private Scene scene;
  private BorderPane root;
  private static final float HEIGHT_IMG = 0.1f;
  public View(Data d) {
    this.data = d;
    setLayout();
  }

  // adds an image of the molecule to the VBox
  public VBox addPicture(BufferedImage buf,String description, double x, double y) {
    Image img = SwingFXUtils.toFXImage(buf, null);
    ImageView iview = new ImageView(img);
    double sceneH = this.scene.getHeight();
    double imgHeight = sceneH * HEIGHT_IMG;
    iview.setFitHeight(imgHeight);
    iview.setPreserveRatio(true);
    Text txt = new Text(description);
    Region spacer = new Region();
    VBox box = new VBox(10, iview, spacer, txt);
    box.setVgrow(spacer, Priority.ALWAYS);
    box.setAlignment(Pos.CENTER);
    box.setLayoutX(x);
    box.setLayoutY(y);
    this.root.getChildren().add(box);
    return box;
  }
  // BorderPane: Root container
  public void setLayout() {
    this.stack.setAlignment(Pos.TOP_LEFT );
    this.root = new BorderPane();
  }
  // Draws the application window based on a specified width and height
  public void initialize() {
    this.scene = new Scene(root,this.data.getWidth(),this.data.getHeight());
  }
  // initializes the stage
  public void show(Stage stage) {
    stage.setTitle(this.data.getTitle());
    stage.setScene(this.scene);
    stage.setResizable(false);
    stage.setFullScreen(false);
    stage.show();
  }
}
Initially, the molecule generated with the createMolecule method returns an image of type BufferedImage. But because BufferedImage is part of the Java AWT framework, it also needs the SwingFXUtils class. This converts the BufferedImage into a format of the type Image, which is compatible with the JavaFX package. Then, you display the image by placing it in a JavaFX node with the type ImageView.
The Controller class creates an instance of the View type and associates the molecule images with events (Listing 4).
Listing 4
import java.awt.image.BufferedImage;
import java.io.IOException;
import java.util.ArrayList;
import javafx.scene.input.MouseEvent;
import javafx.event.EventHandler;
import javafx.scene.input.DragEvent;
import javafx.scene.layout.VBox;

// Controller class controls the view
public class Controller {
  private View view;
  private Data data;
  private ArrayList<VBox> vboxes;
  public Controller(Data d) {
    this.data = d;
    this.view = new View(d);
    this.vboxes = new ArrayList<VBox>();
    show();
    test();
    setEvents(this.view);
  }
  // starts the view
  public void show() {
    this.view.initialize();
    this.view.show(this.data.getPrimaryStage());
  }
  // creates images of molecules and passes them to the View
  public void test() {
    String tgl = "C(C(COC=O)OC=O)OC=O";
    String t = "Triglyceride";
    BufferedImage img = data.createMolecule(tgl,t);
    VBox box3 = this.view.addPicture(img, t,900,70.0);
    String gl = "C(C(CO)O)O";
    String t2 = "Glycerol";
    BufferedImage imgGL = data.createMolecule(gl,t2);
    VBox box1=this.view.addPicture(imgGL, t2,100.0,70.0);

    String sfa = "CCCCCCC(=O)O";
    String t3 = "Saturated Fatty Acid";
    BufferedImage imgFA = data.createMolecule(sfa,t3);
    VBox box2=this.view.addPicture(imgFA, t3,500,70.0);
    this.vboxes.add(box1);
    this.vboxes.add(box2);
    this.vboxes.add(box3);
  }
  public void setEvents(View view) {
    for (VBox b : this.vboxes) {
      auxSetEvents(b);
    }
  }
  // enables drag and drop
  private void auxSetEvents(VBox b) {
    EventHandler<MouseEvent> dragElement = new EventHandler<MouseEvent>(){
      public void handle(MouseEvent me) {
        float dragX = (float)me.getSceneX();
        float dragY = (float)me.getSceneY();
        b.setLayoutX(dragX);
        b.setLayoutY(dragY);
      }
    };
    b.setOnMouseDragged(dragElement);
  }
}
The test method adds the necessary molecule images in order to make Chocolate to the ArrayList of type VBox. This makes it easier to control images using drag and drop, which is implemented by the setEvents method. The molecules are compatible with JavaFX (Fig. 1).
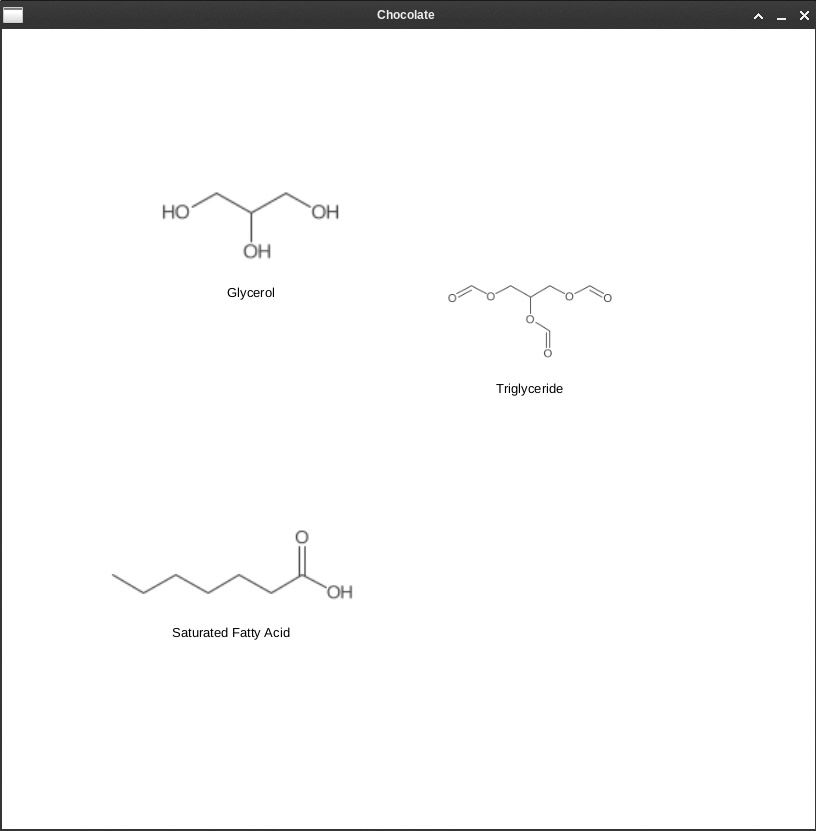
Fig. 1: Molecules generated with CDK can be moved with drag and drop
Javax.Measure/JScience
Physics plays an important role in chemistry. This is reflected in the names of chemistry subjects. Therefore, theoretical chemistry is also called physical chemistry. It covers thermodynamics and quantum mechanics. As is common in physics, it’s overrun with units. We don’t want to lose our overview and have too many different units. Therefore, libraries like JScience or Javax.Measure are suitable, since they provide units and all possible constants. These two libraries can be used together in combination. The following example illustrates usage of the two libraries: “An electron in the Li atom falls from n = 2 to the ground state. Calculate the emitted photon’s wavenumber. State the value in SI units.”
To solve the task, the self-defined method calculateWaveNumber (Listing 5) is called by passing the atomic number and the two states. Since lithium is the third atom in the periodic table, Z = 3. The two states are n_i = 2 and n_f = 1. You store the numbers and the calculation results in instances of the type Amount and specify the unit’s type—for instance, Energy, Length, Frequency. The second part of the variable contains the unit itself, for instance, a JOULE. If it’s an ordinary number with the type Integer or Double, then you need the additional method Amount.valueOf to convert the number to Amount. For the four basic arithmetic operations, the libraries provide methods like divide for division, or times for multiplication. If calculations are made using numbers of the Amount type, they might need to be cast and provided with other units. Once the task is solved, the Amount.getEstimatedValue method can be used to convert it into an ordinary number with the type Double.
Listing 5
import org.jscience.physics.amount.*;
import javax.measure.quantity.*;
import static javax.measure.unit.SI.*;

// calculates the wave number based on the atomic number and the two states
public void calculateWaveNumber(int z, int nInitial, int nFinal) {
  double exp1 = Math.pow(10, -18);
  double num1 = -2.18*exp1;
  double photonE_1 = Math.pow(z, 2)*((1/Math.pow(nInitial,2))-(1/Math.pow(nFinal,2)));
  Amount<Energy> eIon = Amount.valueOf(num1, JOULE);
  System.out.println( eIon);
  Amount<Energy> photonEnergy = eIon.times(photonE_1);
  System.out.println( "Energy of a photon: "+photonEnergy);
  Amount<Frequency> f = (Amount<Frequency>) photonEnergy.divide(Constants.ℎ);
  System.out.println( "Frequency: "+f);
  Amount<Length> wavelength =  (Amount<Length>) Constants.c.divide(f);
  System.out.println( "Wavelength of the photon: "+ wavelength);
  double wavenumber = 1/wavelength.getEstimatedValue();
  System.out.println("Wavenumber: "+ wavenumber);
}
Next to the units, the output from the intermediate and final results includes the standard deviation. This is seen with the ± sign:
(-2.18E-18 ± 1.9E-34) J
Energy of a photon: (1.4714999999999999E-17 ± 3.1E-33) J
Frequency: (2.2207736E16 ± 3.7E9) 1/s
Wavelength of the photon: (1.349946E-8 ± 2.2E-15) m
Wavenumber: 7.407703479407932E7
Analyzing experiments
Chemical experiments provide measurement data that can be used for data analysis. Usually, measurement data is available in a text file and each column corresponds to a variable. Since the measurements data is still processed, analyzed, and visualized, you can use JavaPlot to read and visualize it. The MyData class reads the data file specifying the path, and stores it in an instance of the type FileDataSet (Listing 6). This class belongs to JavaPlot, where it is indirectly an ArrayList of the type String. Because of this, you need to parse the list and convert the values to a suitable number type. For this, there is the self-defined method getDataPoint. This retrieves the string at a given position x from the ArrayList and converts it to Double.
Listing 6
import java.io.File;
import java.io.IOException;
import com.panayotis.gnuplot.dataset.FileDataSet;
// MyData class reads data files
public class MyData {
  private String fileData;
  private FileDataSet dataset;
  public MyData(String d) {
    this.fileData = d;
  }

  // saves the data file as FileDataSet
  public void setDataset() {
    File file = null;
    try{
      file = new File(fileData);
      this.dataset = new FileDataSet(file);
    } catch (IOException ex) {
      ex.printStackTrace();
    }
  }
  public FileDataSet getDataset() {
    return dataset;
  }

  // retrieves an X or Y value based on the index
  public Double getDataPoint(int iCol, int index ) {
    String sDataPoint = this.dataset.getPointValue(index, iCol);
    Double dVal = Double.parseDouble(sDataPoint);
    return dVal;
  }
}
The Pearson correlation coefficient and the response order
Just as in physics, speed plays a role in chemistry, especially in reactions where the goal is finding out how quickly substances react with each other. Chemical reactions have a reaction rate of k. This provides information about the time period when the concentration of starting materials or a reaction’s end product changes. Usually, the unit for reaction rate is molarity per second, abbreviated to M/s. If you heated nitrogen dioxide to 300°C, it would break down into its components, nitrogen oxide and oxygen. Meanwhile, you’ve measured the concentration of nitrogen dioxide at different times. This data can be used to determine the reaction order. Now, you’ll want to use the measurement data to determine if the reaction is a zero, first, or second order reaction. You can plot the linear equation of a series of measurements to find out. You’ve automatically determined the reaction order if only one of the plots produces a straight line. Characteristics of individual plots can be found in Table 1.
| Reaction order | Bivariate plot | Slope/reaction rate k | Curve | Pearson R coefficient |
|---|---|---|---|---|
| Zero order reaction | Concentration vs. time | -k | Straight line | -1 |
| First order reaction | ln(concentration) vs. time | -k | Straight line | -1 |
| Second order reaction | 1/Concentration vs. time | k | Straight line | 1 |
Table 1: Determining the reaction order
The MyEquation class is the heart of this experiment. The measured Y-values are recalculated depending on the reaction type and are stored in a two-dimensional array of the type Double (Listing 7). This array is important for JavaPlot since, as far as Java lists are concerned, JavaPlot can only plot two-dimensional arrays.
Listing 7
import org.hipparchus.stat.regression.SimpleRegression;
import com.panayotis.gnuplot.dataset.FileDataSet;
import java.lang.Math;

// the MyEquation class determines the correct reaction order
public class MyEquation {
  private SimpleRegression reg;
  private FileDataSet dataset;
  private FunctionType reaction;
  private double [][] data;
  private boolean isValid;
  private MyData mydata;

  public MyEquation(MyData d,FunctionType r) {
    this.mydata = d;
    this.dataset = mydata.getDataset();
    this.reaction=r;
    this.data=new double[this.dataset.size()][this.dataset.getDimensions()];
    this.isValid = false;
  }

  // applies linear regression to the calculated data
  public void setRegression() {
    this.reg = new SimpleRegression();
    this.reg.addData(data);
  }
  public SimpleRegression getRegression() {
    return this.reg;
  }
  public boolean isValid() {
    return this.isValid;
  }
  public void setValidity(boolean b) {
    this.isValid = b;
  }
  // Per row in double array: [time][concentration]
  public void setData() {
    int xCol = 0;
    int yCol = this.dataset.getDimensions() - 1;
    for(int i=0; i<this.dataset.size(); i++) {
      Double dox = mydata.getDataPoint(xCol,i );
      Double doy = mydata.getDataPoint(yCol,i );
     // Calculate Y-value depending on reaction order
      if (this.reaction.equals(FunctionType.ZEROTH_ORDER) ) {
        data[i][yCol] = doy;
      }else if (this.reaction.equals(FunctionType.FIRST_ORDER )) {
        Double y = Math.log(doy);
        data[i][yCol] = y;
      } else {
        Double y = 1/doy;
        data[i][yCol] = y;
      }
      data[i][xCol] = dox;
    }
  }
  public FunctionType getReaction() {
    return reaction;
  }
  public double[][] getData() {
    return data;
  }
}
When creating a new instance of the type MyEquation, the data that’s read in and the reaction type are passed to the constructor. Next, the setData method is called, which recalculates the Y values (= concentration) based on the reaction type. The good thing about the double array is that the SimpleRegression class accepts it. The SimpleRegression class is part of the extensive Java library Hipparchus, which includes classes that you can apply to data analysis.
For implementing the SimpleRegression class, Hipparchus uses Pearson's correlation coefficient, called r. The Pearson correlation coefficient expresses how much the Y-axis correlates with the X-axis. If the data points result in a perfect straight line, the correlation coefficient is -1 for a negative slope and 1 for a positive slope.
To find the correct reaction order a SimpleRegression type instance is applied to the previously calculated data (see the setRegression method in Listing 7) and the highest r-correlation coefficient from the three equations is determined. Naturally, the correct reaction can be determined at a glance, but the Pearson correlation is a good choice if you want to automate everything. The largest r-value of a list is output by the CompRegression class (Listing 8).
Listing 8
import java.util.Comparator;

// compares the r-correlation coefficient of two reactions
public class CompRegression implements Comparator<MyEquation> {
  public int compare(MyEquation a, MyEquation b) {
   if (Math.abs(a.getRegression().getR()) > Math.abs(b.getRegression().getR()))
     return 1;
   if (Math.abs(a.getRegression().getR()) == Math.abs(b.getRegression().getR()))
     return 0;
     return -1;
  }
}
When plotting, axis labels and diagram titles are taken from the FunctionType enum (Listing 9).
Listing 9
// Provides labels for the diagrams
public enum FunctionType {
  FIRST_ORDER("First Order Reaction","Time(sec)","ln[Concentration]"),
  SECOND_ORDER("Second Order Reaction","Time(sec)","1/[Concentration]"),
  ZEROTH_ORDER("Zeroth Order Reaction","Time(sec)","[Concentration]");
  private final String key;
  private final String xlabel;
  private final String ylabel;
  FunctionType(String key,String xlabel, String ylabel) {
    this.key = key;
    this.xlabel=xlabel;
    this.ylabel=ylabel;
  }
  public String getKey() {
    return this.key;
  }
  public String getXlabel() {
    return xlabel;
  }
  public String getYlabel() {
    return ylabel;
  }
}
The plotting is done with the Java library JavaPlot. Both data points and straight lines should be visible on individual reaction orders’ diagrams. This way, in case of ambiguity, a sense of proportion decides which reaction order is really involved (Listing 10).
Listing 10
// Plots data points
public static void plotPoints(String title,JavaPlot p, double[][] data,NamedPlotColor c) {
  DataSetPlot sPoints = new DataSetPlot(data);
  sPoints.setTitle(title);
  p.addPlot(sPoints);
  PlotStyle stlPoint = styleForm(c, p, Style.POINTS );
  stlPoint.setPointType(7);
}

// Plots lines based on data points and applies curve smoothing
public static void plotLines(String title,JavaPlot p, double[][] data,NamedPlotColor c,Smooth s) {
  DataSetPlot sPoints = new DataSetPlot(data);
  sPoints.setTitle(title);
  p.addPlot(sPoints);
  AbstractPlot absplot = (AbstractPlot)p.getPlots().get(p.getPlots().size() - 1);
  absplot.setSmooth(smooth);
  PlotStyle stlFunc = styleForm(c, absplot, Style.LINES );
  stlFunc.setLineWidth(3);
}

// plots a function
public static void createFunctionPlot(String func,String title,JavaPlot p,Smooth s, NamedPlotColor c) {
  FunctionPlot fplot = new FunctionPlot(func);
  fplot.setTitle(title);
  p.addPlot(fplot);
  AbstractPlot absplot = (AbstractPlot)p.getPlots().get(p.getPlots().size() - 1);
  absplot.setSmooth(s);
    PlotStyle stlFunc = styleForm(c,  absplot,Style.LINES );
    stlFunc.setLineWidth(3);
}

// styles the Plots
public static PlotStyle styleForm(PlotColor color, JavaPlot p, Style s ) {
  PlotStyle stl = ((AbstractPlot)p.getPlots().get(p.getPlots().size() -1 )).getPlotStyle();
    stl.setStyle(s);
    stl.setLineType(color);
    return stl;
}

public static PlotStyle styleForm(PlotColor color, AbstractPlot a, Style s ) {
  PlotStyle stl = a.getPlotStyle();
    stl.setStyle(s);
    stl.setLineType(color);
    return stl;
}
Creating diagrams is done via the self-defined method paintScatterplot. This method is passed the aforementioned enum, the file name, the cleaned data set, and the corresponding r-correlation coefficient (Listing 11).
Listing 11
import com.panayotis.gnuplot.JavaPlot;
import com.panayotis.gnuplot.plot.AbstractPlot;
import com.panayotis.gnuplot.plot.DataSetPlot;
import com.panayotis.gnuplot.plot.FunctionPlot;
import com.panayotis.gnuplot.style.*;
import com.panayotis.gnuplot.terminal.PostscriptTerminal

// creates a correlation diagram for the individual reaction orders
public static void paintScatterplot(FunctionType ro, String picName,double[][] data,double r) {
  JavaPlot p = new JavaPlot();
  PostscriptTerminal epsf = new PostscriptTerminal(System.getProperty("user.home") + System.getProperty("file.separator") + picName);
  epsf.setColor(true);
  p.setTerminal(epsf);
  p.getAxis("x").setLabel(ro.getXlabel());
  p.getAxis("y").setLabel(ro.getYlabel());
  p.setKey(JavaPlot.Key.BOTTOM_RIGHT);
  // see Listing 10
  plotLines(ro.getKey()+" -- r="+r,p,data,NamedPlotColor.ROYALBLUE);
  plotPoints("",p,data,NamedPlotColor.DARK_PINK);
  p.plot();
}
In the class hosting the Main method, the predefined method for enums, specifically FunctionType.values(), can iterate through individual reaction types. Therefore, different data sets, the r-correlation coefficient, and images can be generated in one go (Listing 12).
Listing 12
// calls the classes and methods presented here
public static void exampleRO() {
  List<MyEquation> rxns = new ArrayList<>();
  String picName= "reaction_.eps";
  String sData="data.dat";
  // Listing 6
  MyData data = new MyData(sData);
  data.setDataset();
  for (FunctionType fType: FunctionType.values()) {
    // Listing 7
    MyEquation func = new MyEquation(data,fType);
    func.setData();
    func.setRegression();
    rxns.add(func);
  }
  MyEquation maxFunc = Collections.max(rxns, new CompRegression());
  int index = 1;
  for(MyEquation func: rxns) {
String fName = FilenameUtils.getBaseName(picName...Recommend
About Joyk
Aggregate valuable and interesting links.
Joyk means Joy of geeK