

Using RenderDoc to Find Shader Issues in OpenGL ES
source link: https://community.arm.com/arm-community-blogs/b/graphics-gaming-and-vr-blog/posts/shader-issues-in-opengl-es
Go to the source link to view the article. You can view the picture content, updated content and better typesetting reading experience. If the link is broken, please click the button below to view the snapshot at that time.

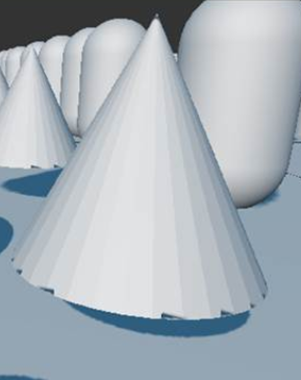
You might encounter some defects when you run 3D applications that use OpenGL ES to render images. This blog helps you find the cause of the defects. These examples show defective images and golden images.
 |
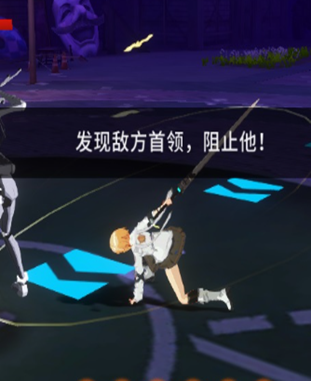 |
Figure 1: Defective images |
 |
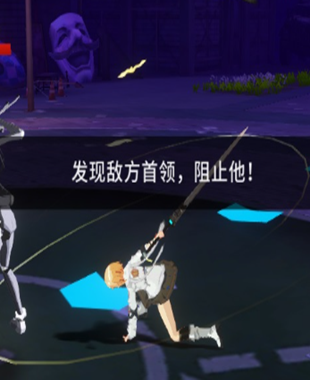 |
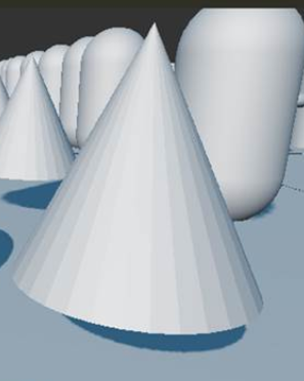
Figure 2: Golden images |
The defective images can be caused by:
- Compiler shader handling
- OpenGL ES driver bugs
Use a visualizing tool
When you see defective images, you can investigate the problem with visualizing tools. These tools capture and analyze the trace. We recommend that you use RenderDoc (https://renderdoc.org). Renderdoc can capture frame buffer output and API sequence. This tool captures shader source. You can then modify, recompile, and rerun the shader source instead of investigating the driver.
This screenshot shows captured APIs and the shader by some draw calls.
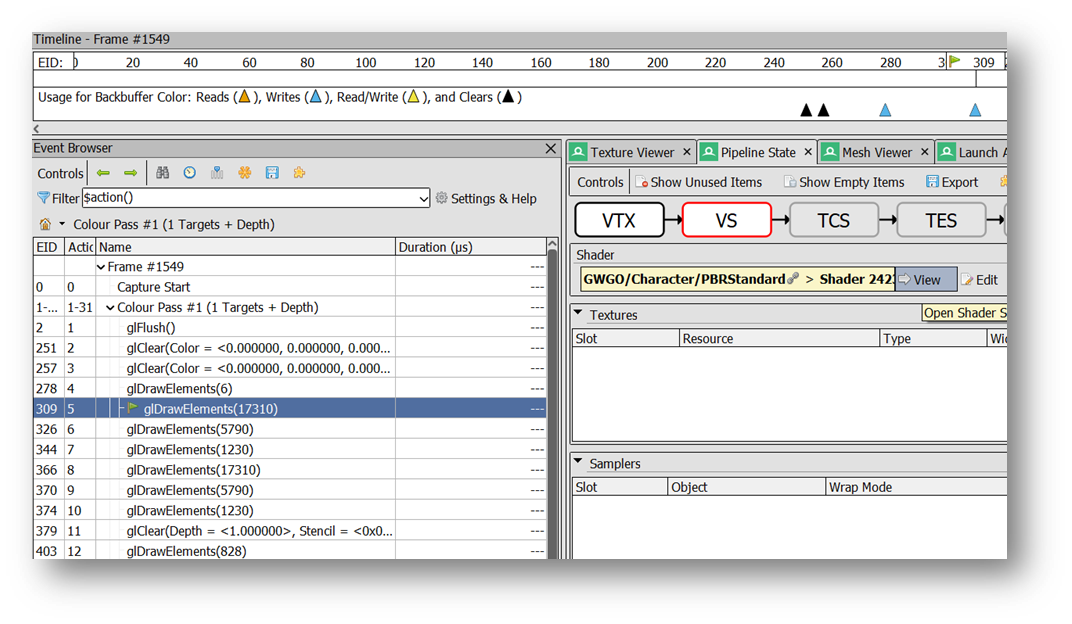
- On the Pipeline State tab, click View. You see the shader source.
- To edit the shader source, on the Pipeline State tab, click Edit.
- After editing, click Refresh, then click the same draw call.
- Check the result to see if it is changed. No matter where the change occurs, the result gives information about where the issue is.
Investigate the shader issue
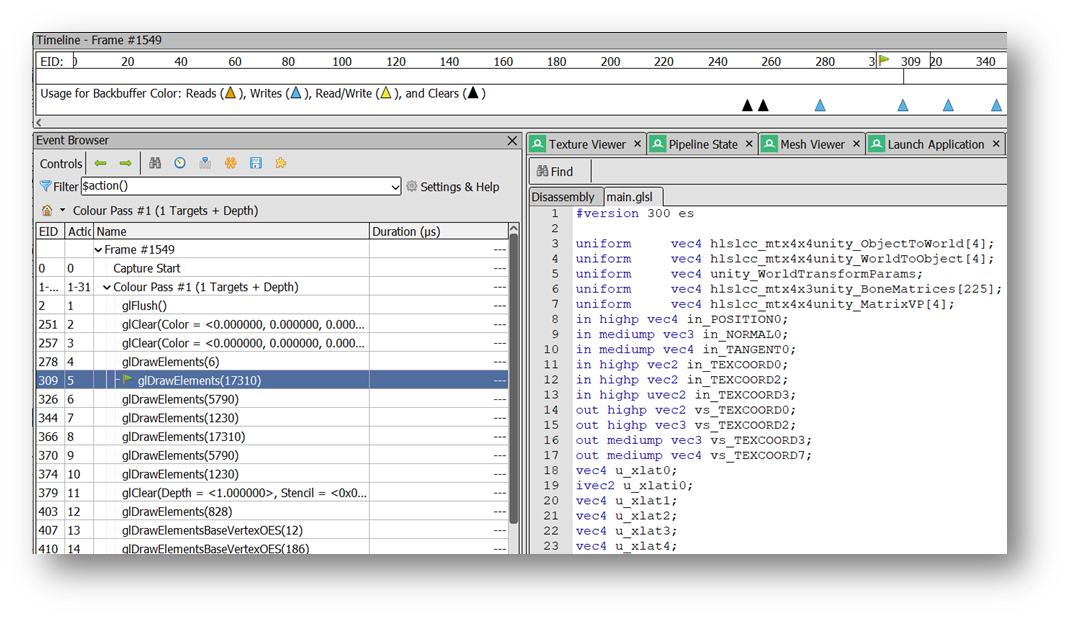
RenderDoc captures the trace, so that you can run draw calls, one by one, to find which draw call has the defective image.
- Click the tab Pipeline State to see which shader the current draw call is using.
- Modify the shader and compare the results.
If your modification fixes the issue, you have found the shader that encountered a compiler bug.
Investigate the issue in the following ways.
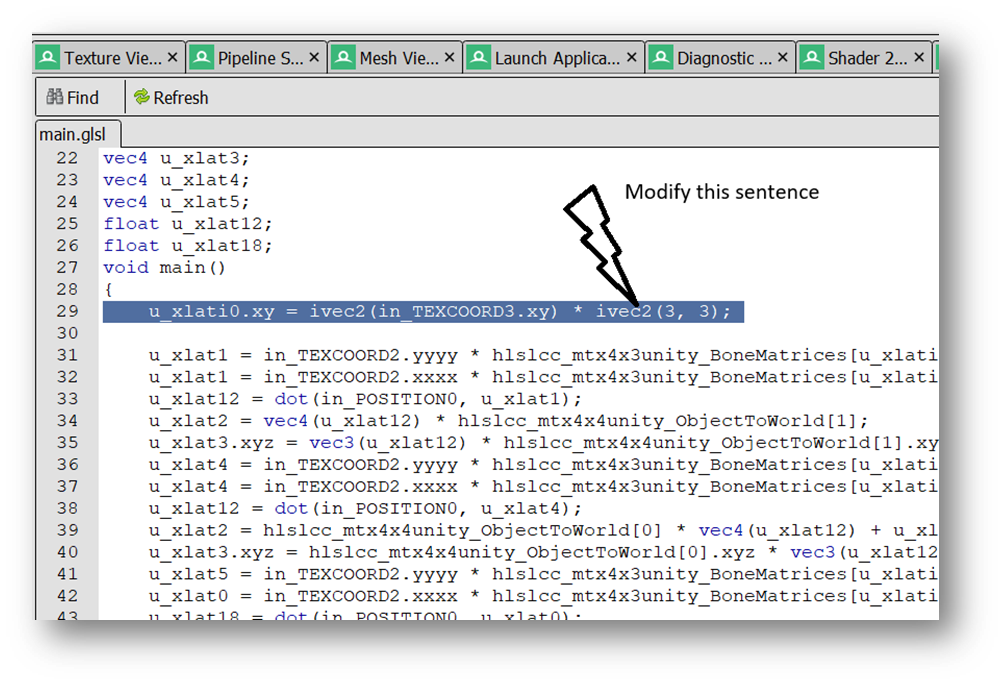
Find the executed shader source
The shader source you look at might be very long. It contains a lot of options and branches. For the current draw call, the GPU only executes some of the options and branches. Take care to identify the draw call that uses the options and branches. To help you quickly read and modify the shader source, you can skip the options and branches that the GPU does not execute. For example:
Pseudo shader source:
#version 300 es
…
void main()
{
   u_xlat12 = dot(in_POSITION0, u_xlat1);
   if (branch1)
   {

   } else {
       if (branch2)
       {
           if (branch3)
           {

           } else {
           	if (branch3)
           	{
                   if (branch4)
                   {
                       if(bran)h5)
                       {
			  if (branch5)
                          {
                             ....
                          }
                       }
                   }
           	}
	   }
       }

       if (branch1)00)
       {
       }
       u_xlat2 = vec4(u_xlat12) * hlslcc_mtx4x4unity_ObjectToWorld[1]
   }
}
In this example, only the 2 sentences shown in red, below, are executed. This is the code you are looking for. You can ignore the rest.
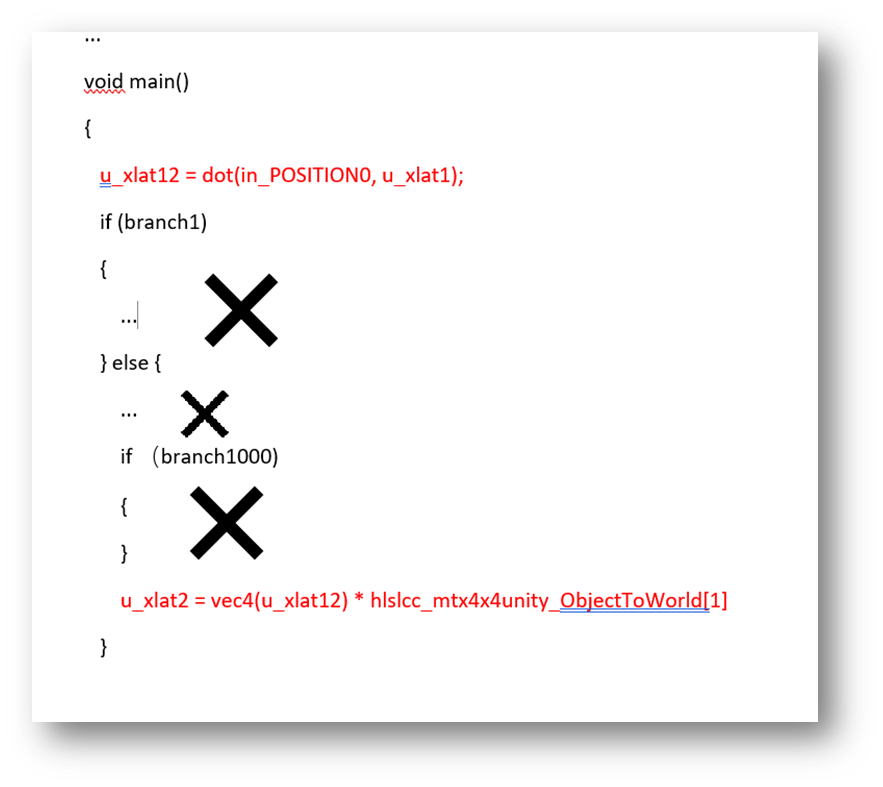
To find which codes are not executed, disable the branches one by one and then refresh:
- If the branch is executed, the result changes.
- If the branch is not executed, the result does not change.
You can then find which codes are not executed.
Find the final output and do a bottom-up investigation
For Vertex Shader (VS), find gl_position and the attributes to Fragment shader (FS). For FS, find gl_FragColor or a string, like “layout(location = 0) out vec4 SV_Target0;”.
Then, take a bottom-up traversal of calculation or variants related to the final output.
For example, find gl_FragColor first and then find the related variants a4, a3, and a1.
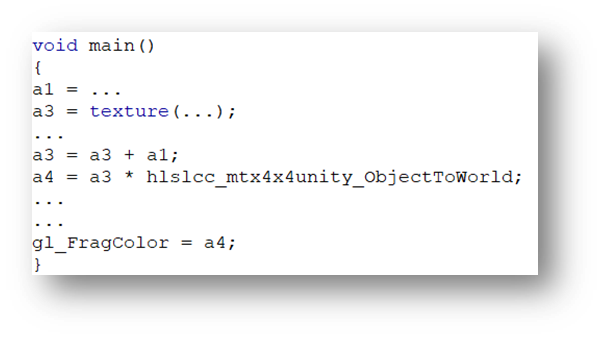
Assuming a1 or a3 is wrong, you can assign a1 or a3 to gl_FragColor, then you can visualize a1 or a3 to check the result. These steps help you identify which variant is wrong by matching the result against the golden result.
Change mediump or lowp into highp
Change mediump or lowp into highp, one by one, to check the result. If one of these changes eliminates the issue, then the problem is with precision.
Replace built-in functions with your own implementation
There are some built-in functions, like max, clamp, and dot. In some circumstances, the compiler might handle them wrongly. You can replace a build-in function with your own implementation to check the result. If your implementation works, then the build-in function does not work.
Recommend
About Joyk
Aggregate valuable and interesting links.
Joyk means Joy of geeK