

Automated performance monitoring and more with Arm Mobile Studio 2022.4
source link: https://community.arm.com/arm-community-blogs/b/graphics-gaming-and-vr-blog/posts/arm-mobile-studio-2022-4
Go to the source link to view the article. You can view the picture content, updated content and better typesetting reading experience. If the link is broken, please click the button below to view the snapshot at that time.

Automated performance monitoring and more with Arm Mobile Studio 2022.4

Arm Mobile Studio has undergone multiple enhancements in the last few releases to support easier performance analysis for game developers. With our latest release 2022.4 now available to download, we have made some bold moves - all our professional features are now free and available to all. We have also improved the performance of the tools with the experience of new users in mind, and added new features to analyze ray traced content, so you can start testing performance for the next generation of devices.
Here are some of the highlights from the latest release, and some from releases earlier in the year that you might have missed.
Professional CI features now available to all
It is no longer necessary to purchase an Arm Mobile Studio professional license to use the tools as part of a continuous integration (CI) workflow. Because we believe that scalable performance analysis should be available to all game studios, we have made all the professional features available in our free version.
To ensure a broad audience for your mobile game, you need to performance test as many devices as possible. It is incredibly time-consuming and expensive to do this manually for every device in a device farm. Also, you should test your content regularly throughout development. It is far easier to fix problems as they arise, than to patch multiple problems at the end of a release cycle.
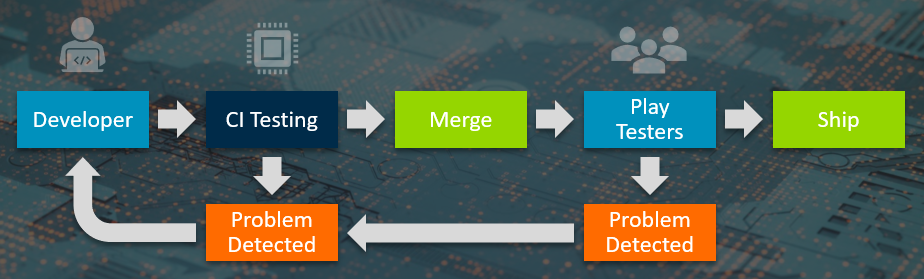
Running Arm Mobile Studio tools in headless mode, as part of a continuous integration system, makes automated performance testing across multiple devices possible. Run this every night, and get daily feedback on performance and can track performance changes over time. You can export report data as machine-readable files in CSV and JSON format for use in custom data analysis. Use it to build performance dashboards using any compatible database and visualization tool, such as the ELK stack.
Read our tutorial to help you get set up.
Android build variant support
You can now profile non-debuggable application builds on Android devices running “eng” or “userdebug” builds of the OS. Refer to the Android documentation for details about these build variants.
Support for new Arm CPUs and GPUs
Arm Mobile Studio tools support the latest Arm CPUs and GPUs:
DWARF5 debug support
Software profiling in Streamline now supports application binaries using the DWARF5 debug format.
Mali timeline events in Streamline
You can now monitor Mali timeline events in Streamline. This helps you to identify GPU scheduling issues where the non-fragment and fragment queues run serially, for all or part of frame. Ideally, the two workloads should overlap. If you see areas where one queue goes idle while the other is active, you could have a serialization problem. To identify problems that might cause the pipelines to wait, you can correlate counter samples with render passes and compute dispatches. Refer to our recommended best practices for workload pipelining and pipeline bottlenecks for more information.
Mali timeline events are shown as a custom activity map at the bottom of the Timeline view.
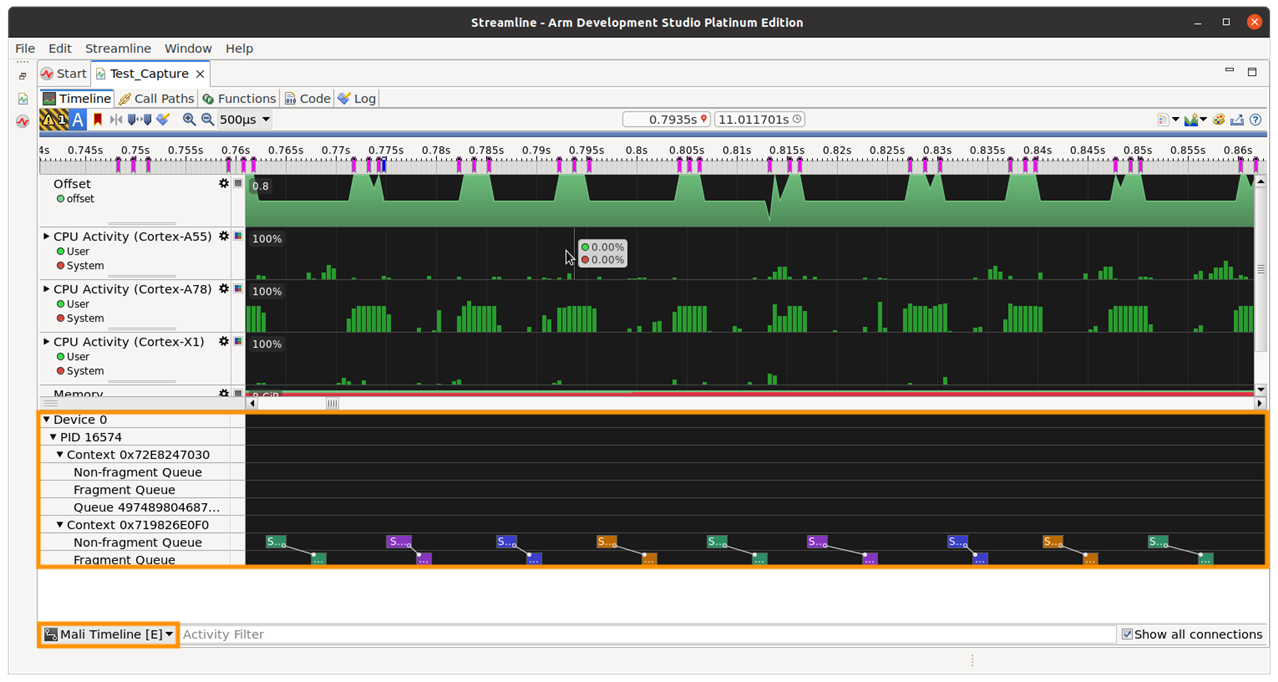
Refer to the Streamline user guide for instructions on how to capture Mali timeline events.
| Note: This feature requires an Android 10 device that has the Android Perfetto service and a compatible Mali device driver version r40p0 or later. |
Performance enhancements
At Arm, we understand that the usability of our tools is of paramount importance. That is why in every release, we allocate some engineering time to make our tools run faster. This time, for Streamline, we have significantly improved analysis time and memory footprint for software profiles that contain a large amount of application debug info.
The time taken to analyze a sample Unreal Engine project with around 3GB of debug info has dropped from 25 minutes to 2.5 minutes.
The mechanism by which Performance Advisor collects frame boundary and screenshot data from applications running on a mobile device, has been significantly enhanced, for both OpenGL ES and Vulkan. This new implementation improves reliability and reduces the performance impact on the target application.
| Note: For OpenGL ES applications, we can now only collect data with a layer driver, which requires Android 10 or newer. To use Performance Advisor with devices on earlier versions of Android, you will need to manually emit the required frame boundary annotations from the application. Refer to the Performance Advisor user guide for instructions on how to do this. |
Saving screenshots
When capturing slow frame screenshots (OpenGL ES only, for now) Performance Advisor skips screenshots if the previous screenshot is still being saved. This removes performance hitches caused by a backlog of screenshots building up in the application. Additionally, screenshots are now saved as .bmp images instead of uncompressed .png images, when running in uncompressed mode. This reduces the time it takes to capture and write a screenshot from 250ms to less than 80ms, reducing the performance impact on the application.
Performance Advisor region analysis
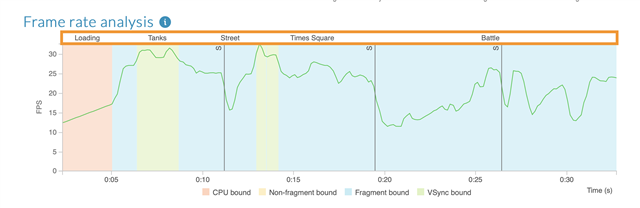
If your application uses region markers, to designate interesting time regions, those regions are visible on the Frame rate analysis chart in Performance Advisor. Additionally, data for each region is reported separately. This can be useful to give context to the report. However, if your application has multiple regions, the data reported may become too granular, making the report difficult to read.
In this release, you can now choose to omit certain regions from a Performance Advisor report if they are short or are nested beneath other regions. This provides you with more control over how your regions are analyzed.
When generating a report, use the following new pa command options to omit regions:
--region-report-min-length=length
Regions below a given minimum length are omitted from reports.--region-report-max-depth=level
Regions deeper than a given level in the region hierarchy are omitted from reports.
Mali Offline Compiler enhancements
We have made several enhancements to Mali Offline Compiler, our performance reporting tool for shader analysis.
Ray query performance feedback
The new Immortalis-G715 introduces hardware-accelerated ray tracing in a mobile power envelope, with support for both Vulkan ray queries and the full ray tracing pipeline. In this release, Mali Offline Compiler provides feedback for content using ray queries and all ray tracing pipeline stages.
The following example report has identified slow ray tracing in a fragment shader:
Mali Offline Compiler v7.8.0 (Build aeadf0)
 Copyright (c) 2007-2022 Arm Limited. All rights reserved.

 Configuration
 =============

 Hardware: Immortalis-G715 r0p0
 Architecture: Valhall
 Driver: r41p0-00rel0
 Shader type: Vulkan Fragment

 Main shader
 ===========

 Work registers: 64 (100% used at 50% occupancy)
 Uniform registers: 10 (15% used)
 Ray traversal contexts: 16 objects
 Stack spilling: 32 bytes
 16-bit arithmetic: 0%

                                 A      LS       V       T    Bound
 Total instruction cycles:    4.70   64.60    0.03    0.00       LS
 Shortest path cycles:        0.47   19.00    0.03    0.00       LS
 Longest path cycles:          N/A     N/A     N/A     N/A      N/A

 A = Arithmetic, LS = Load/Store, V = Varying, T = Texture

 Shader properties
 =================

 Has uniform computation: true
 Has side-effects: false
 Modifies coverage: false
 Uses late ZS test: false
 Uses late ZS update: false
 Reads color buffer: false
 Has slow ray traversal: true

 Note: This tool shows only the shader-visible property state.
 API configuration may also impact the value of some properties.
In the Main shader section, the report shows the number of ray traversal contexts allocated by the compiler. Each ray query or ray tracing pipeline traversal requires at least one traversal context. However, contexts might be shared by multiple traversals with a non-overlapping lifetime. Sometimes, a single source query or traversal might require multiple contexts. A multi-context traversal is slower than a single-context traversal.
The shader properties section reports that the shader has slow ray traversal, if the shader is using at least one ray traversal. This forces the compiler to fallback to the slower multi-context traversal behavior.
Vulkan ray query best practice guidelines that must be followed to avoid the slow traversal path have been added to the Mali Offline Compiler user guide.
Memory partitioning advice for vertex shaders
Mali GPUs from the Bifrost architecture onwards split the user shader into two parts, one computing position and one computing all the non-position attributes. Only the position is needed before geometry culling, so the non-position attribute shader only runs for visible vertices. To minimize redundant memory accesses Mali best practice recommends that you split the input attributes needed for the two shaders into two packed streams. Mali Offline Compiler vertex shader performance reports for Arm GPUs implementing the Bifrost architecture, or newer, now report the recommended memory partitioning for attribute streams.
 Recommended attribute streams
=============================

Position attributes
  - position (location=dynamic)

Non-position attributes
  - None
Expected shader core thread occupancy
Mali Offline Compiler now reports the expected shader core thread occupancy alongside the register counts. This reduces the need to refer to an external data sheet for the thread occupancy information.
Main shader
 ===========

 Work registers: 64 (100% used at 50% occupancy)
 Uniform registers: 10 (15% used)
 Ray traversal contexts: 16 objects
 Stack spilling: 32 bytes
 16-bit arithmetic: 0%
More Mali Offline Compiler features
Here are a few more updates we made to Mali Offline Compiler:
- All performance reports for Arm GPUs implementing the Valhall architecture now report a single arithmetic cost, based on a microarchitecture-aware cost model. Component costs per arithmetic instruction type are still available using the
--detailedcommand-line option. - The load/store unit cost model for Bifrost and Valhall architecture GPUs has been improved, and now correctly reflects the lower access cost for uniform loads and stack access.
- Updated the Compiler backend for Bifrost and Valhall architecture GPUs to the r41p0
- Updated the Khronos glslangValidator frontend, used for compiling GLSL source into SPIR-V IR, to support SPIR-V 1.6 features.
- Vulkan shaders compiled directly from GLSL source can now use entry points other than “main()” by specifying the
--namecommand-line option. - Added OpenCL 3.0 support for SPIR-V compute kernels.
- Added filtering to remove duplicate compiler warnings in performance reports.
Summary
We hope you find something in this release that enhances your performance analysis workflow. Whether you are a small indie developer, or a large games studio, Arm Mobile Studio has features to help your games perform well across a wide range of devices. Building performance analysis at scale into your development workflow is now more easily accessible with our free edition. Performance analysis is now faster, and you have more control over what data you collect.
We expect mobile devices with our latest Immortalis-G715 GPUs to be shipping in 2023. The new features in Mali Offline Compiler for hardware accelerated ray tracing can help provide insights for how future mobile hardware handles your ray-traced content.
For the full list of changes, fixes and enhancements, along with the installation guidelines, refer to the 2022.4 Release Note.
Recommend
About Joyk
Aggregate valuable and interesting links.
Joyk means Joy of geeK