

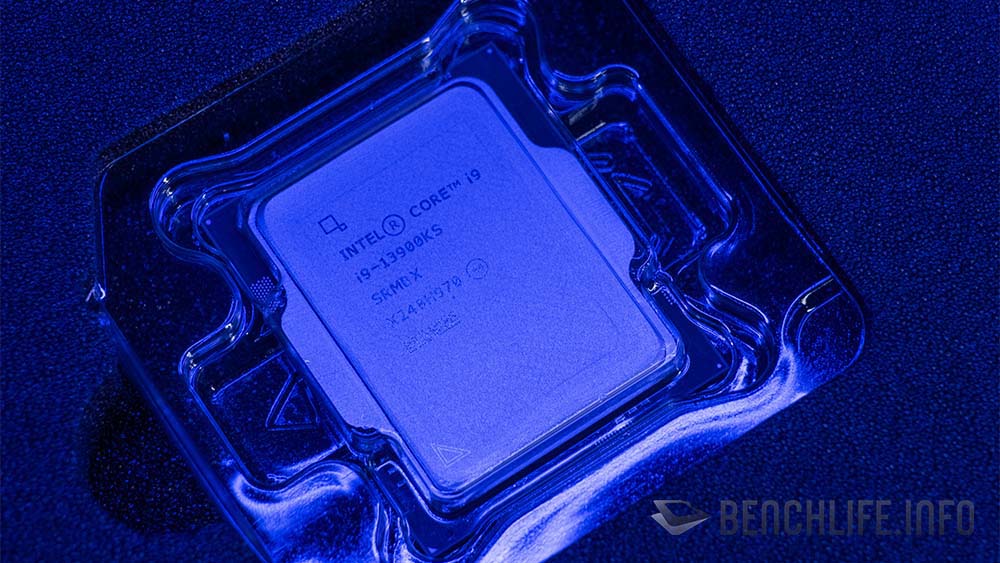
出廠預設時脈就達 6.0GHz,Intel Core i9-13900KS 搭配 ROG Maximus Z790 Hero 實測
source link: https://benchlife.info/intel-core-i9-13900ks-with-rog-maximus-z790-hero-review/
Go to the source link to view the article. You can view the picture content, updated content and better typesetting reading experience. If the link is broken, please click the button below to view the snapshot at that time.

出廠預設時脈就達 6.0GHz,Intel Core i9-13900KS 搭配 ROG Maximus Z790 Hero 實測
時脈最高可以達到 6.0GHz,來看看它實際表現到底如何。
CES 2023 迎來 65W 的 13 代 Core 系列處理器,緊接著在 1 月 12 日推出處理器核心時脈可以達到 6.0GHz 的 Intel Core i9-13900KS,讓整個 Intel 的 Raptor Lake-S 更為完整。
相較於 Intel Core i9-13900K,新推出的 Intel Core i9-13900KS 的核心時脈推進到 6.0GHz,雖然只是 Max Turbo Boost 與 Thermal Velocity Boost 達到 6.0GHz,但這對整個 x86 架構處理器而言,是一個相當大的推進;Intel Core i9-13900K 是 Max Turbo Boost 與 Thermal Velocity Boost 達到 5.8GHz。
除了更好的晶圓體質外,Intel Core i9-13900KS 的 PL1 與 PL2 在 Extreme Power 模式下更是開放到 320W,高於 Intel Core i9-13900K 的 253W。
Performance Power 模式下,Intel Core i9-13900KS 與 Core i9-13900K 同為 253W。
扣除最高時脈可以達到 6.0GHz,Intel Core i9-13900KS 的 Performance Cores 基本時脈從 3.0GHz 調高至 3.2GHz,同時 Efficient Cores 也從 2.2GHz 提高至 2.4GHz,這樣的作法當然也讓 Intel Core i9-13900K 的 125W TDP 提升至 Intel Core i9-13900KS 的 150W。
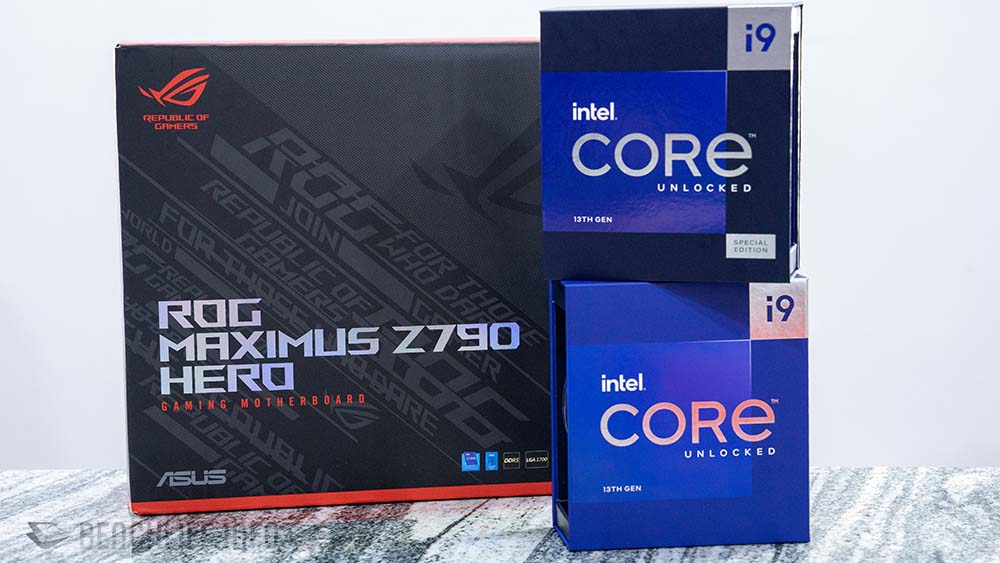
測試部分,我們這次平台使用 ASUS ROG Maximus Z790 Hero 主機板、DDR5-6000 MT/s 記憶體(超頻至 DDR5-6400 MT/s)與 NVIDIA GeForce RTX 4090 Founders Edition 顯示卡,搭配 Intel Core i9-13900K 與 AMD Ryzen 7 5800X3D(使用 Crosshair VIII Hero 主機板)進行測試比較。
3DMark – Intel Core i9-13900K
| 3DMark | Intel Core i9-13900K | Intel Core i9-13900KS | |
|---|---|---|---|
| TIme Spy | 31531 | 32599 | 3.276% |
| Graphic score | 36609 | 36688 | 0.215% |
| CPU score | 17655 | 19981 | 11.641% |
| Time Spy Extreme | 18050 | 18155 | 0.578% |
| Graphic score | 19371 | 19274 | -0.503% |
| CPU score | 13020 | 13663 | 4.706% |
| Fire Strike | 45759 | 46685 | 1.984% |
| Graphic score | 62386 | 65365 | 4.557% |
| Physics score | 54041 | 53383 | -1.233% |
| Combo score | 14176 | 14013 | -1.163% |
| Fire Strike Extreme | 38128 | 38465 | 0.876% |
| Graphic score | 44614 | 45100 | 1.078% |
| Physics score | 54170 | 53564 | -1.131% |
| Combo score | 15044 | 15277 | 1.525% |
| Fire Strike Ultra | 24502 | 24428 | -0.303% |
| Graphic score | 24632 | 24677 | 0.182% |
| Physics score | 54057 | 53658 | -0.744% |
| Combo score | 13178 | 12907 | -2.100% |
| Port Royal | 25698 | 25710 | 0.047% |
| Speed Way | 9762 | 9993 | 2.312% |
| CPU Profile | |||
| Max Threads | 16266 | 16887 | 3.677% |
| 16 threads | 11317 | 11766 | 3.816% |
| 8 threads | 8522 | 9011 | 5.427% |
| 4 threads | 4558 | 4768 | 4.404% |
| 2 threads | 2341 | 2458 | 4.760% |
| 1 threads | 1208 | 1270 | 4.882% |
3DMark – AMD Ryzen 7 5800X3D
| 3DMark | AMD Ryzen 7 5800X3D | Intel Core i9-13900KS | |
|---|---|---|---|
| TIme Spy | 27294 | 32599 | 16.274% |
| Graphic score | 36143 | 36688 | 1.485% |
| CPU score | 11433 | 19981 | 42.781% |
| Time Spy Extreme | 13796 | 18155 | 24.010% |
| Graphic score | 19195 | 19274 | 0.410% |
| CPU score | 5319 | 13663 | 61.070% |
| Fire Strike | 51585 | 46685 | -10.496% |
| Graphic score | 84713 | 65365 | -29.600% |
| Physics score | 29559 | 53383 | 44.628% |
| Combo score | 18324 | 14013 | -30.764% |
| Fire Strike Extreme | 37363 | 38465 | 2.865% |
| Graphic score | 46413 | 45100 | -2.911% |
| Physics score | 29355 | 53564 | 45.196% |
| Combo score | 18198 | 15277 | -19.120% |
| Fire Strike Ultra | 23867 | 24428 | 2.297% |
| Graphic score | 25106 | 24677 | -1.738% |
| Physics score | 29409 | 53658 | 45.192% |
| Combo score | 14444 | 12907 | -11.908% |
| Port Royal | 25324 | 25710 | 1.501% |
| Speed Way | 9869 | 9993 | 1.241% |
| CPU Profile | |||
| Max Threads | 7361 | 16887 | 56.410% |
| 16 threads | 7355 | 11766 | 37.489% |
| 8 threads | 6426 | 9011 | 28.687% |
| 4 threads | 3481 | 4768 | 26.992% |
| 2 threads | 1804 | 2458 | 26.607% |
| 1 threads | 906 | 1270 | 28.661% |
Gaming – Intel Core i9-13900K
| Intel Core i9-13900K | Intel Core i9-13900KS | ||
|---|---|---|---|
| 4K gaming | |||
| Borderlands 3 : bad ass | 130.78 | 130.16 | -0.476% |
| Cyberpunk2077 | 84.37 | 83.27 | -1.321% |
| Metro Exodus | 138.79 | 136.87 | -1.403% |
| F1 22 | 197 | 198 | 0.505% |
| Far Cry 6 | 138 | 139 | 0.719% |
| Rainbow Six Siege | 557 | 563 | 1.066% |
| Shadow of the Tomb Raider(Highest) | 186 | 185 | -0.541% |
| Total War: Troy | 154.4 | 154.3 | -0.065% |
| 1440p Gaming | |||
| Borderlands 3 : bad ass | 227.37 | 226.37 | -0.442% |
| Cyberpunk2077 | 166.68 | 164.36 | -1.412% |
| Metro Exodus | 179.12 | 175.44 | -2.098% |
| F1 22 | 245 | 246 | 0.407% |
| Far Cry 6 | 178 | 179 | 0.559% |
| Rainbow Six Siege | 637 | 658 | 3.191% |
| Shadow of the Tomb Raider(Highest) | 290 | 286 | -1.399% |
| Total War: Troy | 245.1 | 246 | 0.366% |
| 1080p Gaming | |||
| Borderlands 3 : bad ass | 275.46 | 280.23 | 1.702% |
| Cyberpunk2077 | 231.92 | 237.28 | 2.259% |
| Metro Exodus | 189 | 186.99 | -1.075% |
| F1 22 | 272 | 272 | 0.000% |
| Far Cry 6 | 185 | 186 | 0.538% |
| Rainbow Six Siege | 636 | 638 | 0.313% |
| Shadow of the Tomb Raider(Highest) | 311 | 314 | 0.955% |
| Total War: Troy | 294 | 287 | -2.439% |
Gaming – AMD Ryzen 7 5800X3D
| AMD Ryzen 7 5800X3D | Intel Core i9-13900KS | ||
|---|---|---|---|
| 4K gaming | |||
| Borderlands 3 : bad ass | 125.22 | 130.16 | 3.795% |
| Cyberpunk2077 | 84.03 | 83.27 | -0.913% |
| Metro Exodus | 134.07 | 136.87 | 2.046% |
| F1 22 | 193 | 198 | 2.525% |
| Far Cry 6 | 134 | 139 | 3.597% |
| Rainbow Six Siege | 571 | 563 | -1.421% |
| Shadow of the Tomb Raider(Highest) | 186 | 185 | -0.541% |
| Total War: Troy | 152.1 | 154.3 | 1.426% |
| 1440p Gaming | |||
| Borderlands 3 : bad ass | 217.97 | 226.37 | 3.711% |
| Cyberpunk2077 | 162.07 | 164.36 | 1.393% |
| Metro Exodus | 171.59 | 175.44 | 2.194% |
| F1 22 | 240 | 246 | 2.439% |
| Far Cry 6 | 149 | 179 | 16.760% |
| Rainbow Six Siege | 684 | 658 | -3.951% |
| Shadow of the Tomb Raider(Highest) | 291 | 286 | -1.748% |
| Total War: Troy | 229 | 246 | 6.911% |
| 1080p Gaming | |||
| Borderlands 3 : bad ass | 253.93 | 280.23 | 9.385% |
| Cyberpunk2077 | 193.08 | 237.28 | 18.628% |
| Metro Exodus | 181.98 | 186.99 | 2.679% |
| F1 22 | 263 | 272 | 3.309% |
| Far Cry 6 | 152 | 186 | 18.280% |
| Rainbow Six Siege | 680 | 638 | -6.583% |
| Shadow of the Tomb Raider(Highest) | 317 | 314 | -0.955% |
| Total War: Troy | 237.6 | 287 | 17.213% |
CPU and Creator – Intel Core i9-13900K
| Intel Core i9-13900K | Intel Core i9-13900KS | ||
|---|---|---|---|
| Cinebench R23 | |||
| Multi Core | 39620 | 40266 | 1.604% |
| Single Core | 2145 | 2332 | 8.019% |
| Cinebench R20 | |||
| Multi Core | 15531 | 15724 | 1.227% |
| Single Core | 849 | 896 | 5.246% |
| Geekbench | |||
| Single | 2202 | 2293 | 3.969% |
| Multi | 24058 | 26883 | 10.508% |
| CPU-Z | |||
| Single | 934.6 | 979.6 | 4.594% |
| Multi | 16981.5 | 17167.4 | 1.083% |
| PC Mark | |||
| Essential | 12041 | 12547 | 4.033% |
| Productivity | 12881 | 13368 | 3.643% |
| Digtal Content Creation | 19061 | FAIL | - |
| CrossMark | |||
| overall | 2373 | 2604 | 8.871% |
| productivity | 2156 | 2366 | 8.876% |
| creativty | 2779 | 2931 | 5.186% |
| responsiveness | 1971 | 2434 | 19.022% |
| Intel Core i9-13900K | Intel Core i9-13900KS | ||
|---|---|---|---|
| Blender | |||
| Monster | 272 | 272 | 0.000% |
| Junk Store | 161 | 172 | 6.395% |
| classroom | 130 | 133 | 2.256% |
| Indigo Bench | |||
| Bedroom | 4.141 | 4.259 | 2.771% |
| Supercar | 12.509 | 12.784 | 2.151% |
| Pugetbench DaviniCi | |||
| Overall | 3157 | 3357 | 5.958% |
| 4K Media Score | 214 | 215 | 0.465% |
| GPU Effects Score | 275 | 275 | 0.000% |
| Fusion Score | 458 | 517 | 11.412% |
| Pugetbench Premiere Pro | |||
| Overall | 1700 | 1412 | -20.397% |
| Standar Export Score | 134 | 143.8 | 6.815% |
| Standar Live Playback Score | 222.5 | 119.1 | -86.818% |
| Effects Score | 153.4 | 160.5 | 4.424% |
| GPU score | 142.4 | 147.5 | 3.458% |
CPU and Creator – AMD Ryzen 7 5800X3D
| AMD Ryzen 7 5800X3D | Intel Core i9-13900KS | ||
|---|---|---|---|
| Cinebench R23 | |||
| Multi Core | 21055 | 40266 | 47.710% |
| Single Core | 1613 | 2332 | 30.832% |
| Cinebench R20 | |||
| Multi Core | 8261 | 15724 | 47.462% |
| Single Core | 630 | 896 | 29.688% |
| Geekbench | |||
| Single | 1680 | 2293 | 26.734% |
| Multi | 13882 | 26883 | 48.361% |
| CPU-Z | |||
| Single | 676.4 | 979.6 | 30.951% |
| Multi | 9514.6 | 17167.4 | 44.578% |
| #DIV/0! | |||
| PC Mark | #DIV/0! | ||
| Essential | 10057 | 12547 | 19.845% |
| Productivity | 9633 | 13368 | 27.940% |
| Digtal Content Creation | 15412 | FAIL | - |
| CrossMark | |||
| overall | 1443 | 2604 | 44.585% |
| productivity | 1383 | 2366 | 41.547% |
| creativty | 1760 | 2931 | 39.952% |
| responsiveness | 905 | 2434 | 62.818% |
| AMD Ryzen 7 5800X3D | Intel Core i9-13900KS | ||
|---|---|---|---|
| Blender | |||
| Monster | 152 | 272 | 44.118% |
| Junk Store | 99 | 172 | 42.442% |
| classroom | 73.9 | 133 | 44.436% |
| Indigo Bench | |||
| Bedroom | 2.972 | 4.259 | 30.218% |
| Supercar | 6.312 | 12.784 | 50.626% |
| Pugetbench DaviniCi | |||
| Overall | 2437 | 3357 | 27.405% |
| 4K Media Score | 139 | 215 | 35.349% |
| GPU Effects Score | 230 | 275 | 16.364% |
| Fusion Score | 374 | 517 | 27.660% |
| Pugetbench Premiere Pro | |||
| Overall | 821 | 1412 | 41.856% |
| Standar Export Score | 76.8 | 143.8 | 46.592% |
| Standar Live Playback Score | 60.5 | 119.1 | 49.202% |
| Effects Score | 109.1 | 160.5 | 32.025% |
| GPU score | 109.2 | 147.5 | 25.966% |
遊戲部分,Intel Core i9-13900K 與 Intel Core i9-13900KS 的差異並沒有太過於顯著,但部分遊戲可以見到 Intel Core i9-13900KS 是小幅度領先;其餘與 Intel Core i9-13900K 進行比較的部分,也都是 Intel Core i9-13900KS 小幅度領先,只是差距明顯並不太大。
如果與 AMD Ryzen 7 5800X3D 相比較的話,Intel Core i9-13900KS 領先幅度就非常明顯。
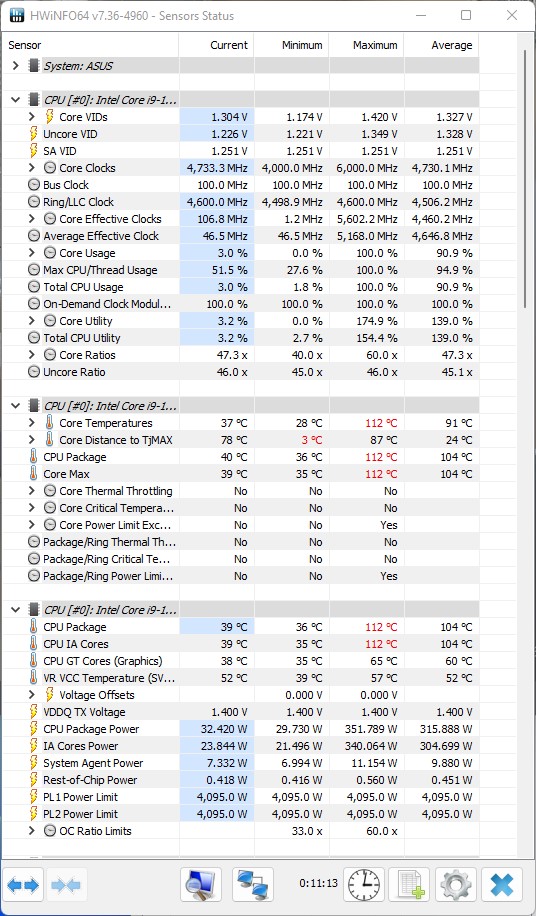
大家可能比較在意 Intel Core i9-13900KS 的功耗與溫度表現,我們透過 Cinebench R23 10 分鐘循環測試,搭配 HWInfo 了解到 Intel Core i9-13900KS 實際表現;這次測試使用的是 ROG RYUJIN II 360 一體式水冷進行,並且將溫度上限開放到 115 度。
測試的最高時脈會衝到 112 度,但 Intel Core i9-13900KS 在執行 Cinebench R23 循環測試中的平均溫度在 91 度。
透過 HWInfo 資訊,我們也可以見到 CPU 功耗最高來到 310W,至於平均則是 315W 左右。
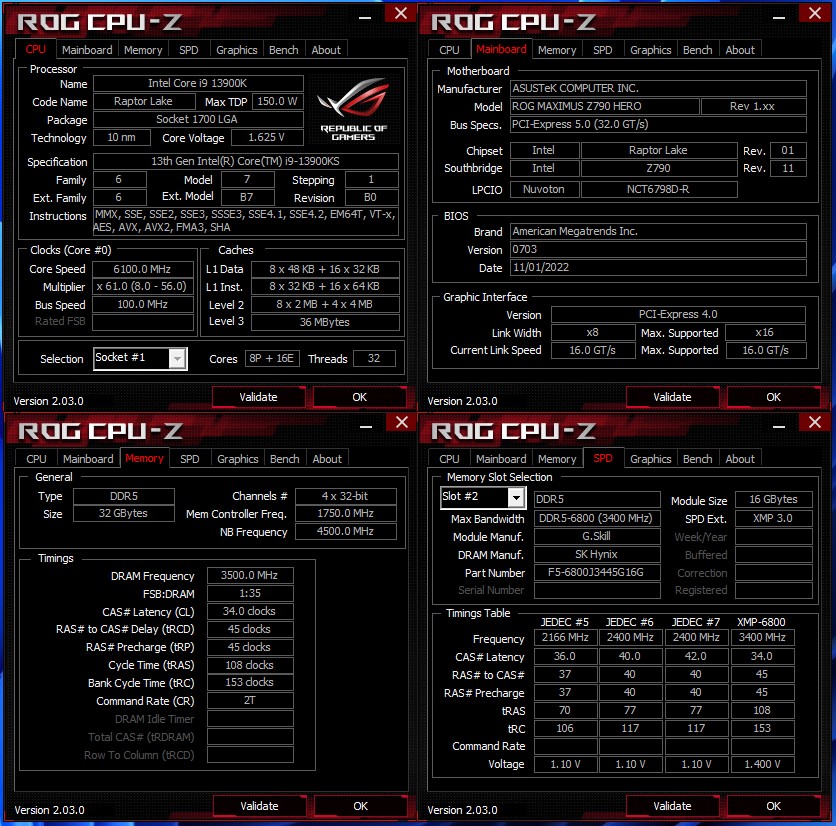
超頻部分,我們試著將 Intel Core i9-13900KS 全核心調整至 6.1GHz,記憶體部分則是達到 DDR5-7000 MT/s。
如果要我們在 Intel Core i9-13900K 與 Intel Core i9-13900KS 做選擇的話,預算充足首選會是 6.0GHz 的 Intel Core i9-13900KS,但 Intel Core i9-13900K 也是一個相當好的選擇。
若想選購 Intel Core i9-13900KS 的玩家,強烈建議搭配一組旗艦級的散熱器,且板子部分不要選擇太入門的 Intel Z790 晶片主機板。
Intel Core i9-13900KS 最高核心可以達到 6.0GHz,雖然只有其中 2 顆 Performance Cores 核心,但已經讓整個 x86 架構處理器來到一個新的境界,這也讓我們期待 Intel 在下一世代處理器會端出新意。

Recommend
About Joyk
Aggregate valuable and interesting links.
Joyk means Joy of geeK