

EXPOSED! Data harvesting takes info from year end summaries
source link: https://decentralize.today/exposed-how-data-harvesting-gleans-your-information-from-online-year-end-summaries/
Go to the source link to view the article. You can view the picture content, updated content and better typesetting reading experience. If the link is broken, please click the button below to view the snapshot at that time.

DT Context:
Let’s talk about those year-in-review data visualizations
They’re a reminder of just how much commercial surveillance these services run on us.

Yes, it’s hilarious that Spotify knows you listen to clowncore in the evenings or hygge trad goth vampire in the mornings, but let’s talk about the data collection practices behind those inferences.
Once again, Spotify Wrapped took the Internet by storm in the final weeks of the calendar year. The music service’s personalized year-in-review presentations show a user’s usage data back to the user, providing an easy-to-digest (and easy-to-disseminate) visual display of the user’s yearlong interactions with Spotify.
As part of this presentation, Spotify tells exactly — to the minute — how long the user listened to music and podcasts that year. The company informs the user about the user’s top songs, top artists, and even how much more the user engaged with Spotify than other users.

And with bright colors and humorous descriptions, Spotify Wrapped playfully presents this data back to the user — almost as if the company is going out of its way to distract the user from seeing this presentation as creepy and pervasive commercial surveillance.
But as the saying goes: slapping lipstick on a pig doesn’t change that it’s still a pig.
Despite the lighthearted visual adornments strewn over this data-engorged presentation, the fact remains that Spotify is gleefully showing users just how much commercial surveillance it conducts on them. And Spotify is doing so in hopes that users will share their personalized data visualizations on social media to attract others to use Spotify.

And it works — people love Spotify Wrapped. It’s a “masterful coup of free advertising.”
In fact, the popularity of Spotify Wrapped has inspired other companies to join the bandwagon of presenting their commercial surveillance practices to users in a visually fun way, including Reddit, The Washington Post, Strava, Duolingo, and more.
But again, this is a coy flaunting of the results of a company’s personalized commercial surveillance practices as a means of attracting others into that surveillance ecosystem.
DRAWING INFERENCES FROM YEAR-IN-REVIEW DATA
Lost within the zany fun of year-in-review data presentations is a hard truth: companies collect this data because it’s valuable.
These treasure troves of personal data contain “insights into consumer behavior, emerging market trends, even predictors of the future.”
2 These insights stem from the combination of various data points to make educated and statistical determinations about a particular individual’s past, present, and future decisions.
In other words — inferences.
To demonstrate, let’s examine Steam, the video game digital distribution service, which created the Steam Replay. This year-in-review shows the user how many sessions they played a particular video game, how many days in a row they played that game, and whether they used a mouse and keyboard to play games.
In addition, Steam Replay shows the user a breakdown of the user’s monthly playtimes.

Ignoring the colorful distinctions within each column, we can quickly discern that this particular user experienced a lifestyle shift in March that would cause them to increase their monthly consumption of video games.
But the question is: what happened?
We could speculate forever — loss of a loved one, career change, new video game release — but remember, a user’s monthly video game playtime is merely one data point. If we added another data point into the mix — say, the individual’s relationship status shifting to single at some point during the year — we can infer from Steam Replay’s data when the person became single (i.e., March).
Let’s do another:
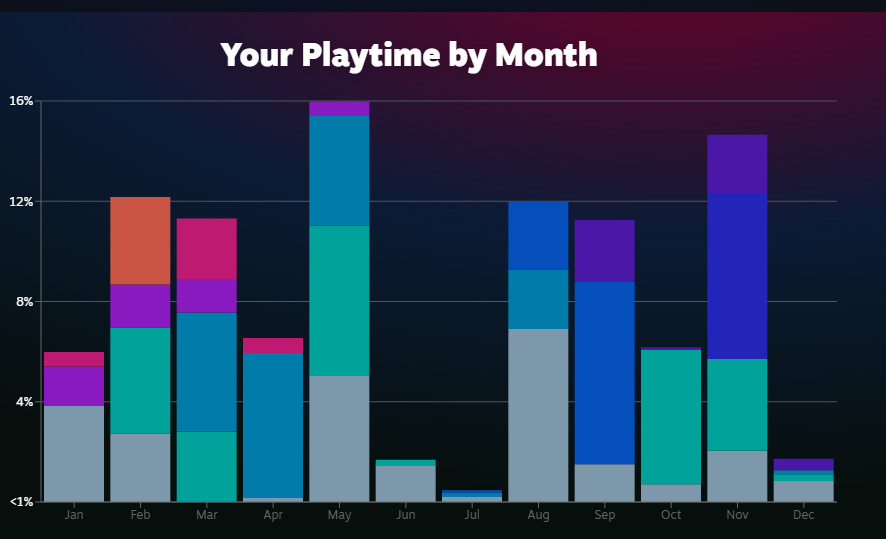
This particular user experienced some interesting life events throughout the year, given that April brought a dip in video game consumption, followed by a spike and then a massive dip for two months.
But what happened?
Well, if we know the user’s location and approximate age — both of which are likely collected by Steam, given that video games have age verification barriers and geolocation restrictions — we could infer a lot.
If the user lives in the United States and is in their thirties, we may infer that they are either a college teacher or student, because they prioritized final exams in April and celebrated completion in May.
Going further, if we know the user attends a law school, we can infer the user is likely a student and they likely took the July bar exam — thus explaining the absolute dip in video game consumption during the summer months.
And on and on.
The point being, the more data collected about the individual, the more inferences one can make about the individual’s life. And the more accurate those inferences become.
And as we see from these year-in-review presentations, companies are collecting a lot of data from consumers.
THE NORMALIZATION OF COMMERCIAL SURVEILLANCE
Admittedly, the corporate push to produce personalized year-in-review data visualizations is entertaining, but it also normalizes the commercial surveillance practices happening on a minute-by-minute basis.
And yes, the year-in-reviews are primarily a form of advertising, but the advertising is calling consumers to act by becoming a customer and entering into the company’s particular data collection practices. Because, after all, more users equals more data; more data equals more data points; more data points equals more inferences — which, ultimately, may enable the company to predict more accurately how the user will act in the future.
But this begs the question: should we allow such a normalization to happen? Are we okay with companies blatantly and openly flaunting their data collection practices merely because they dress up the personalized results in bright colors and humorous quips?
Or, should we ignore the flashy adornments and call it what it is: commercial surveillance?
https://www.theatlantic.com/technology/archive/2018/12/spotify-wrapped-and-data-collection/577930/
https://www.technologyreview.com/2021/11/16/1040036/capitalizing-on-the-data-economy/
Recommend
About Joyk
Aggregate valuable and interesting links.
Joyk means Joy of geeK