

O11y Guide: Exploring Perses API and Tooling
source link: https://dzone.com/articles/o11y-guide-exploring-perses-api-and-tooling
Go to the source link to view the article. You can view the picture content, updated content and better typesetting reading experience. If the link is broken, please click the button below to view the snapshot at that time.

O11y Guide: Exploring Perses API and Tooling
In this article, journey into the world of cloud-native observability and continue the exploration of an open-source project called Perses.
In this seventh installment of the series covering my journey into the world of cloud-native observability, I'm continuing to explore an open-source project called Perses.
After laying out the groundwork for this series in the initial article, I spent some time in the second article sharing who the observability players are. I also discussed the teams that these players are on in this world of cloud-native o11y. For the third article, I looked at the ongoing discussion around monitoring pillars versus phases. In the fourth article, I talked about keeping your options open with open-source standards. In my last installment, the fifth article in this series, I talked about bringing monolithic applications into the cloud-native o11y world. In my sixth and last article, I provided you with an introduction to a new open-source dashboard and visualization project and shared how to install the project on your local developer machine.
Being a developer from my early days in IT, it's been very interesting to explore the complexities of cloud-native o11y. Monitoring applications goes way beyond just writing and deploying code, especially in the cloud-native world. One thing remains the same: maintaining your organization's architecture always requires both a vigilant outlook and an understanding of available open standards.
In this seventh article, we'll be exploring the Perses application programming interface (API) and tooling. This is a preview of the third lab developed for my hands-on workshop dedicated to exploring dashboards and visualization.
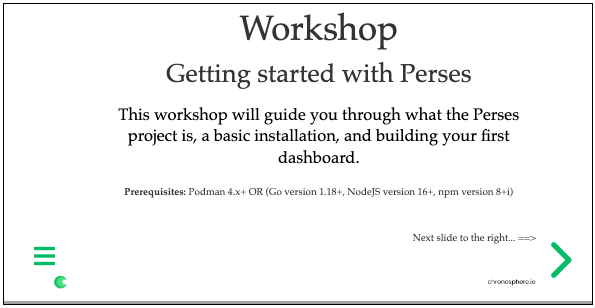
This article is part of my ongoing effort to get practical hands-on experience in the cloud-native o11y world. Today you'll be learning about the available tooling in the Perses project and how its API works on your local development machine. This is one lab in the more extensive free online workshop. Feel free to start from the very beginning of this workshop here if you missed anything previously.
Now let's dive into the Perses project API and tooling lab. Note this article is only a short summary, so please see the complete lab found online (Lab 3) to work through the API and tooling yourself:
The following is a short overview of what is in this specific lab of the Perses workshop.
API and Tooling
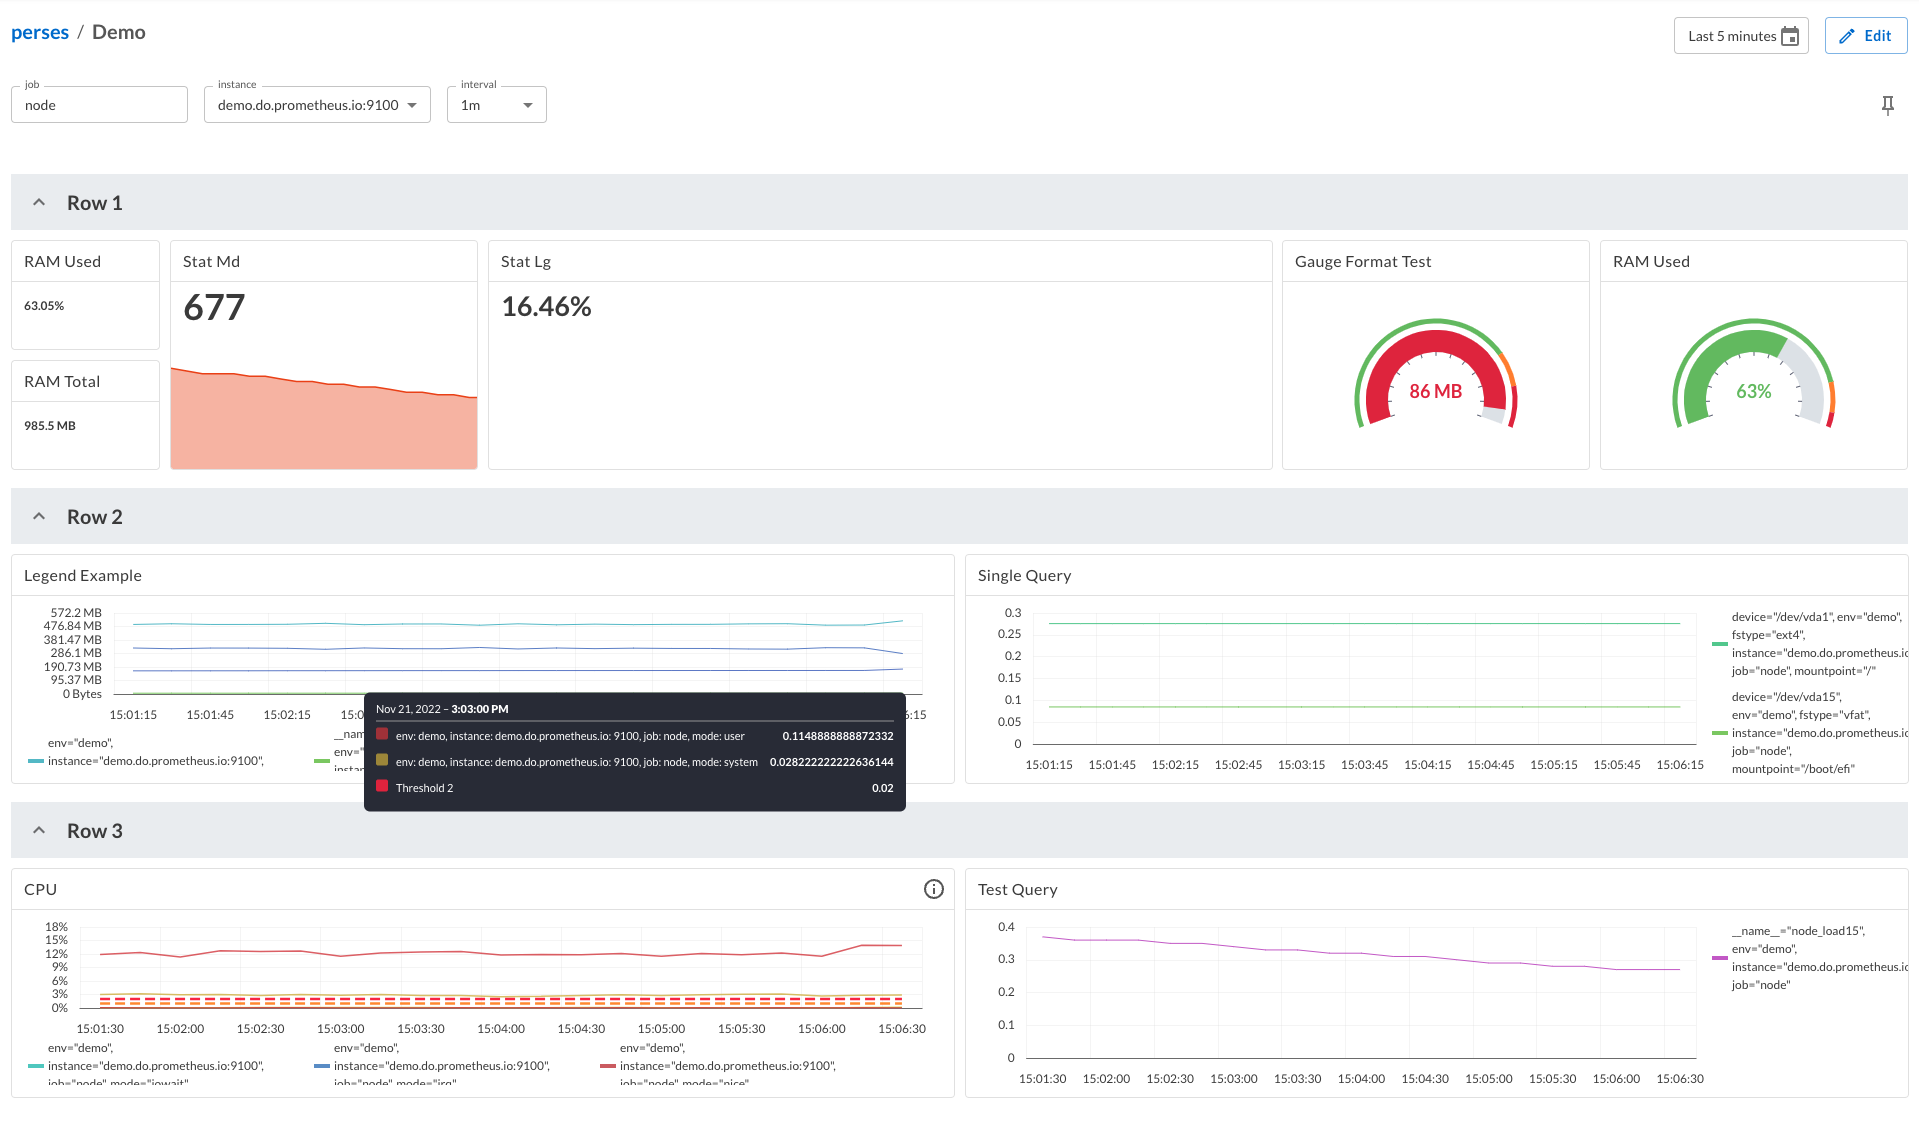
This lab explores the Perses API and how to use the Perses command line tooling to gain insights into the currently available projects, dashboards, and data sources. After installing Perses in the previous lab, you have the dashboard open in your browser. There is an application programming interface (API) available for you to gain insights into the configuration applied to your Perses server. You can find out more about the projects, dashboards, and data sources that have been created. This can be handy to start with existing resources and modify them for your own versions.
This is how we get started exploring some of the provided API operations for handling a Perses resource, which can be one of the following:
- Project
- Dashboard
- Datasource
There are five API operations that can be applied to any resource, each providing us the ability to manipulate resources:
- Creating a resource
- Updating a resource
- Deleting a resource
- Retrieving a single resource
- Retrieving a list of resources

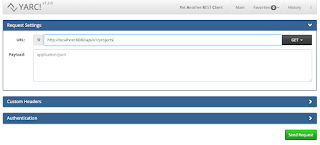
In this lab, I share how to leverage this API from a browser and from an API client so that the raw browser output is then formatted in a nicely readable format. This section of the lab ends with a pointer to the official Perses documentation.

Next up, this lab dives into the tooling, which is the Perses command line executable known as the percli. If you built the project from the source code, you have built this executable, but if you are using the container image installation then you will find an executable percli in the Perses Easy Install project in the support directory at support/bin/percli. The rest of this lab is dedicated to exploring how to use this tooling and we explore a few of the interesting commands:
login: Log in to an instance of the Perses API.get: Request a response from the Perses API.project: Select a project to be used as the default.describe: Request details for a specific resource.delete: Delete a specific resource.apply: Create or update existing resources using JSON or YAML file.
You learn by using each and every one of these commands through the percli tooling and are provided with both the before and after views of your system as you work through it all.
You're now one step closer to creating your own dashboards and visualizations!
More To Come
Next up, I take you farther into the Perses project with more workshop materials to share. Stay tuned for more insights into a real practical experience as my cloud-native o11y journey continues.
Recommend
About Joyk
Aggregate valuable and interesting links.
Joyk means Joy of geeK