
7

thanos和prometheus实现k8s跨云多集群监控
source link: https://www.bboy.app/2022/12/16/thanos%E5%92%8Cprometheus%E5%AE%9E%E7%8E%B0k8s%E8%B7%A8%E4%BA%91%E5%A4%9A%E9%9B%86%E7%BE%A4%E7%9B%91%E6%8E%A7/
Go to the source link to view the article. You can view the picture content, updated content and better typesetting reading experience. If the link is broken, please click the button below to view the snapshot at that time.


说明下场景,有4个k8s集群,当然可能有更多的集群需要得到监控,然后设计一个监控方案,希望数据可以统一存储,统一展示,关键是要优雅
这个图我没有压缩过,大家可以放大查看,或者直接使用drawio打开
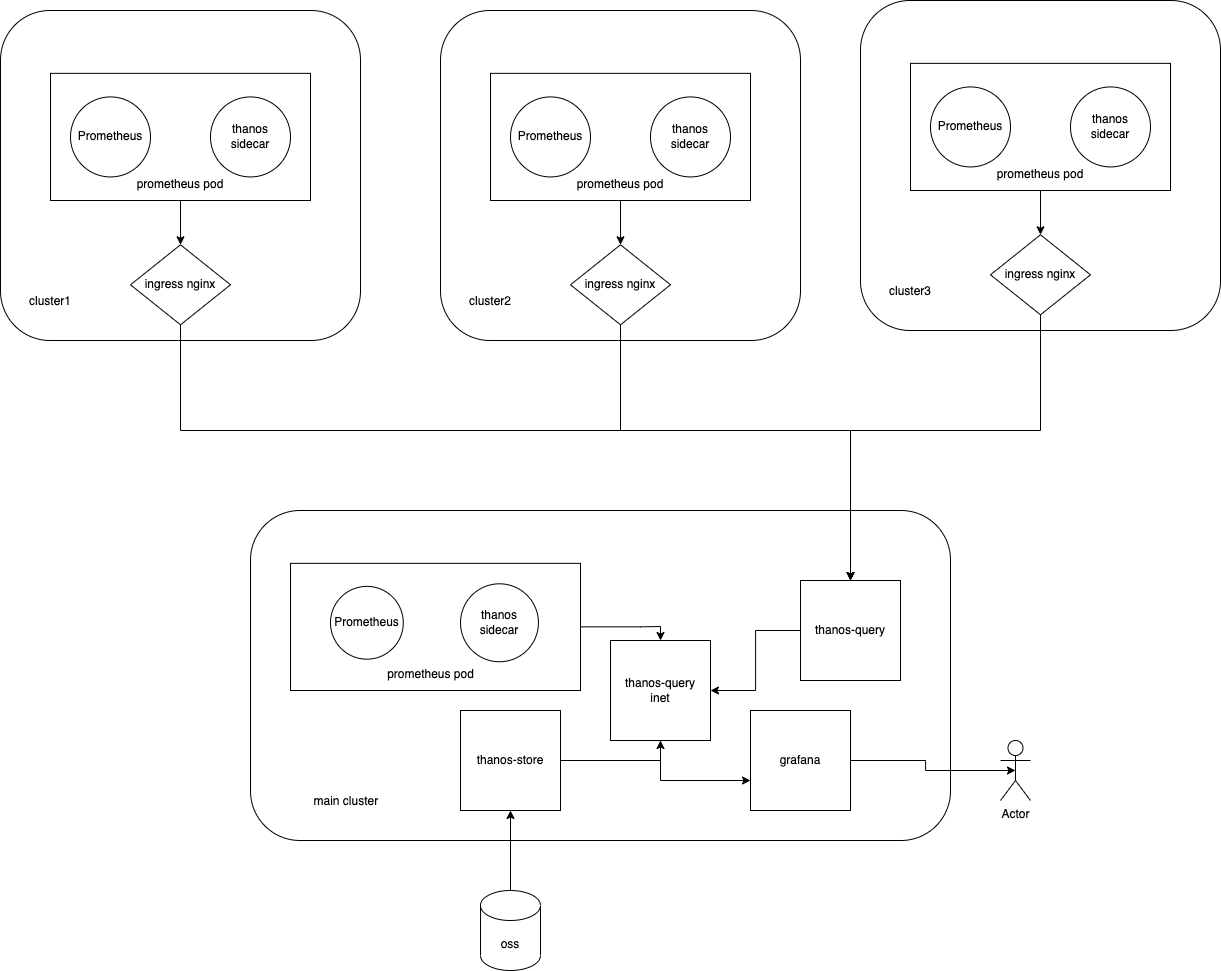
4个集群里面有一个集群为主集群,需要安装thanos的以下组件
- thanos store 用来从对象存储提取数据
- thanos query 用来从其他各个集群sidecar中拿数据
- thanos query inet 也就是另外一个thanos query 用来从thanos query和thanos store还有本机thanos sidecar拿取所有的数据来给grafana展示
- thanos Compactor 这个可以随便在哪里装一个用来压缩thanos在对象存储里面的数据,当然不装也可以,不过推荐装
4个集群中每个集群都是需要装prometheus相关的组件和thanos sidecar
安装prometheus配置sidecar的ingress
这里我直接推荐使用kube-prometheus安装就好了,怎么安装kube-prometheus可以参考
推荐使用kustomize去区分每个环境不同的配置,然后下面是重点
prometheus中externalLabels需要自己自定义一下
  externalLabels:
    cluster: 'cluster-1'
    datacenter: 'us'
这样子上传到对象存储中的数据不会重复
对于grpc的代理,ingress的相关配置可以参考下面
apiVersion: networking.k8s.io/v1
kind: Ingress
metadata:
  annotations:
    nginx.ingress.kubernetes.io/ssl-redirect: "true"
    nginx.ingress.kubernetes.io/backend-protocol: "GRPC"
  name: thanos-grpc
  namespace: monitoring
spec:
  ingressClassName: nginx
  rules:
  - host: thanosgrpc-master.xxx.com
    http:
      paths:
      - path: /
        pathType: Prefix
        backend:
          service:
            name: prometheus-operated
            port:
              number: 10901
  tls:
  - secretName: ssl
    hosts:
      - thanosgrpc-master.xxx.com
配置thanos query
这里我推荐直接使用kube-thanos的配置
thanos query中client-tls要配置为true
加下面两个配置
          - --grpc-client-tls-secure
          - --grpc-client-tls-skip-verify
对于query的label也要打一下
- --query.replica-label=replica
之后就是配置所有集群的sidecar grpc的地址
          - --endpoint=thanosgrpc-master.xxx.com:443
          - --endpoint=thanosgrpc-dev.xxx.com:443
配置thanos query inet
- 本集群的sidecar grpc地址
- 本集群store grpc 地址
- 本集群query grpc 地址
          - --query.replica-label=replica-inet
          - --endpoint=prometheus-operated:10901
          - --endpoint=thanos-store:10901
          - --endpoint=thanos-query:10901
配置grafana
grafana 中直接配置thanos query inet的service地址就可以了
为什么存在两个query
query1 是连接带ssl的sidecar的grpc地址的
query2 是连接不带ssl的grpc地址的
就这么简单
告警的话我不推荐使用thanos rule去告警,因为可能会有延时,为了保证告警的及时性和架构尽可能简单,所以我就没有用rule了
欢迎关注我的博客 www.bboy.app
Have Fun
Recommend
About Joyk
Aggregate valuable and interesting links.
Joyk means Joy of geeK