

An Introduction to Monitoring Microservices with Prometheus and Grafana
source link: https://navendu.me/posts/introduction-to-monitoring-microservices/
Go to the source link to view the article. You can view the picture content, updated content and better typesetting reading experience. If the link is broken, please click the button below to view the snapshot at that time.

An Introduction to Monitoring Microservices with Prometheus and Grafana

Photo by Bobby Stevenson on Unsplash
Continuous monitoring is critical in making microservice systems robust. Without proper monitoring, microservices can quickly become overwhelmed, leading to errors and loss in performance.
Through continuous monitoring, developers can detect issues with their services as soon as they arise and take measures to prevent significant damage. It also provides insights into how your services are performing, allowing you to make informed decisions.
This article will introduce how you can set up monitoring on your microservice application using two of the popular tools in this space, Prometheus , and Grafana .
The source code and Docker Compose file for this tutorial are available in monitoring-101 .
Prometheus Basics#
Prometheus is an open source, monitoring and alerting tool. It “pulls” metrics (measurements) from microservices by sending HTTP requests and stores the results in a time-series database.
You can instrument your services by using client libraries provided by Prometheus. This will enable you to create and collect custom metrics from your services.
Prometheus also has exporters that let you pull metrics that are not in Prometheus format. An exporter acts as a middleman and transforms exported data into Prometheus readable format.
database
or Exporter
manager
Prometheus provides a powerful query language, PromQL , to work with this collected data. You can use PromQL to create complex queries to filter, aggregate, and transform the data to the desired format.
In addition to pulling metrics, Prometheus can also trigger alerts when set thresholds are breached. The alerting mechanism is highly configurable and can send notifications to places like Slack or email.
Prometheus has a GUI that lets you visualize the collected metrics easily. It also integrates with other advanced visualization tools like Grafana.

Prometheus Dashboard
Shows the memory stats of a Go-based service
Metric Types#
Prometheus offers four core metric types:
- Counter: represents a single monotonically increasing counter. Its value can increase or reset to zero on restart. You can use it to represent metrics like the number of requests served.
- Gauge: represents a numerical value that can go up or down. You can use it to represent values like memory usage or the number of requests per second.
- Histogram: samples data into configurable buckets. Use it to represent values like request durations or response sizes.
- Summary: similar to histogram, it also calculates configurable values over a sliding time window.
You can learn more about these metric types and how to use them from the official documentation .
Sample Application#
Our sample application will consist of an API gateway, a Go app, and a Python app.
APISIX
service
service
The application will return, “Hello <name>!” in the language you choose with the <name> you provide. Apache APISIX will be the API gateway that directs traffic to your services.
The diagram below shows how the system works.
- The user sends a GET request to APISIX, the entry point for the application.
- APISIX forwards the request to the Go service.
- The Go service sends a GET request to the Python service to obtain “Hello” in the specified language.
- The Python service responds with the required translation of “Hello.”
- The Go service creates the required response by using the name provided in the query and sends it to APISIX.
- APISIX forwards the response back to the user.
Configuring Prometheus to Collect Metrics#
We will instrument and export metrics from all the services in our application and collect them in Prometheus. We will start with our API gateway, Apache APISIX .
Exporting Metrics from APISIX#
Apache APISIX is an open source, cloud native API gateway.
You don’t need to know about APISIX to follow along, and you can use the Docker Compose file provided to set everything up. To learn more about APISIX, visit apisix.apache.org .
APISIX offers a prometheus Plugin that easily exports metrics in the Prometheus format. You can configure the Plugin in your APISIX configuration file:
config.ymlapisix:
enable_admin: false # run APISIX in standalone mode
config_center: yaml # use a YAML file for configuration instead of storing it in etcd
plugin_attr:
prometheus:
export_uri: /prometheus/metrics # enable the prometheus Plugin and export the metrics to this URI
enable_export_server: false # export the metrics in the default data-plane port
We can now enable the Plugin on every Route by making it a Global rule :
apisix.ymlroutes:
# route requests to /hello/* to the go-app
- uri: /hello/*
upstream:
type: roundrobin
nodes:
"go-app:8080": 1
plugins:
# remove the prefix "/hello" before forwarding the request to the go-app
proxy-rewrite:
regex_uri:
- "/hello/(.*)"
- "/$1"
# export Prometheus metrics to the specified URI
- uri: /prometheus/metrics
plugins:
public-api:
# enable the Prometheus Plugin globally on all Routes
global_rules:
- id: 1
plugins:
prometheus:
prefer_name: true
#END
This will export the metrics to the /prometheus/metrics endpoint in Apache APISIX.
You can learn more about the available metrics from the documentation .
Instrumenting and Exporting Metrics from the Go Service#
Prometheus has an official Go client library for instrumenting Go applications.
By default, Prometheus will expose the default Go metrics. You can also create your own application-specific metrics.
In our service, we will expose the default metrics and create our own counter metric to track the number of requests:
main.gopackage main
import (
"encoding/json"
"fmt"
"io/ioutil"
"log"
"net/http"
"os"
// Prometheus packages
"github.com/prometheus/client_golang/prometheus"
"github.com/prometheus/client_golang/prometheus/promauto"
"github.com/prometheus/client_golang/prometheus/promhttp"
)
// Response stores the Message obtained from the python-app
type Response struct {
Message string `json:"message"`
}
// default language and name
var (
lang = "en"
name = "John"
)
// create a new custom Prometheus counter metric
var pingCounter = promauto.NewCounter(
prometheus.CounterOpts{
Name: "go_app_request_count",
Help: "No of requests handled by the go-app",
},
)
// HelloHandler handles requests to the go-app
func HelloHandler(w http.ResponseWriter, r *http.Request) {
lang = r.URL.String()
name = r.URL.Query()["name"][0]
fmt.Println("Request for", lang, "with name", name)
pingCounter.Inc()
pUrl := os.Getenv("PYTHON_APP_URL")
if len(pUrl) == 0 {
pUrl = "localhost"
}
// call the python-app to obtain the translation
resp, err := http.Get("http://" + pUrl + ":8000" + lang)
if err != nil {
log.Fatalln(err)
}
body, err := ioutil.ReadAll(resp.Body)
if err != nil {
log.Fatalln(err)
}
resp.Body.Close()
var m Response
json.Unmarshal(body, &m)
// send back response with "Hello name!" in the specified language
fmt.Fprintf(w, "%s %s!", m.Message, name)
}
func main() {
// expose Prometheus metrics
http.Handle("/metrics", promhttp.Handler())
http.HandleFunc("/", HelloHandler)
http.ListenAndServe(":8080", nil)
}
This will expose the metrics to the endpoint /metrics. You can learn more about the Go client library from its GitHub repo
.
Instrumenting and Exporting Metrics from the Python Service#
Prometheus also has an official Python client library . There are also third-party libraries that are tailored to fit specific use cases.
Our service uses FastAPI , and we will use the prometheus_fastapi_instrumentator library to instrument it:
main.pyfrom fastapi import FastAPI
from fastapi.middleware.cors import CORSMiddleware
from prometheus_fastapi_instrumentator import Instrumentator
app = FastAPI()
hello = {"en": "Hello", "fr": "Bonjour", "es": "Hola", "ml": "ഹലോ"}
# expose the default Python metrics to the /metrics endpoint
Instrumentator().instrument(app).expose(app)
@app.get("/{lang}")
async def get_hello(lang):
return {"message": hello[lang]}
You can learn more about creating custom metrics from the documentation .
Configuring Prometheus#
We can now scrape and collect these metrics in Prometheus.
You can configure Prometheus to collect metrics from each of the services. By default, Prometheus checks for metrics in the /metrics path:
prometheus.ymlglobal:
scrape_interval: 15s
evaluation_interval: 15s
scrape_configs:
- job_name: "prometheus"
static_configs:
- targets: ["localhost:9090"]
- job_name: "go-app"
static_configs:
- targets: ["go-app:8080"]
- job_name: "python-app"
static_configs:
- targets: ["python-app:8000"]
- job_name: "apisix"
static_configs:
- targets: ["apisix:9080"]
metrics_path: "/prometheus/metrics"
That’s it! Now, if you open up the Prometheus dashboard (default on port 9090) and click on “Status” from the navbar and “Targets,” you will be able to see the status of metrics being scraped from your services.

Prometheus targets
Metrics are successfully being scraped from all sources
Querying and Visualizing Metrics in Prometheus#
Now, you can use the Prometheus dashboard to run queries and complex expressions.

Querying Prometheus
You can get a lot more complex with your queries than this
You can learn more about querying Prometheus in the official documentation .
Using Grafana to Query Prometheus#
Grafana is an open source data visualization platform that works with Prometheus to provide a comprehensive tool for collecting, querying, and visualizing metrics.
Prometheus is good at collecting metrics and querying but lacks in providing tooling for creating meaningful visualizations. Grafana overcomes this limitation by transforming the collected metrics into visualizations.
Grafana is also compatible with many other data sources than Prometheus.
Once you have deployed Grafana, you can open the web UI (default on port 3000).
First, you have to add Prometheus as a data source. To do this, go to `/datasources or “Configuration” and “Data sources.” Click on “Add data source” and select Prometheus. Specify where Prometheus is deployed, save and test the connection.
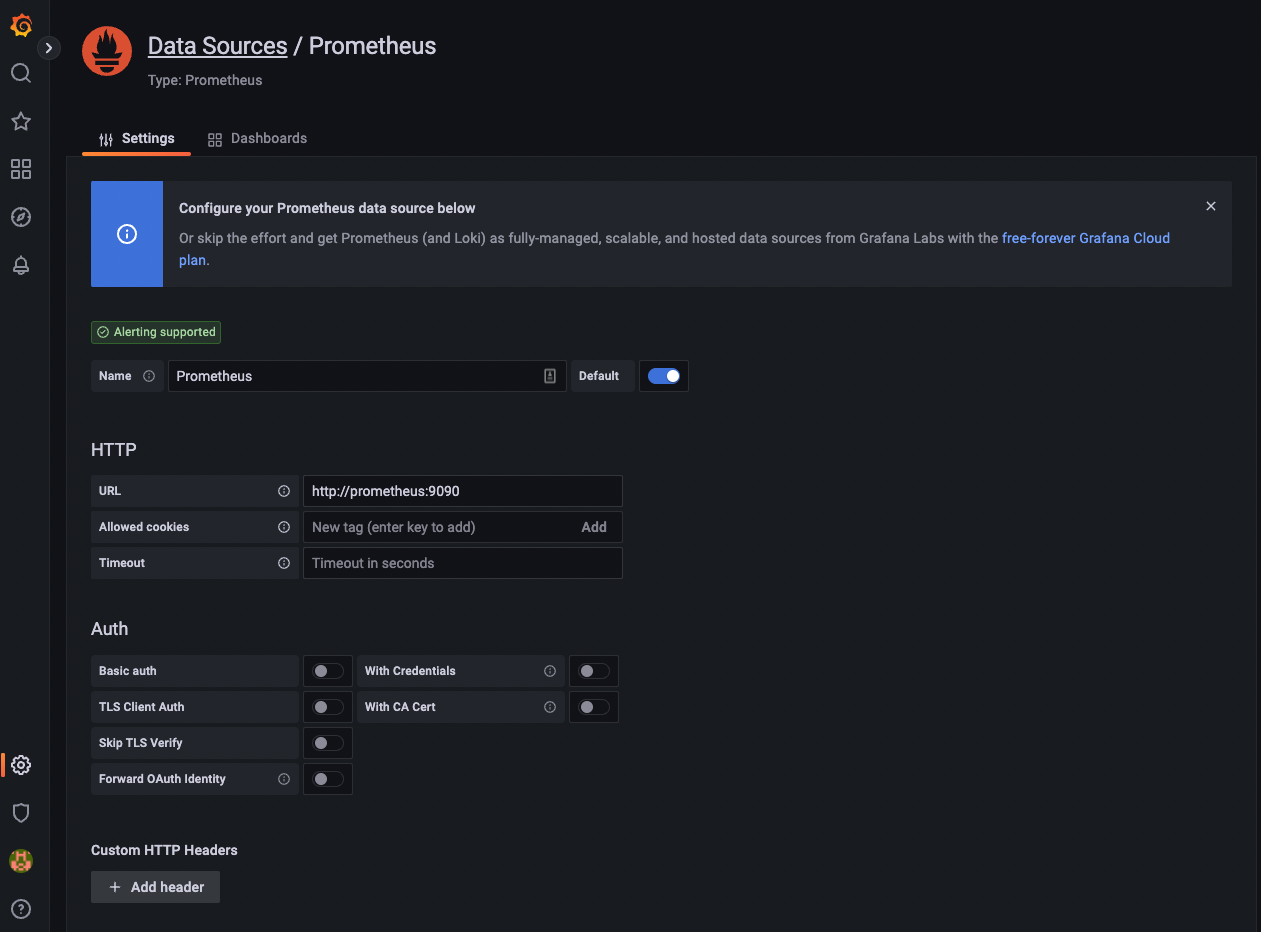
Add Prometheus as a data source
Add the details of your Prometheus service, save, and test it
Using Pre-built Grafana Dashboards#
Grafana hosts a public dashboard repository that contains pre-built Grafana dashboards. You can use them in your Grafana instance to quickly visualize relevant metrics.
We will use the Go Processes dashboard which will process and visualize the process status published by the Prometheus Go client library.
To import this template, first, copy its ID (6671) from the dashboard repository. In your Grafana UI, go to “Dashboards” and select “Import.” Paste the ID you copied and click “Load.”

Grafana dashboard
Visualizes the process status of the Go service
You can also explore other pre-built dashboards or create your own. Refer to the documentation to learn more about this.
What’s Next?#
That’s it for this tutorial!
This article was only an introduction to how you can set up monitoring on your services, and I encourage you to learn more about Prometheus and Grafana from the resources mentioned below:
The complete code and the Docker Compose file for this tutorial are available in monitoring-101 .
Thank you for reading "An Introduction to Monitoring Microservices with Prometheus and Grafana".
Subscribe via email or RSS feed to be the first to receive my content.
If you liked this post, check out my Featured Posts or learn more About Me.
Recommend
About Joyk
Aggregate valuable and interesting links.
Joyk means Joy of geeK