

Observability with Spring Boot 3
source link: https://spring.io/blog/2022/10/12/observability-with-spring-boot-3
Go to the source link to view the article. You can view the picture content, updated content and better typesetting reading experience. If the link is broken, please click the button below to view the snapshot at that time.

Observability with Spring Boot 3
close
Observability with Spring Boot 3

October 12, 2022
The Spring Observability Team has been working on adding observability support for Spring Applications for quite some time, and we are pleased to inform you that this feature will be generally available with Spring Framework 6 and Spring Boot 3!
What is observability? In our understanding, it is "how well you can understand the internals of your system by examining its outputs". We believe that the interconnection between metrics, logging, and distributed tracing gives you the ability to reason about the state of your system in order to debug exceptions and latency in your applications. You can watch more about what we think observability is in this episode of Enlightning with Jonatan Ivanov.
The upcoming Spring Boot 3.0.0-RC1 release will contain numerous autoconfigurations for improved metrics with Micrometer and new distributed tracing support with Micrometer Tracing (formerly Spring Cloud Sleuth). The most notable changes are that it will contain built-in support for log correlation, W3C context propagation will be the default propagation type, and we will support automatic propagation of metadata to be used by the tracing infrastructure (called "remote baggage") that helps to label the observations.
We have been changing the Micrometer API a lot over the course of this year. The most important change is that we have introduced a new API: the Observation API.
The idea of its founding was that we want the users to instrument their code once using a single API and have multiple benefits out of it (e.g. metrics, tracing, logging).
This blog post details what you need to know to about that API and how you can use it to provide more insights into your application.
How Does Micrometer Observation Work?
For any observation to happen, you need to register ObservationHandler objects through an ObservationRegistry. An ObservationHandler reacts only to supported implementations of an Observation.Context and can create, for example, timers, spans, and logs by reacting to the lifecycle events of an observation, such as:
-
start- Observation has been started. Happens when theObservation#start()method gets called. -
stop- Observation has been stopped. Happens when theObservation#stop()method gets called. -
error- An error occurred while observing. Happens when theObservation#error(exception)method gets called. -
event- An event happened when observing. Happens when theObservation#event(event)method gets called. -
scope started- Observation opens a scope. The scope must be closed when no longer used. Handlers can create thread local variables on start that are cleared upon closing of the scope. Happens when theObservation#openScope()method gets called. -
scope stopped- Observation stops a scope. Happens when theObservation.Scope#close()method gets called.
Whenever any of these methods is called, an ObservationHandler method (such as onStart(T extends Observation.Context ctx), onStop(T extends Observation.Context ctx), and so on) are called. To pass state between the handler methods, you can use the Observation.Context.
The observation state diagram looks like this:
The observation Scope state diagram looks like this:
To make it possible to debug production problems, an observation needs additional metadata, such as key-value pairs (also known as tags). You can then query your metrics or distributed tracing backend by using those tags to find the required data. Tags can be of either high or low cardinality.
This is an example of the Micrometer Observation API.
|
Important
|
High cardinality means that a pair will have an unbounded number of possible values. An HTTP URL is a good
example of such a key value (for example, /user/user1234, /user/user2345, and so on). Low cardinality means that a key value will have a bounded number of possible values. A templated HTTP URL (such as /user/{userId}) is a good example of such a key value.
|
To separate observation lifecycle operations from an observation configuration (such as names and low and high cardinality tags), you can use the ObservationConvention that provides an easy way of overriding the default naming conventions.
Building Your First Observed Application
The easiest way to get started is to create a new project from https://start.spring.io. Make sure to select Spring Boot 3.0.0-SNAPSHOT (you can switch to RC1 once it’s available) and your favorite build tool.
We will build a Spring WebMvc server application and a client to call the server using RestTemplate. We start with the server side.
WebMvc Server Setup
Since we want to start an HTTP server, we have to pick the org.springframework.boot:spring-boot-starter-web dependency.
To create observations by using the @Observed aspect, we need to add the org.springframework.boot:spring-boot-starter-aop dependency.
To add observation features to your application, choose spring-boot-starter-actuator (to add Micrometer to the classpath).
Now it is time to add observability related features!
-
Metrics
-
For Micrometer metrics with Prometheus, we need to add the
io.micrometer:micrometer-registry-prometheusdependency.
-
-
Tracing
-
For Tracing Context Propagation with Micrometer Tracing, we need to pick a tracer bridge (tracer is a library that is used to handle the lifecycle of a span). We pick Zipkin Brave by adding the
io.micrometer:micrometer-tracing-bridge-brave.-
The client application that we will create for this demo will use another tracer library to show an interop between tracers.
-
-
For Latency Visualization, we need to send the finished spans in some format to a server. In our case, we produce an Zipkin-compliant span. To achieve that, we need to add the
io.zipkin.reporter2:zipkin-reporter-bravedependency.
-
-
Logs
-
Since we have Micrometer Tracing on the classpath, the logs are automatically correlated (that is, they contain a unique trace identifier). Now we need to ship the logs. For this demo, we ship them to Grafana Loki. We can achieve that by adding the
com.github.loki4j:loki-logback-appenderdependency (check this link for the latest release version)
-
|
Important
|
If you are new to tracing, we need to quickly define a couple of basic terms. You can wrap any operation in a span. It has a unique span id and contains timing information and some additional metadata (key-value pairs). Because you can produce child spans from spans, the whole tree of spans forms a trace that shares the same trace id (that is, a correlation identifier).
|
Now we need to add some configuration. We set up actuator and metrics to publish percentiles histograms, and we redefine the logging pattern to include the trace and span identifiers. We set the sampling probability to 1.0 to send all traces to latency analysis tool.
Since we are running the Grafana stack with Loki and Tempo locally, we configure the loki-logback-appender to send logs to the local instance of Loki.
WebMvc Server Code
Time to write some server-side code! We want to achieve full observability of our application, including metrics, tracing, and additional logging.
To begin with, we write a controller that logs a message to the console and delegate work to a service.
We want to have some detailed observation of the MyUserService#userName method. Thanks to having added AOP support, we can use the @Observed annotation. To do so, we can register a ObservedAspect bean.
With metrics and tracing on the classpath, having this annotation leads to the creation of a timer, a long task timer, and a span. The timer would be named user.name, the long task timer would be named user.name.active, and the span would be named getting-user-name.
What about logs? We do not want to write the logging statements manually whenever an observation takes place. What we can do is to create a dedicated handler that logs some text for each observation.
That is it! Time for the client side.
RestTemplate Client Application Setup
As before, we add the spring-boot-starter-web and spring-boot-starter-actuator dependencies to have a web server running and Micrometer support added.
Time to add observability related features!
-
Metrics
-
For Micrometer metrics with Prometheus, we need to add the
io.micrometer:micrometer-registry-prometheusdependency.
-
-
Tracing
-
For Tracing Context Propagation with Micrometer Tracing, we need to pick a tracer bridge. We pick OpenTelemetry by adding the
io.micrometer:micrometer-tracing-bridge-otel. -
For Latency Visualization, we need to send the finished spans in some format to a server. In our case, we produce an OpenZipkin compliant span. To achieve that, we need to add the
io.opentelemetry:opentelemetry-exporter-zipkindependency.
-
-
Logs
-
As previously, we add the
com.github.loki4j:loki-logback-appenderdependency (check this link for the latest release version) to ship logs to Loki.
-
Now we need to add some configuration. We add almost identical configuration as we did on the server side.
The Loki Appender configuration looks exactly the same.
RestTemplate Application Client Code
Now it is time to write some client-side code! We send a request with RestTemplate to the server side, and we want to achieve the full observability of our application, including metrics and tracing.
To begin, we need a RestTemplate bean that is automatically instrumented by Spring Boot. Remember to inject the RestTemplateBuilder and to construct a RestTemplate instance from the builder.
Now we can write a CommandLineRunner bean that is wrapped by using the Observation API and that sends a request to the server side. All parts of the API are described in more detail in the following snippet.
Running It All Together
We have prepared a Docker setup of the whole observability infrastructure under this link. Follow these steps to run the infrastructure and both applications.
Running the samples
To run the samples:
-
Start up the observability stack (for demonstration purposes, you can use the provided Grafana, Tempo, and Loki stack) and wait for it to start.
-
Run the server side application (this will block your current terminal window).
-
Run the client side application (this will block your current terminal window)
You should see log statements similar to these:
-
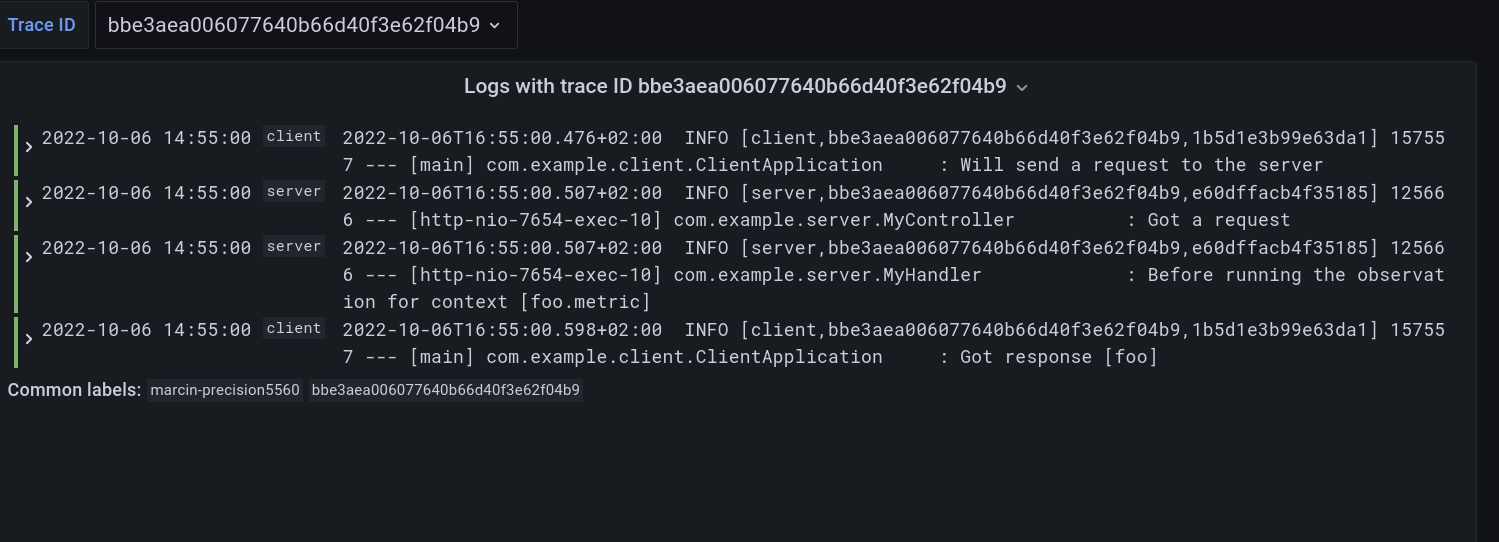
Go to Grafana, go to dashboards, and click on the
Logs, Traces, Metricsdashboard. There you can pick a trace ID value (for example,bbe3aea006077640b66d40f3e62f04b9) to find all logs and traces from both applications that correspond to that trace ID. You should see a following correlated view of logs and traces related to the same trace identifier, and you will see metrics taking place at the same time range. The metrics are related to HTTP request processing latency. These come from the automated Spring Boot WebMvc instrumentation that uses the Micrometer API.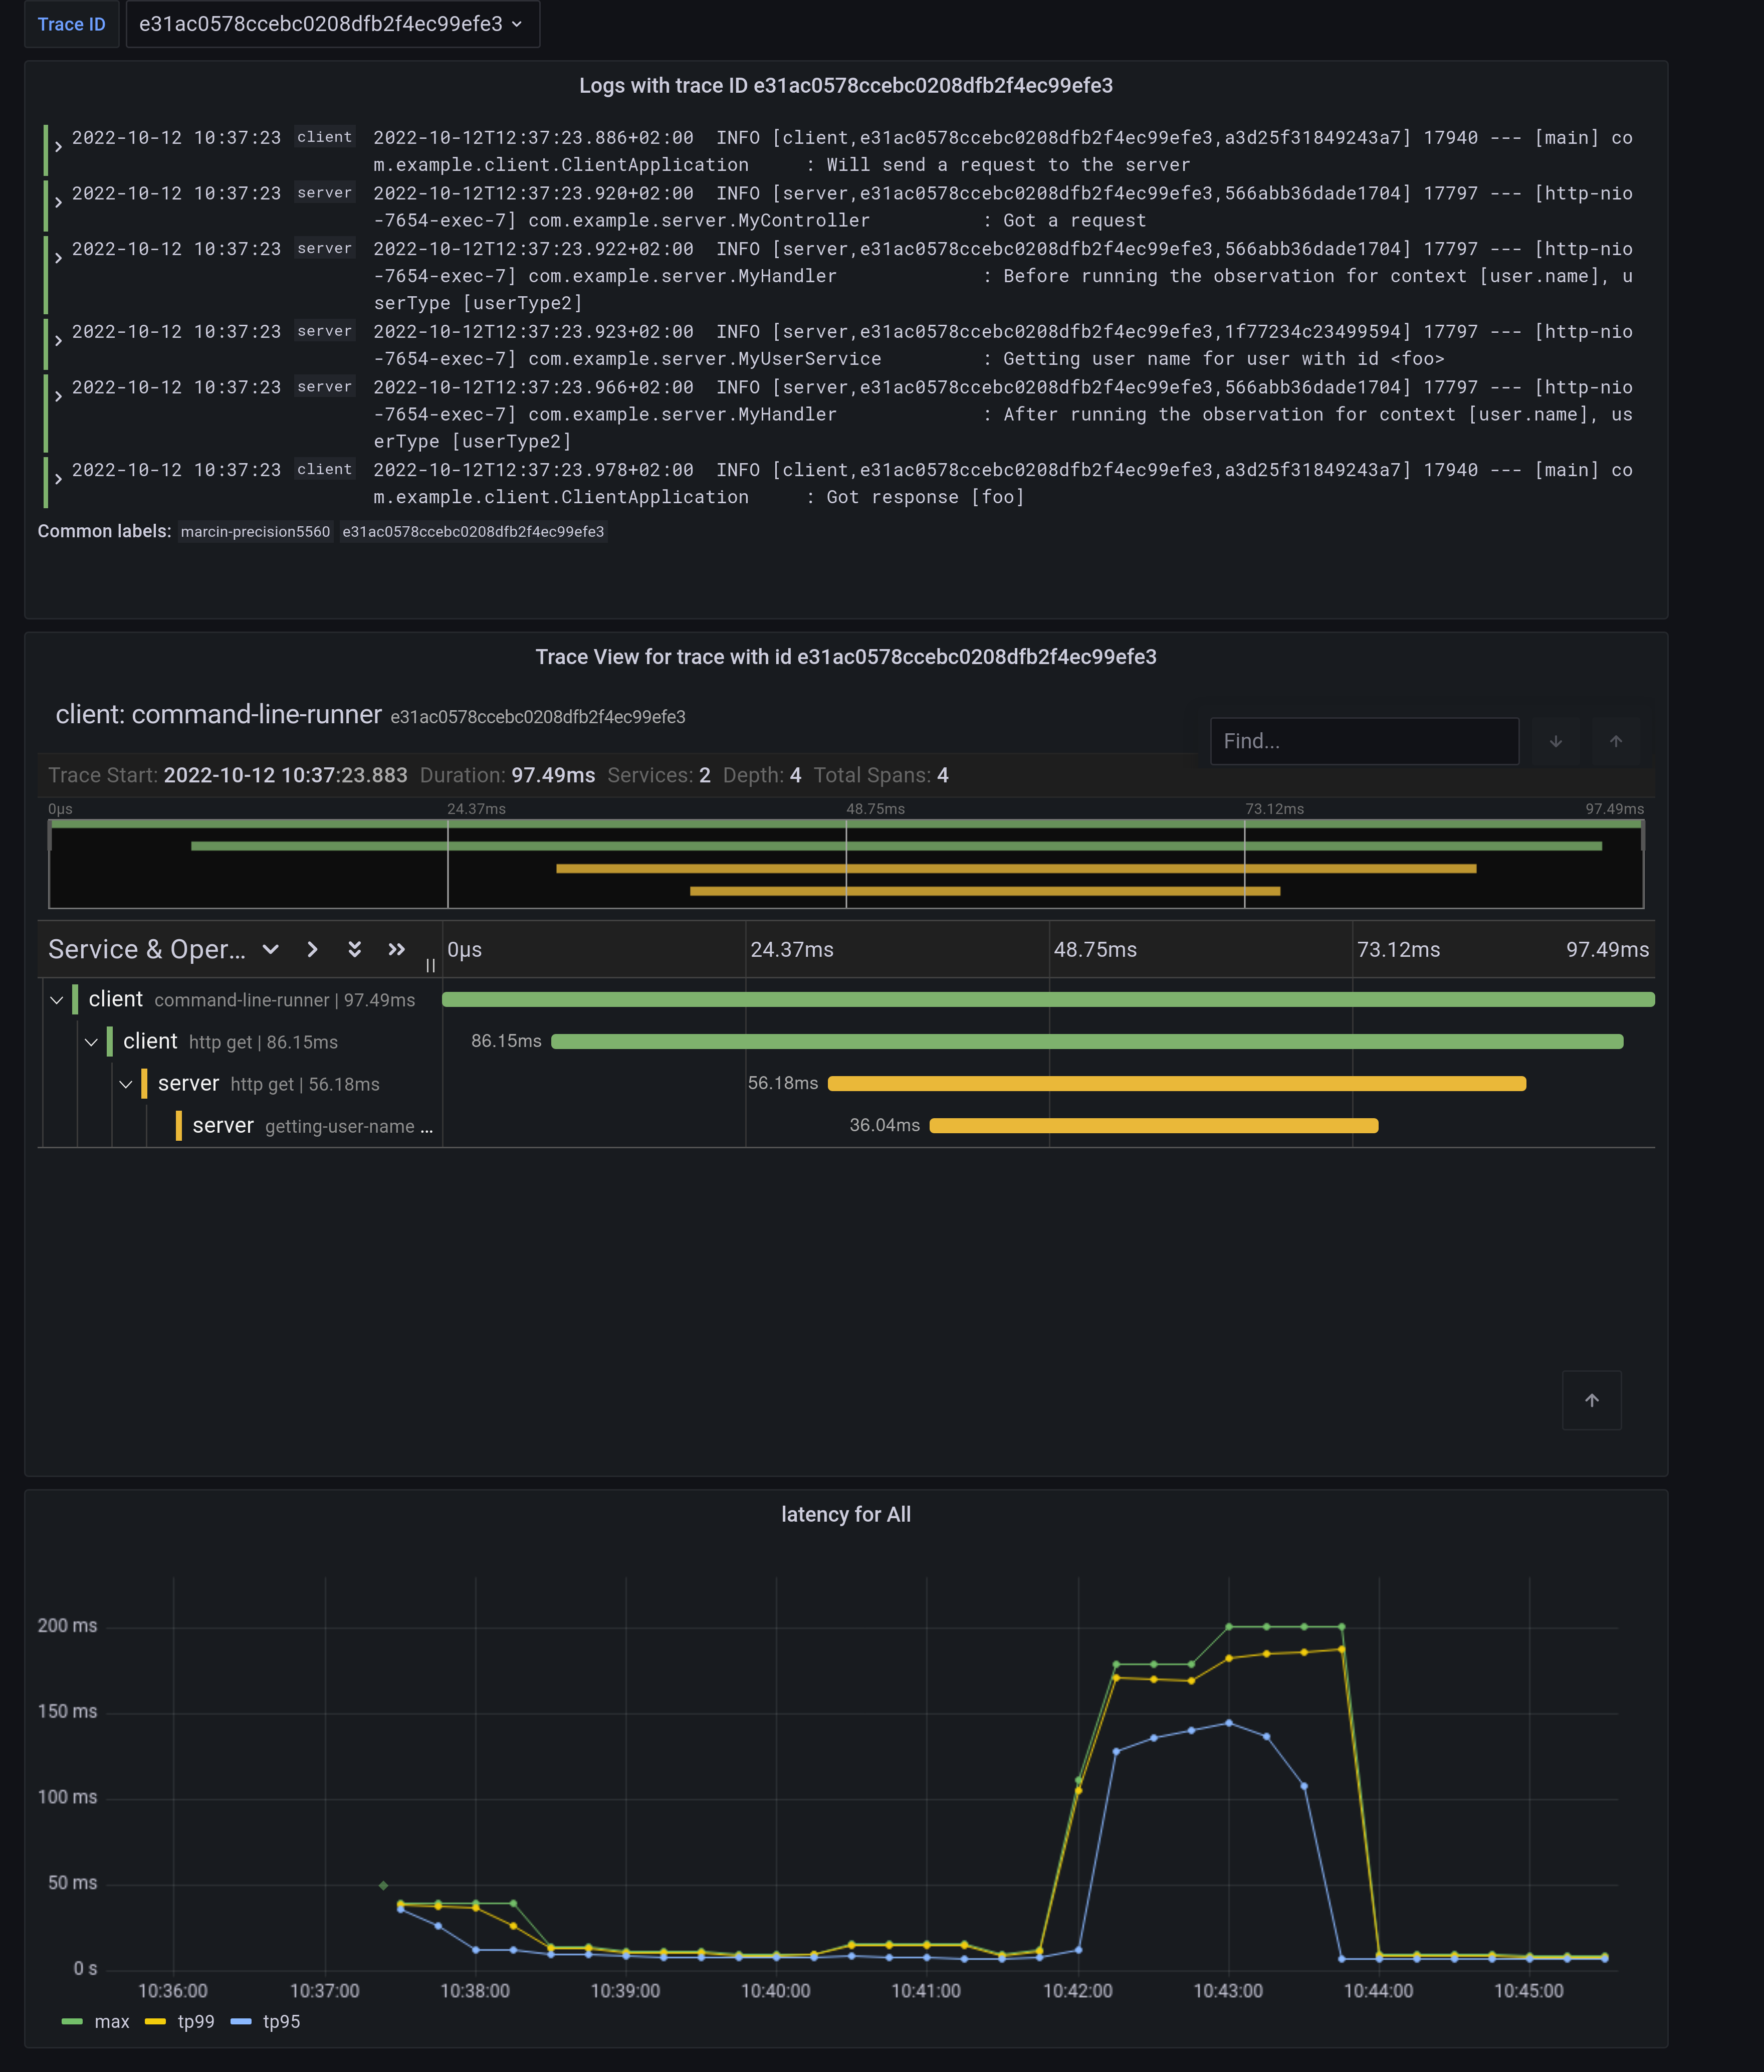
Notice a diamond shape in the metrics. These are
Exemplars. Those are “specific trace representative of measurement taken in a given time interval”. If you click on the shape, you can jump to the trace ID view to see the corresponding trace.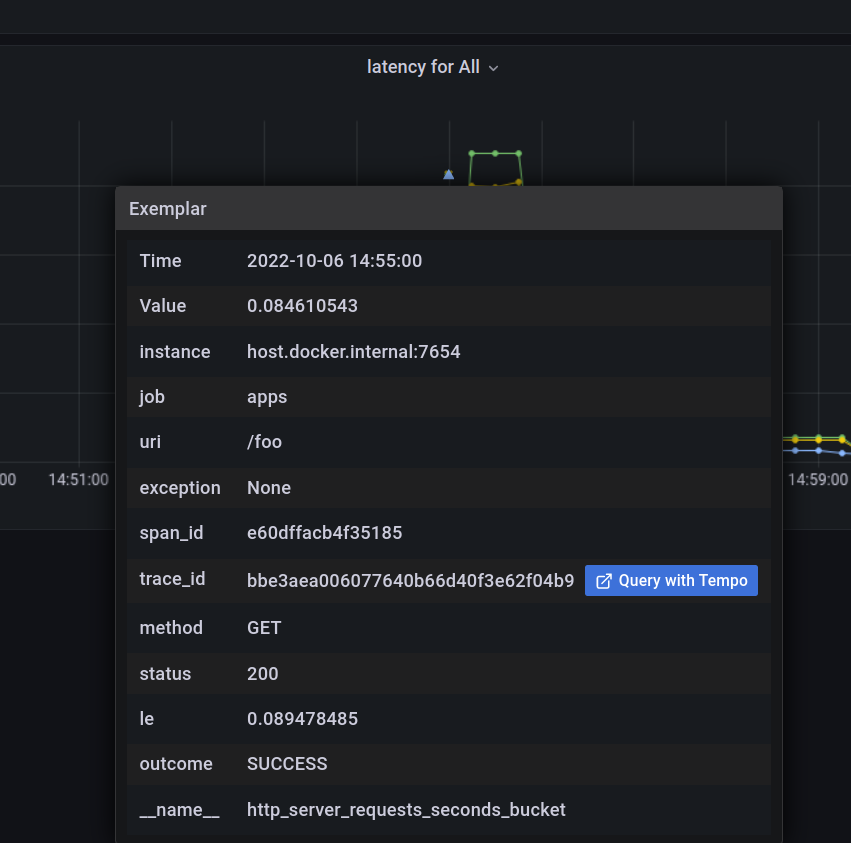
-
Either click on the trace ID to
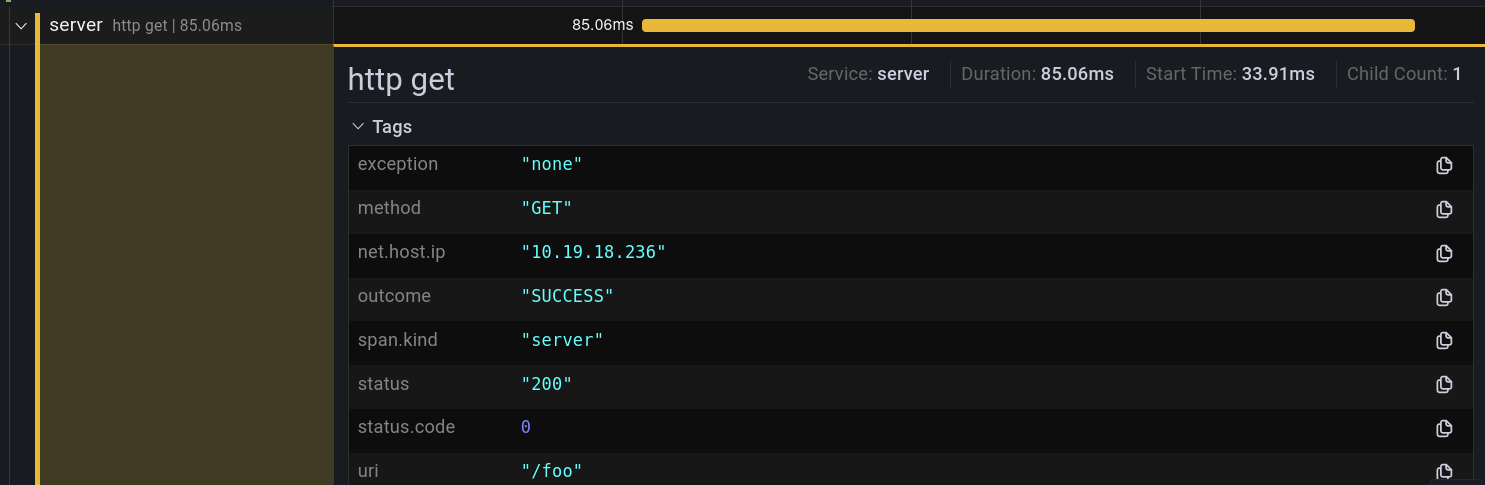
Query it with Tempoor go to Tempo and pick the trace identifier yourself. You will see the following screen.
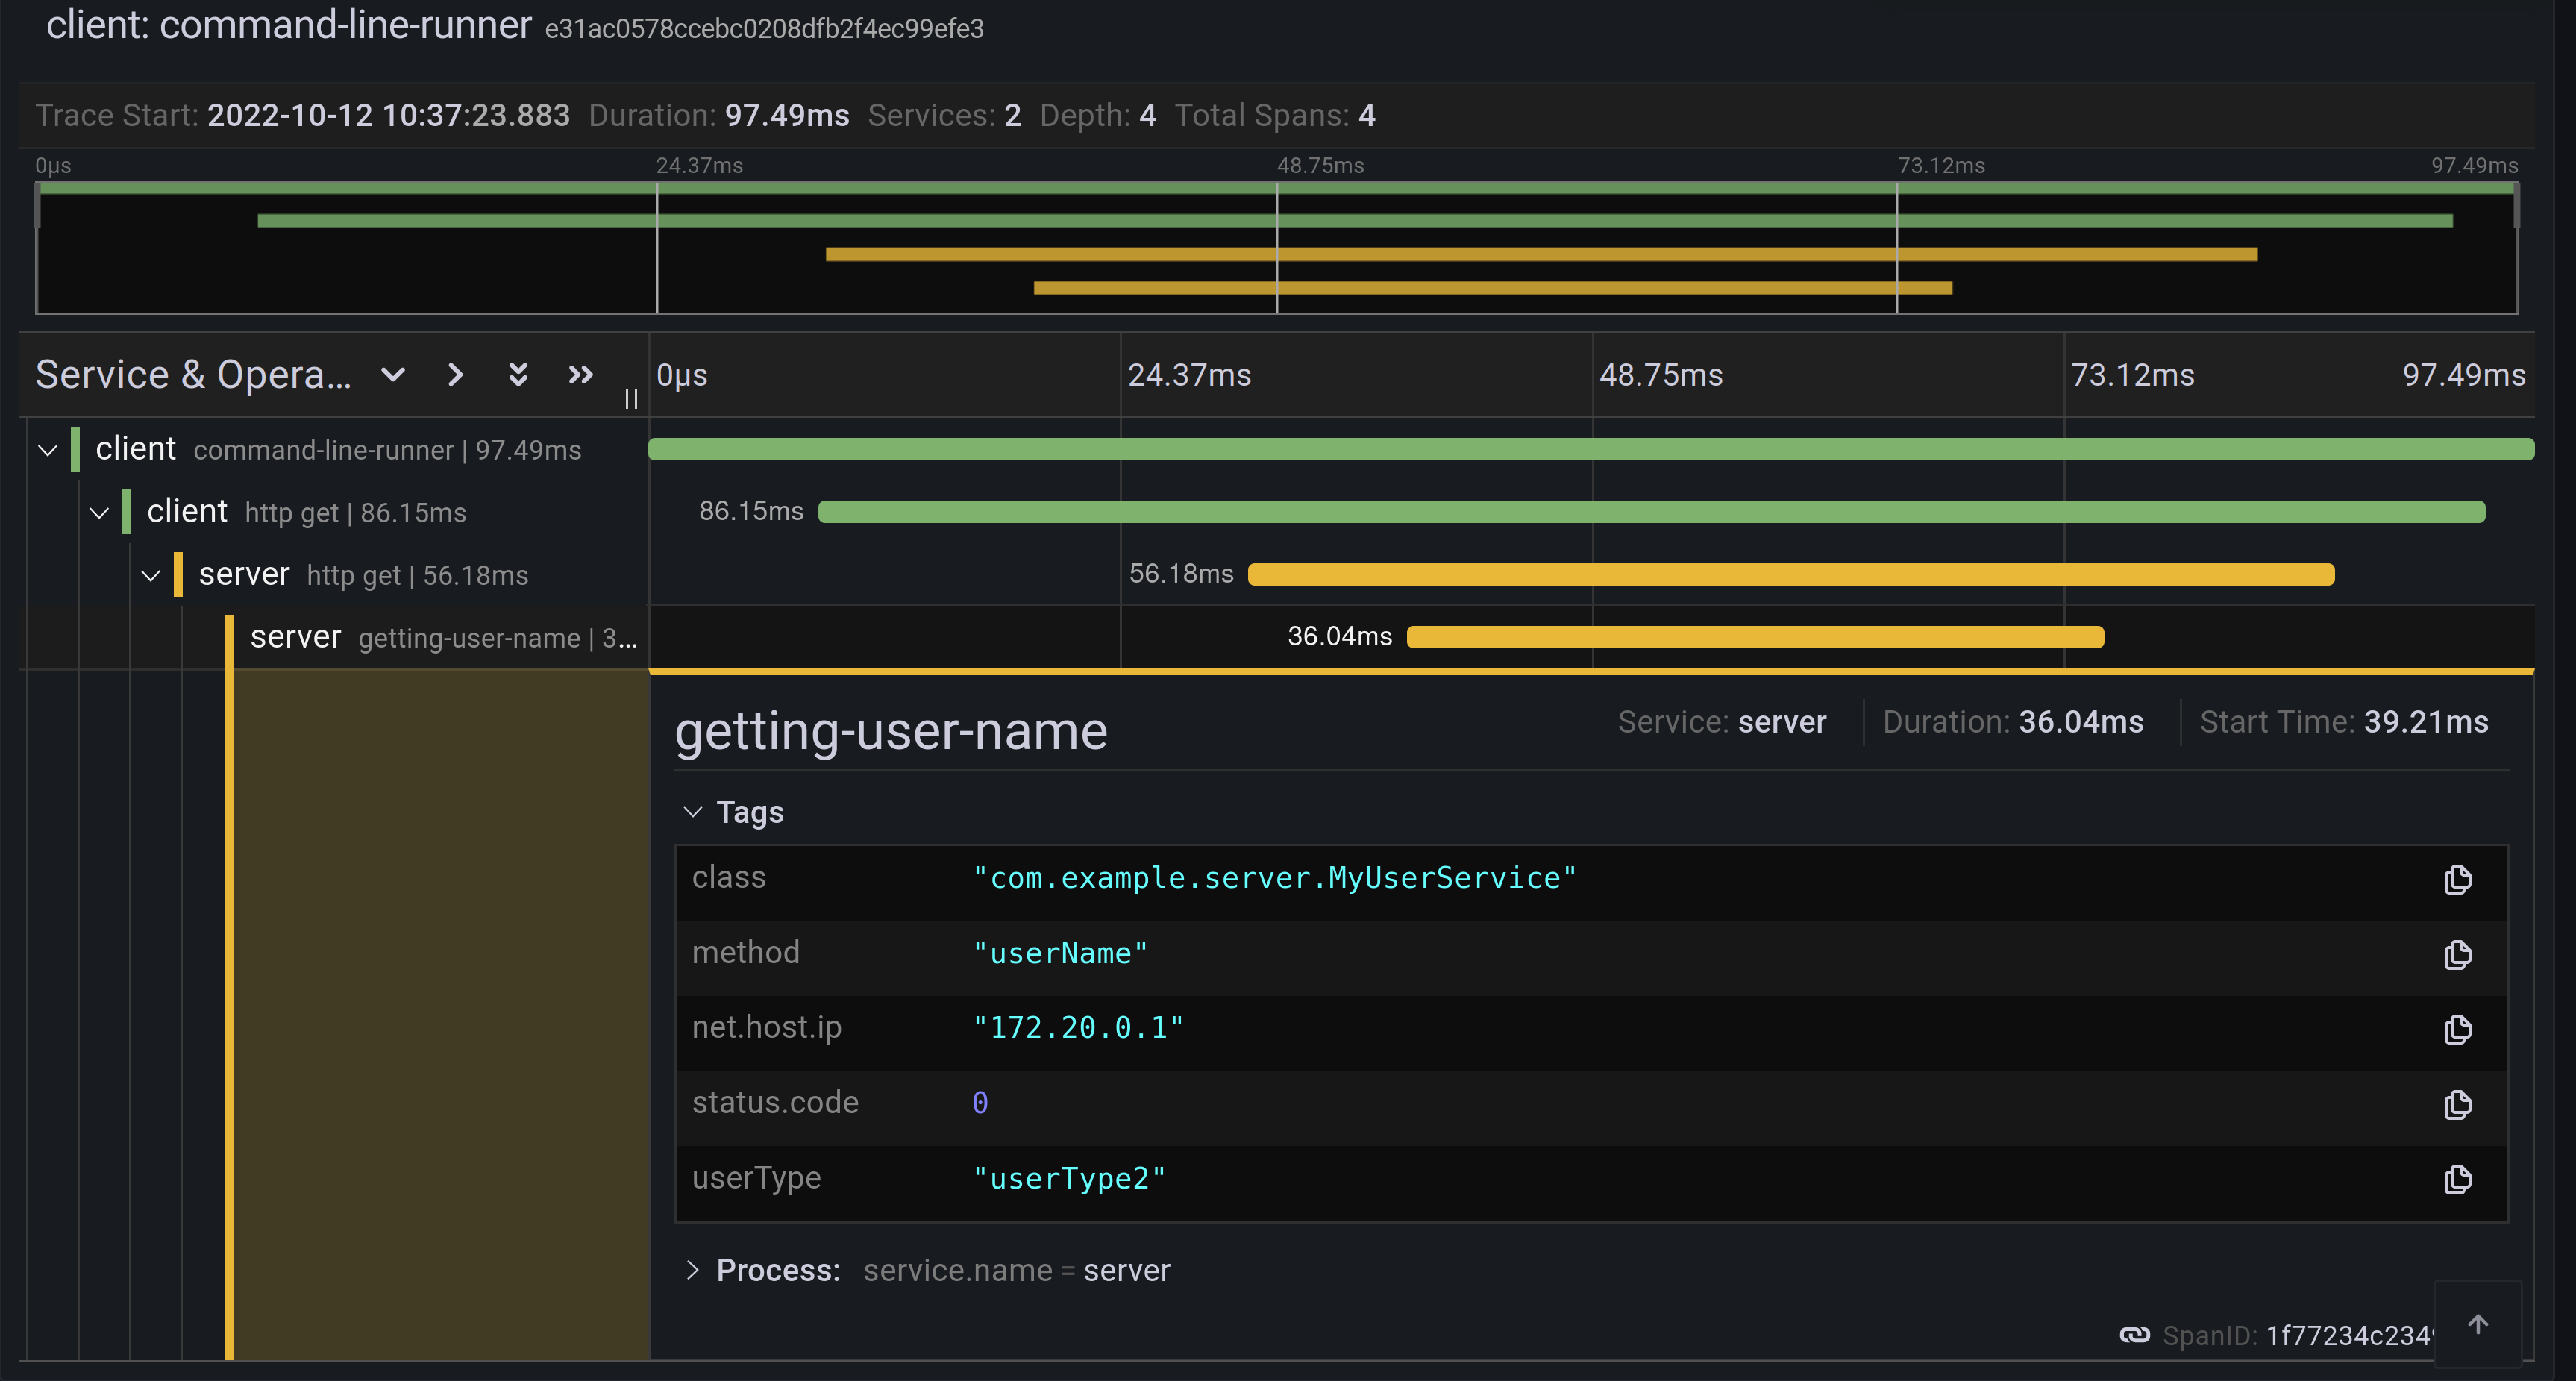
Each bar represents a span. You can see how much time it took for each operation to complete. If you click on a given span, you can see tags (key-value metadata) and timing information related to that particular operation.
This is how the correlated logs view would look in Loki.
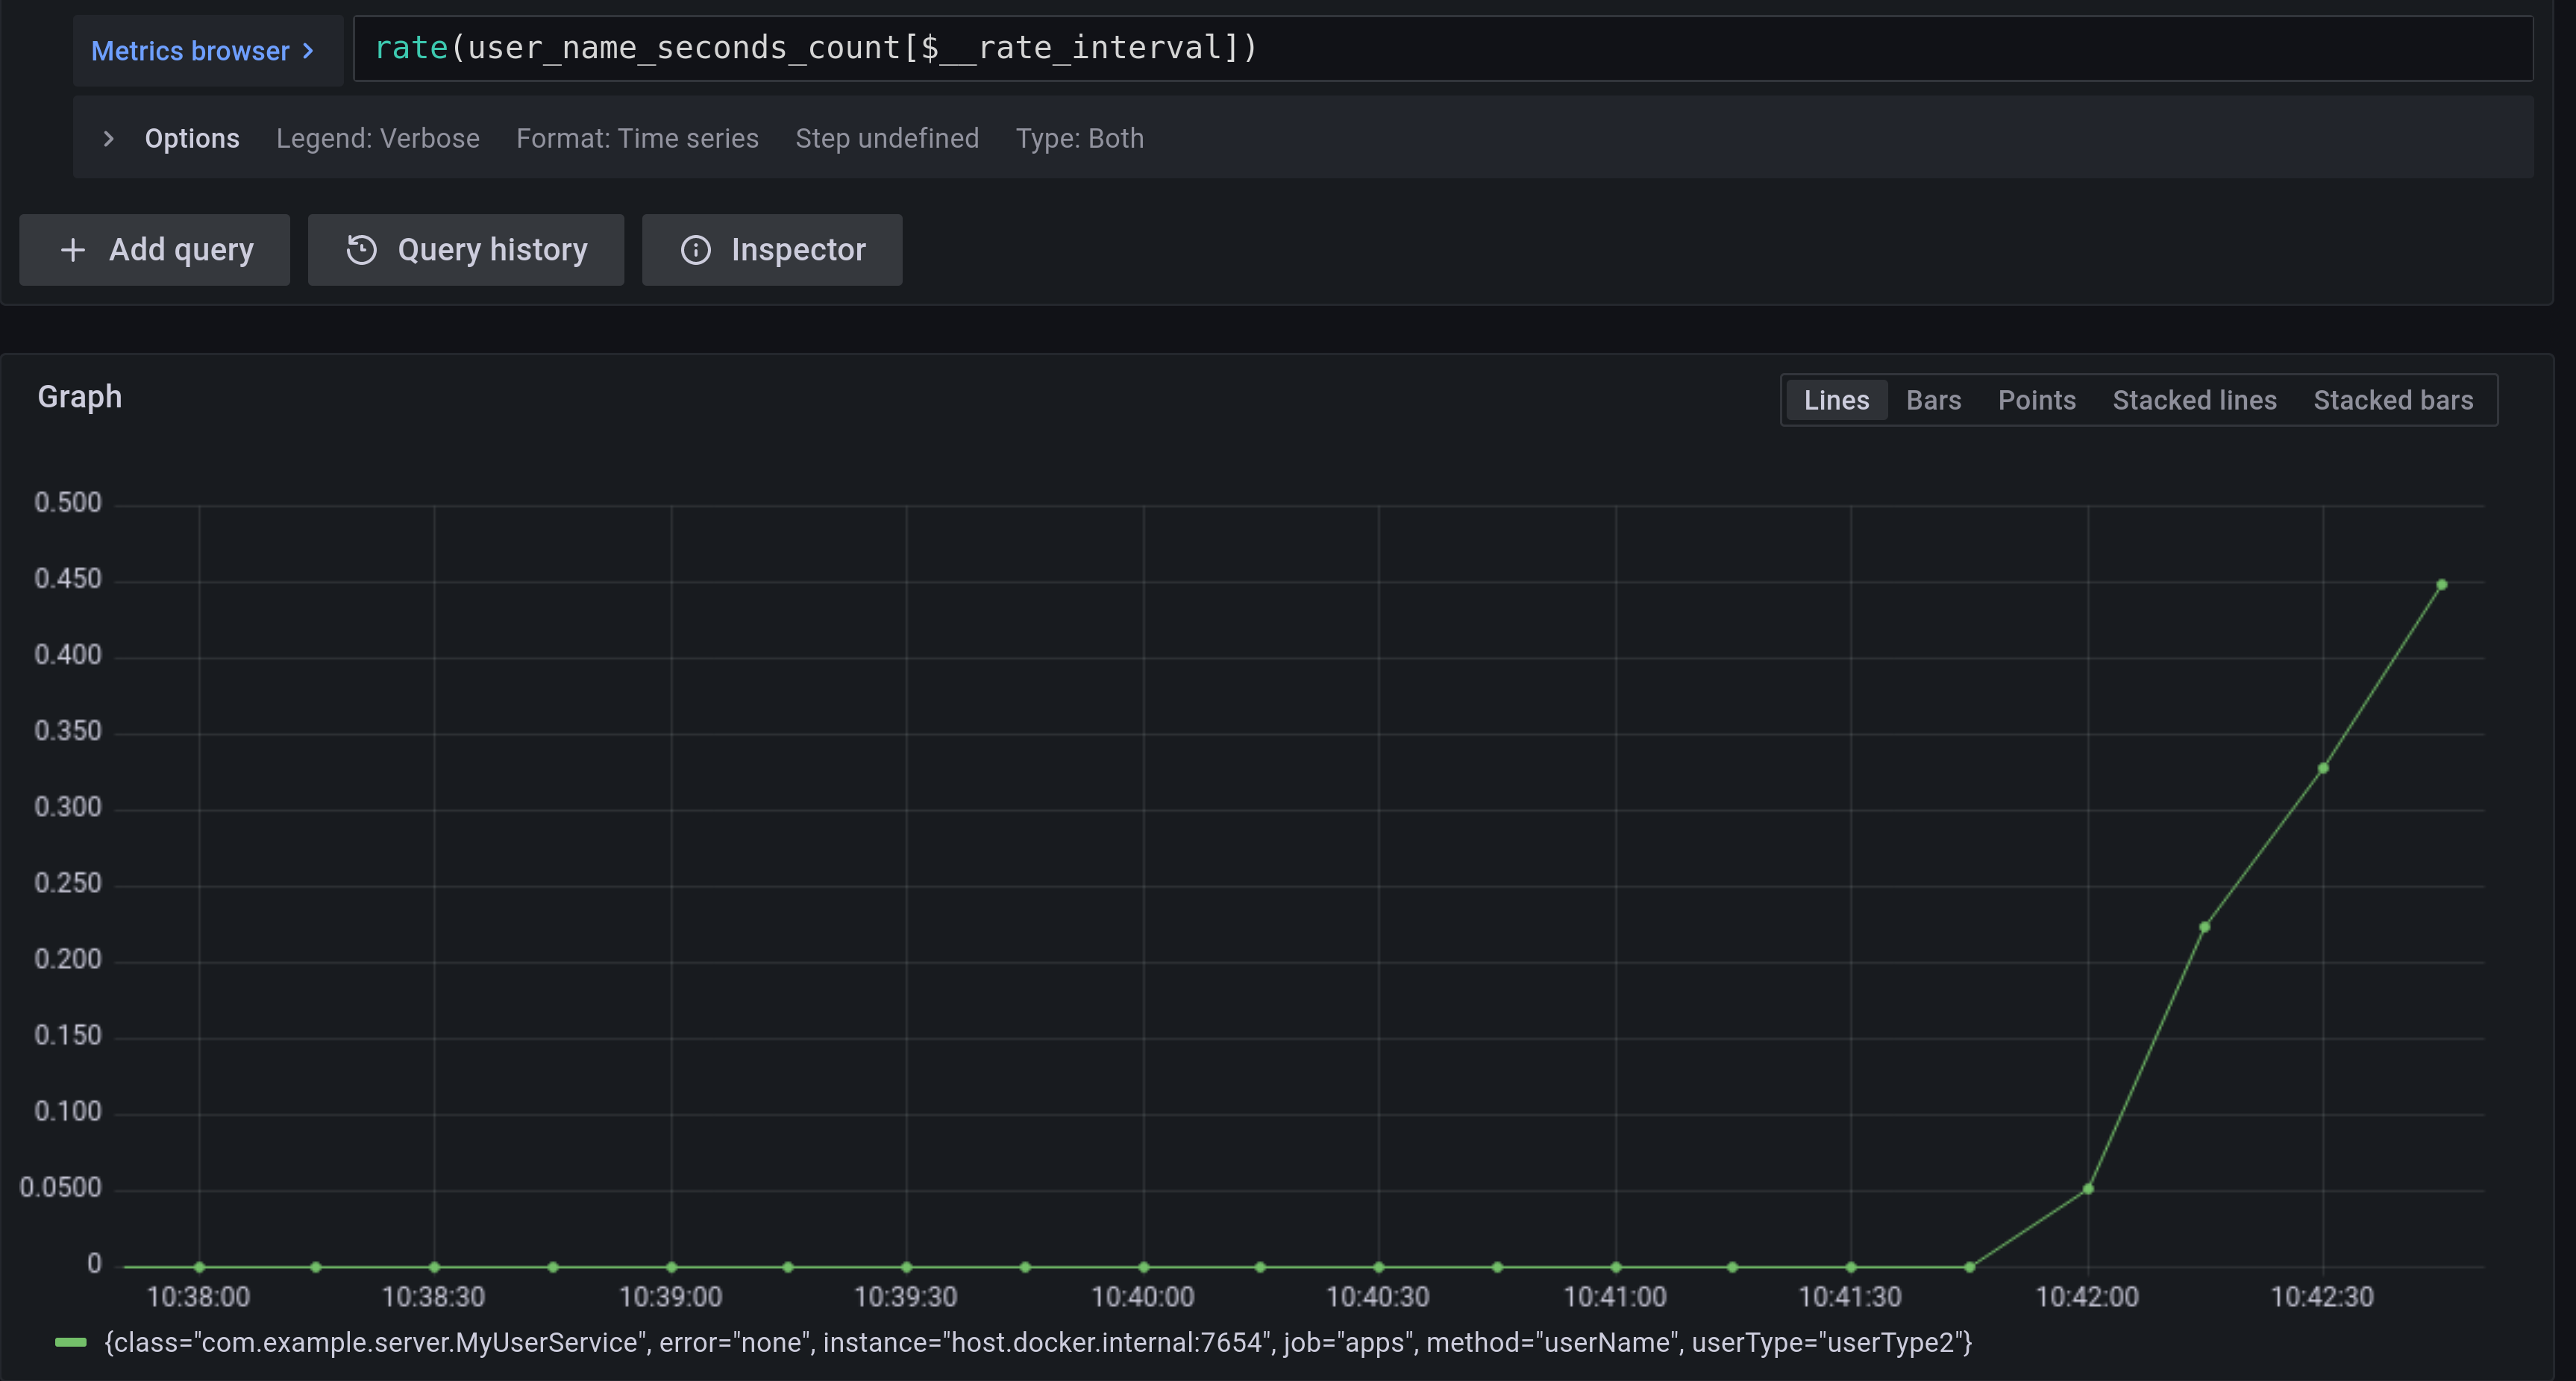
If you want to see the @Observed annotated method metrics, you can go to the Prometheus view and find the user_name Timer.
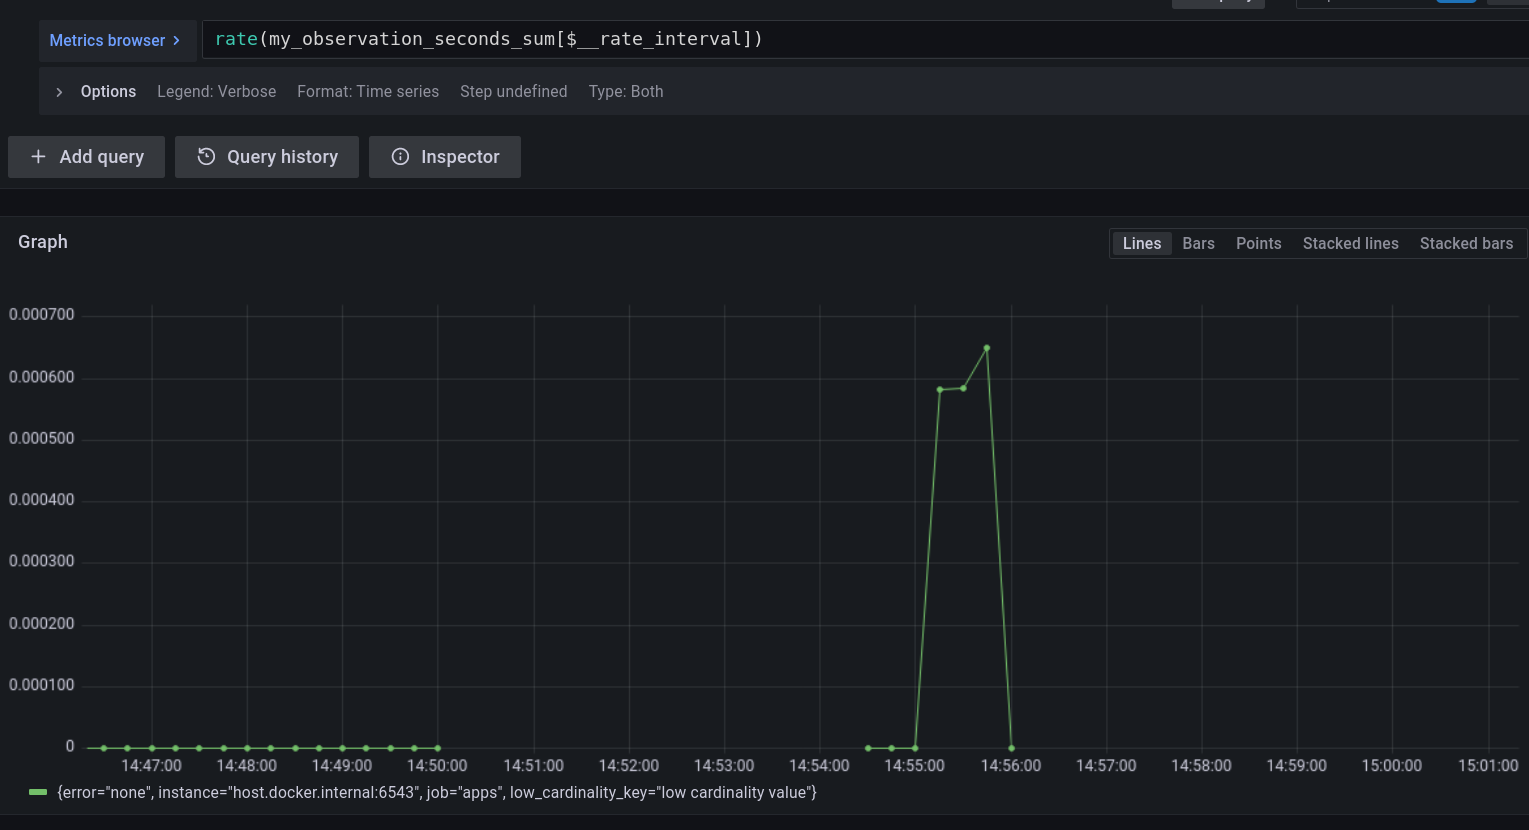
If you want to see the metrics from your Observation that you have manually created, go to the Prometheus view and find the my_observation Timer.
Running It All Together with AOT Support
To better understand how Spring Boot supports Native, please read this excellent blog post. We reuse that knowledge to run the previously created applications using Spring Native.
Building
To build the applications, you need GraalVM on your path. If you use SDKMan, invoke the following:
sdk install java 22.3.r17.ea-nik
See also GraalVM Quickstart.
To build the application with Maven, you need to enable the native profile:
$ ./mvnw native:compile -Pnative
Running
Run the server side application first
$ ./server/target/server
Next, run the client side application.
$ ./client/target/client
You should get output similar to this:
2022-10-10T12:57:17.712+02:00  INFO [client,,] 82009 --- [           main] com.example.client.ClientApplication     : Starting ClientApplication using Java 17.0.4 on marcin-precision5560 with PID 82009 (/home/marcin/repo/observability/blogs/bootRc1/client/target/client started by marcin in /home/marcin/repo/observability/blogs/bootRc1)
2022-10-10T12:57:17.712+02:00  INFO [client,,] 82009 --- [           main] com.example.client.ClientApplication     : No active profile set, falling back to 1 default profile: "default"
2022-10-10T12:57:17.723+02:00  INFO [client,,] 82009 --- [           main] o.s.b.w.embedded.tomcat.TomcatWebServer  : Tomcat initialized with port(s): 6543 (http)
2022-10-10T12:57:17.723+02:00  INFO [client,,] 82009 --- [           main] o.apache.catalina.core.StandardService   : Starting service [Tomcat]
2022-10-10T12:57:17.723+02:00  INFO [client,,] 82009 --- [           main] o.apache.catalina.core.StandardEngine    : Starting Servlet engine: [Apache Tomcat/10.0.23]
2022-10-10T12:57:17.727+02:00  INFO [client,,] 82009 --- [           main] o.a.c.c.C.[Tomcat].[localhost].[/]       : Initializing Spring embedded WebApplicationContext
2022-10-10T12:57:17.727+02:00  INFO [client,,] 82009 --- [           main] w.s.c.ServletWebServerApplicationContext : Root WebApplicationContext: initialization completed in 15 ms
2022-10-10T12:57:17.731+02:00  WARN [client,,] 82009 --- [           main] i.m.c.i.binder.jvm.JvmGcMetrics          : GC notifications will not be available because MemoryPoolMXBeans are not provided by the JVM
2022-10-10T12:57:17.781+02:00  INFO [client,,] 82009 --- [           main] o.s.b.a.e.web.EndpointLinksResolver      : Exposing 15 endpoint(s) beneath base path '/actuator'
2022-10-10T12:57:17.783+02:00  INFO [client,,] 82009 --- [           main] o.s.b.w.embedded.tomcat.TomcatWebServer  : Tomcat started on port(s): 6543 (http) with context path ''
2022-10-10T12:57:17.783+02:00  INFO [client,,] 82009 --- [           main] com.example.client.ClientApplication     : Started ClientApplication in 0.077 seconds (process running for 0.079)
2022-10-10T12:57:17.784+02:00  INFO [client,27c1113e4276c4173daec3675f536bf4,e0f2db8b983607d8] 82009 --- [           main] com.example.client.ClientApplication     : Will send a request to the server
2022-10-10T12:57:17.820+02:00  INFO [client,27c1113e4276c4173daec3675f536bf4,e0f2db8b983607d8] 82009 --- [           main] com.example.client.ClientApplication     : Got response [foo]
2022-10-10T12:57:18.966+02:00  INFO [client,,] 82009 --- [nio-6543-exec-1] o.a.c.c.C.[Tomcat].[localhost].[/]       : Initializing Spring DispatcherServlet 'dispatcherServlet'
2022-10-10T12:57:18.966+02:00  INFO [client,,] 82009 --- [nio-6543-exec-1] o.s.web.servlet.DispatcherServlet        : Initializing Servlet 'dispatcherServlet'
2022-10-10T12:57:18.966+02:00  INFO [client,,] 82009 --- [nio-6543-exec-1] o.s.web.servlet.DispatcherServlet        : Completed initialization in 0 ms
2022-10-10T12:57:07.200+02:00  INFO [server,,] 81760 --- [           main] com.example.server.ServerApplication     : Starting ServerApplication using Java 17.0.4 on marcin-precision5560 with PID 81760 (/home/marcin/repo/observability/blogs/bootRc1/server/target/server started by marcin in /home/marcin/repo/observability/blogs/bootRc1)
2022-10-10T12:57:07.201+02:00  INFO [server,,] 81760 --- [           main] com.example.server.ServerApplication     : No active profile set, falling back to 1 default profile: "default"
2022-10-10T12:57:07.213+02:00  INFO [server,,] 81760 --- [           main] o.s.b.w.embedded.tomcat.TomcatWebServer  : Tomcat initialized with port(s): 7654 (http)
2022-10-10T12:57:07.213+02:00  INFO [server,,] 81760 --- [           main] o.apache.catalina.core.StandardService   : Starting service [Tomcat]
2022-10-10T12:57:07.213+02:00  INFO [server,,] 81760 --- [           main] o.apache.catalina.core.StandardEngine    : Starting Servlet engine: [Apache Tomcat/10.0.23]
2022-10-10T12:57:07.217+02:00  INFO [server,,] 81760 --- [           main] o.a.c.c.C.[Tomcat].[localhost].[/]       : Initializing Spring embedded WebApplicationContext
2022-10-10T12:57:07.217+02:00  INFO [server,,] 81760 --- [           main] w.s.c.ServletWebServerApplicationContext : Root WebApplicationContext: initialization completed in 16 ms
2022-10-10T12:57:07.222+02:00  WARN [server,,] 81760 --- [           main] i.m.c.i.binder.jvm.JvmGcMetrics          : GC notifications will not be available because MemoryPoolMXBeans are not provided by the JVM
2022-10-10T12:57:07.278+02:00  INFO [server,,] 81760 --- [           main] o.s.b.a.e.web.EndpointLinksResolver      : Exposing 15 endpoint(s) beneath base path '/actuator'
2022-10-10T12:57:07.280+02:00  INFO [server,,] 81760 --- [           main] o.s.b.w.embedded.tomcat.TomcatWebServer  : Tomcat started on port(s): 7654 (http) with context path ''
2022-10-10T12:57:07.281+02:00  INFO [server,,] 81760 --- [           main] com.example.server.ServerApplication     : Started ServerApplication in 0.086 seconds (process running for 0.088)
2022-10-10T12:57:07.639+02:00  INFO [server,,] 81760 --- [nio-7654-exec-1] o.a.c.c.C.[Tomcat].[localhost].[/]       : Initializing Spring DispatcherServlet 'dispatcherServlet'
2022-10-10T12:57:07.639+02:00  INFO [server,,] 81760 --- [nio-7654-exec-1] o.s.web.servlet.DispatcherServlet        : Initializing Servlet 'dispatcherServlet'
2022-10-10T12:57:07.640+02:00  INFO [server,,] 81760 --- [nio-7654-exec-1] o.s.web.servlet.DispatcherServlet        : Completed initialization in 1 ms
2022-10-10T12:57:17.785+02:00  INFO [server,,] 81760 --- [nio-7654-exec-8] com.example.server.MyHandler             : Before running the observation for context [http.server.requests]
2022-10-10T12:57:17.785+02:00  INFO [server,27c1113e4276c4173daec3675f536bf4,9affba5698490e2d] 81760 --- [nio-7654-exec-8] com.example.server.MyController          : Got a request
2022-10-10T12:57:17.820+02:00  INFO [server,,] 81760 --- [nio-7654-exec-8] com.example.server.MyHandler             : After running the observation for context [http.server.requests]
You can check Grafana for metrics, traces and logs!
Native Support Limitations
On the client side, we need to provide the reflect-config.js configuration manually. For more information, see this PR.
Summary
In this blog post, we have managed to give you an introduction of the main concepts behind the Micrometer Observability API. We have also shown you how you can create observations by using the Observation API and annotations. You can also visualize the latency, see the correlated logs, and check the metrics that come from your Spring Boot applications.
You could also observe your applications by using native images with Spring Native.
Acknowledgments
Work on the Micrometer Observability would not be possible without the extensive support of the whole Spring team, Tadaya Tsuyukubo, Johnny Lim, and all the other contributors and reviewers.
Next Steps
Based on community feedback, we will continue to improve our Observability story. We intend to go GA in November this year.
This is an exciting time for us. We would again like to thank everyone who has already contributed and reported feedback, and we look forward to further feedback! Check out Spring Boot’s latest snapshots! Check out the documentation of our projects: Micrometer Context Propagation, Micrometer, Micrometer Observation, Micrometer Tracing and Micrometer Docs Generator! Click here to see the code used for this blog post.
Recommend
About Joyk
Aggregate valuable and interesting links.
Joyk means Joy of geeK