

Reactive CRUD Performance: A Case Study
source link: https://quarkus.io/blog/reactive-crud-performance-case-study/
Go to the source link to view the article. You can view the picture content, updated content and better typesetting reading experience. If the link is broken, please click the button below to view the snapshot at that time.

Blog Reactive CRUD Performance: A Case Study
Reactive CRUD Performance: A Case Study

By John O'Hara
We were approached for comment about the relative performance of Quarkus for a reactive CRUD workload. This is a good case study into performance test design and some of the considerations required and hurdles that need to be overcome. What methodology can we derive for ensuring that the test we are performing is indeed the test that we are expecting?
"Why is Quarkus 600x times slower than {INSERT_FRAMEWORK_HERE}?!?"
A recent report of bad result from Quarkus warranted some further investigation. On the face of it the results looked bad, really bad, for Quarkus.
tl;dr
By correcting implementation errors in a benchmark test, and carefully designing the test environment to ensure that only the application is being stressed, Quarkus goes from handling 1.75 req/sec to nearly 26,000 req/sec. Each request queried and wrote to a MySQL database, using the same load driver and hardware.
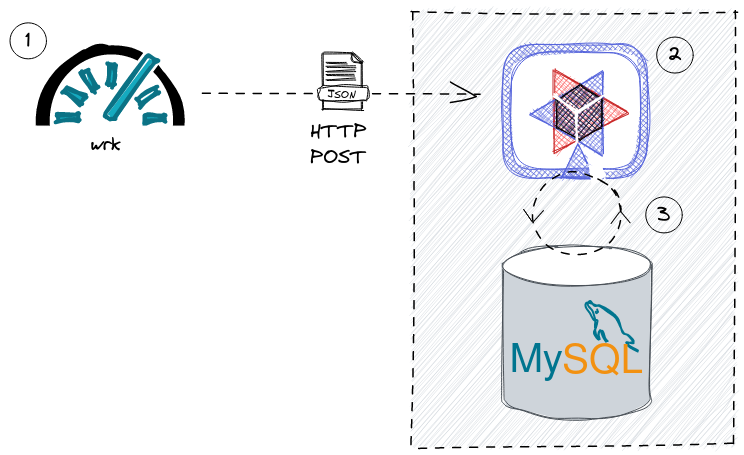
Test architecture
The test that was shared with us is a simple load test that updates a database via REST invocations;
-
A load generator creates a continuous stream of HTTP POST requests to a REST api. In this case wrk
-
A Quarkus application process the request via RESTEasy Reactive
-
The Quarkus application queries and updates a MySQL database instance via Hibernate Reactive
The source code for the test can be found here: https://github.com/thiagohora/tutorials/tree/fix_jmeter_test
To learn more about creating Reactive Applications with Quarkus, please read the Getting Started With Reactive guide
Initial Results 
Initial results for Quarkus were not promising;
That was 105 requests in 60 seconds, with 10 errors. Only 95 requests had been successfully sent in 60 seconds, or 1.75 req/sec
Running the comparison test on my machine;
Overall, the request rate that Quarkus could support was only 1.75 req/sec!! Ok, so it wasn’t 600 times slower, but it was 192 times slower on my machine.
but… something was not correct, Quarkus was displaying the following exception in the service logs;
An initial investigation showed that the number of open MySQL connections during the test was very high: 96 open connections
And checking the number of inserts the application had managed to perform within 1minutes;
There was obviously something wrong with the database connections! Each connection was committing only a single value to the database and no more progress was being made. The number of entries in the database tallied exactly with the number of successful HTTP requests.
Reviewing the CPU time for the Quarkus process confirmed that no further work was being done after the initial 95 commits to the database, the application was deadlocked;
|
Is the application behaving as expected? If the application is erroring, the results are not valid. Before continuing, investigate why the errors are occurring and fix the application. |
Initial inspection of code
A quick review of the code revealed the deadlocking issue;
Ah Ha! the endpoint is annotated with @Transactional. The application is using Hibernate Reactive, so instead we need to use the @ReactiveTransactional annotation. For further details, please read the Simplified Hibernate Reactive with Panache guide. This can be confusing, but conversations have started about how to clarify the different requirements and warn users if there is an issue.
Quarkus Application Fixed 
Let’s try again:
390.21 req/sec!! that’s much better!!
With the test fixed, we can see a lot more data in the database table;
| The test has been designed to query the database if a ZipCode already exists, before attempting to insert a new ZipCode. There are a finite number of ZipCodes, so as the test progresses, the number of ZipCode entries will tend towards the maximum number of ZipCodes. The workload progresses from being write heavy to read heavy. |
Same results
but… my hard disk on my machine was making a lot of noise during the test! The Quarkus result of 390.21 req/sec is suspiciously similar to the comparison baseline of 336.86 req/sec, and…
The application is using less than 0.5 cores on a 32 core machine… hmm!
|
Is the application the bottleneck? If a system component is the performance bottleneck (i.e. not the application under test), we are not actually stress testing the application. |
Move to a faster Disk
Let’s move the database files to a faster disk;
and re-run the test
Sit back, Relax and Profit! 25,599.85 req/sec!
|
Do not stop here! While it is easy to claim we have resolved the issue, for comparisons, we still do not have a controlled environment to run tests! |
System bottleneck still exists
the Quarkus process is now using 4.5 cores…
but… the system is 60% idle
We still have a bottleneck outside of the application, most likely within MySQL or we are still I/O bound!
At this point, we have a couple of options, we can either;
A) tune MySQL/IO so that they are no longer the bottleneck
B) constrain that application below the maximum, such that the rest of the system is operating within its limits
The easiest option is to simply constrain the application.
|
Choose your scaling methodology We can either scale up or tune the system, or we can scale down the application to below the limits of the system. Choosing to scale up the system, or constrain the application, is a decision dependent on the goals of the testing. |
Constrain application
We will remove the MySQL/System bottleneck by constraining the application to 4 CPU cores, therefore reducing the maximum load the application can drive to the database. We achieve this by running the application in docker;
and re-running the test;
Ok, so we are not at Max Throughput, but we have removed the system outside of the application as a bottleneck. The bottleneck is NOW the application
|
Create an environment where the comparisons are valid By constraining the application, we are not running at absolute Max Throughput possible, but we have created an environment that allows for comparisons between frameworks. With a constrained application environment, we will not be in the situation where one or more frameworks are sustaining throughput levels that are at the limit of the system. If any application is at the system limit, the results are invalid. |
All network traffic is not equal!
Further investigation showed that Quarkus is not running with TLS enabled between the application and database, so database network traffic is running un-encrypted. Let’s fix that;
and re-run
This provided us with a final, comparable throughput result of 14,955.61 req/sec
|
For comparisons, we need to ensure that each framework is performing the same work |

Results
Is Quarkus really 600x times slower than Framework X/Y/Z? Of course not!
On my machine;
-
the initial result was 1.75 req/sec.
-
fixing the application brought that up to 390.21 req/sec
-
fixing some of the system bottlenecks gave us 25,599.85 req/sec
-
constraining the application, so that a fairer comparison with other frameworks can be made resulted in 18,667.87 req/sec
-
and finally, enabling TLS encryption to the database gives a final result of 14,955.61 req/sec
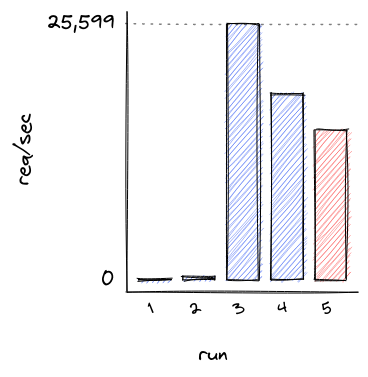
| Run 5 gives us our baseline for comparison, 14,955.61 req/sec |
Where does that leave Quarkus compared to Framework X/Y/Z?
well… that is an exercise for the reader ;-)
Summary
Do these results show that Quarkus is quick? Well kinda, they hint at it, but there are still issues with the methodology that need resolving.
However, when faced with a benchmark result, especially one that does not appear to make sense, there are a number of steps you can take to validate the result;
-
Fix the application: Are there errors? Is the test functioning as expected? If there are errors, resolve them
-
Ensure the application is the bottleneck: What are the limiting factors for the test? Is the test CPU, Network I/O, Disk I/O bound?
-
Do not stop evaluating the test when you see a "good" result. For comparisons, you need to ensure that every framework is the limiting factor for performance and not the system.
-
Chose how to constrain the application: either by scaling up the system, or scaling down the application.
-
Validate that all frameworks are doing the same work. For comparisons, are the frameworks performing the same work?
-
Ensure al frameworks are providing the same level of security. Are the semantics the same? e.g. same TLS encoding? same db transaction isolation levels?
| The System Under Test includes the System. Do not automatically assume that your application is the bottleneck |
Notes on Methodology
|
Does this benchmark tell us everything we need to know about how Quarkus behaves under load? Not really! It gives us one data point In order to have a meaningful understanding of behavior under load, the following issues with methodology need to be addressed;
|
Recommend
About Joyk
Aggregate valuable and interesting links.
Joyk means Joy of geeK