

记一次 .NET 某自动化采集软件 崩溃分析 - 一线码农
source link: https://www.cnblogs.com/huangxincheng/p/16910254.html
Go to the source link to view the article. You can view the picture content, updated content and better typesetting reading experience. If the link is broken, please click the button below to view the snapshot at that time.

1.讲故事
前段时间有位朋友找到我,说他的程序在客户的机器上跑着跑着会出现偶发卡死,然后就崩掉了,但在本地怎么也没复现,dump也抓到了,让我帮忙看下到底怎么回事,其实崩溃类的dump也有简单的,也有非常复杂的,因为大多情况下都是非托管层面出现的各种故障,非常考验对 C, C++, Win32 API 以及 汇编 的理解,所以能不能解决看运气吧, 不管怎么说,先上 WinDbg。
二:WinDbg分析
1. 查找崩溃点
WinDbg 非常牛的地方在于它拥有一个自动化崩溃分析命令 !analyze -v,它的输出信息非常有参考价值,所以尝试一下看看。
0:136> !analyze -v
*******************************************************************************
*                                                                             *
*                        Exception Analysis                                   *
*                                                                             *
*******************************************************************************
CONTEXT:  (.ecxr)
eax=00000000 ebx=00000000 ecx=00000000 edx=00000000 esi=00000003 edi=00000003
eip=777cf04c esp=22dfd678 ebp=22dfd808 iopl=0         nv up ei pl nz na pe nc
cs=0023  ss=002b  ds=002b  es=002b  fs=0053  gs=002b             efl=00000206
ntdll!NtWaitForMultipleObjects+0xc:
777cf04c c21400          ret     14h
Resetting default scope

EXCEPTION_RECORD:  (.exr -1)
ExceptionAddress: 0174ba6d
   ExceptionCode: 00000000
  ExceptionFlags: 00000000
NumberParameters: 0

PROCESS_NAME:  xxx.exe

STACK_TEXT:
22dfd808 75b23b10     00000003 22dfdc68 00000001 ntdll!NtWaitForMultipleObjects+0xc
22dfd808 75b23a08     00000003 22dfdc68 00000000 KERNELBASE!WaitForMultipleObjectsEx+0xf0
22dfd824 672ff11a     00000003 22dfdc68 00000000 KERNELBASE!WaitForMultipleObjects+0x18
22dfdca4 672ff3ac     672dd150 672d0000 00000003 Faultrep!WerpReportFaultInternal+0x59e
22dfdcc4 672dd17d     22dfdcec 708d0479 22dfdd60 Faultrep!WerpReportFault+0x9e
22dfdccc 708d0479     22dfdd60 00000000 22dfdd60 Faultrep!ReportFault+0x2d
22dfdcec 708d07e9     ec030e28 1c8f7728 00000003 clr!DoReportFault+0x43
22dfdd44 709f3c7e     00000003 22dfe140 2e954594 clr!WatsonLastChance+0x19a
22dfe090 709f3d90     ec0333f0 22dfe140 2e954594 clr!DoWatsonForUserBreak+0xc2
22dfe120 6fdc690f     00000000 00000000 00000000 clr!DebugDebugger::Break+0xc9
22dfe148 0174ba6d     00000000 00000000 00000000 mscorlib_ni!System.Diagnostics.Debugger.Break+0x57
WARNING: Frame IP not in any known module. Following frames may be wrong.
22dfe194 0174b58b     00000000 00000000 00000000 0x174ba6d
22dfe1e8 0174b525     00000000 00000000 00000000 mscorlib_ni!System.Runtime.CompilerServices.AsyncTaskMethodBuilder.Start<<xxxAsync>d__10>+0x43
22dfe1e8 0174b525     00000000 00000000 00000000 mscorlib_ni!System.Runtime.CompilerServices.AsyncTaskMethodBuilder.Start<<xxxAsync>d__10>+0x43
22dfe22c 0174b3bd     00000000 00000000 00000000 0x174b525
22dfe27c 0174b33b     00000000 00000000 00000000 0x174b3bd
22dfe2d0 0174b2d5     00000000 00000000 00000000 0x174b33b
...

SYMBOL_NAME:  faultrep!WerpReportFaultInternal+59e

MODULE_NAME: Faultrep

IMAGE_NAME:  Faultrep.dll

STACK_COMMAND:  ~136s; .ecxr ; kb

...
从卦中的调用栈看,有二个非常重要的信息。
- Debugger.Break()
这个是 C# 对 int 3 的封装,即 断点中断异常,目的就是将程序的所有线程中断。
- Faultrep!ReportFault()
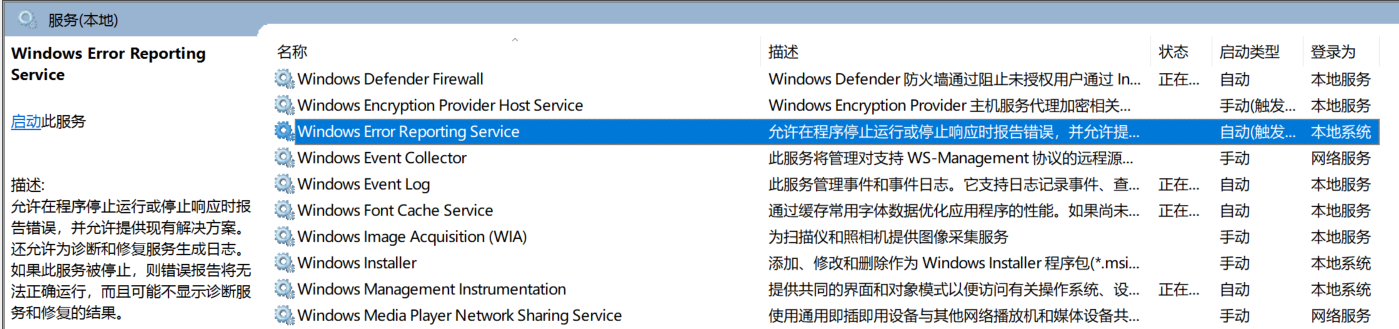
这个是 WER 2.0 ,全称为 Windows Error Reporting Service,用来抓崩溃dump的,前身是 Waston 医生,在 Windows 服务列表中可以看到。
还有一点, Faultrep.dll 是 WER 的一个组件,会在抓取过程中自动加载,我们用 lm 观察进程中的 dll 列表。
0:136> lm
start    end        module name
00fe0000 01034000   xxx C (service symbols: CLR Symbols without PDB)
0c100000 0c123000   WINMMBASE   (deferred)
662d0000 662ef000   clrcompression   (deferred)
672d0000 67327000   Faultrep   (pdb symbols)          c:\mysymbols\FaultRep.pdb\E16126C7FB9849A8B9AC57D8D62CABB01\FaultRep.pdb
...
汇总以上信息,大概就能推测出代码中用了 Debugger.Break() 函数,因为无catch处理,Windows 启动了 WER 2.0,程序代码在 ntdll!NtWaitForMultipleObjects 处等待第三方组件处理完毕,因为各种原因出现了问题导致无法返回最后崩溃。
通过卦中的信息我们大概知道了前因后果,但代码中为什么会出现 Debugger.Break() 呢?这就需要我们继续深挖。
2. 为什么会有 Debugger.Break()
刚才的输出中有这么一段话: STACK_COMMAND: ~136s; .ecxr ; kb ,它可以让我们找到异常前的调用栈,为了能看到托管栈,这里将 kb 改成 !clrstack 。
0:136>  ~136s; .ecxr ; !clrstack

OS Thread Id: 0x13ec (136)
Child SP       IP Call Site
22dfe0ac 777cf04c [HelperMethodFrame: 22dfe0ac] System.Diagnostics.Debugger.BreakInternal()
22dfe128 6fdc690f System.Diagnostics.Debugger.Break() [f:\dd\ndp\clr\src\BCL\system\diagnostics\debugger.cs @ 65]
22dfe150 0174ba6d xxx.xxx+d__10.MoveNext()
22dfe19c 0174b58b System.Runtime.CompilerServices.AsyncTaskMethodBuilder.Start[[xxx.xxx+d__10, xxx.Abstractions]](d__10 ByRef) [f:\dd\ndp\clr\src\BCL\system\runtime\compilerservices\AsyncMethodBuilder.cs @ 316]
22dfe1f0 0174b525 xxx.xxxAsync(System.String, System.String)
22dfe238 0174b3bd xxx.xxxProducer+d__7.MoveNext()
22dfe284 0174b33b System.Runtime.CompilerServices.AsyncTaskMethodBuilder.Start[[xxx.xxx+d__7, xxx.Abstractions]](d__7 ByRef)
22dfe2d8 0174b2d5 xxx.xxx.xxx(System.String, System.String)
从卦中看,貌似是在一个异步方法中手工调用了 Deubgger.Break() 方法,接下来我们观察下源码,由于比较隐私,这里就简化一下。
internal async Task xxxAsync(string x1, string x2)
{
    if (string.IsNullOrEmpty(x1))
    {
        Debugger.Break();
        return;
    }
    if (string.IsNullOrEmpty(x2))
    {
        Debugger.Break();
        return;
    }
    ...
}
这代码果然有意思,在防御性编程中居然用 Debugger.Break() 来处理,比较少见。
找到了问题源头,解决方法就简单了,大概有两种做法。
-
去掉
Debugger.Break()语句 -
关闭 WER 2.0 服务

3. 对 Debugger.Break() 的题外话
在 clr 源码中有对 Debugger.Break() 非常详细的注释。
// This does a user break, triggered by System.Diagnostics.Debugger.Break, or the IL opcode for break.
//
// Notes:
//    If a managed debugger is attached, this should send the managed UserBreak event.
//    Else if a native debugger is attached, this should send a native break event (kernel32!DebugBreak)
//    Else, this should invoke Watson.
//
// Historical trivia:
// - In whidbey, this would still invoke Watson if a native-only debugger is attached.
// - In arrowhead, the managed debugging pipeline switched to be built on the native pipeline.
FCIMPL0(void, DebugDebugger::Break)
{
    ...
}
FCIMPLEND
注释文本: Else, this should invoke Watson 中的 Watson 其实就是本篇聊到的 WER,观察反汇编其实就是对 int 3 的封装。
0:136> uf kernelBase!DebugBreak
KERNELBASE!DebugBreak:
75ba5e40 8bff            mov     edi,edi
75ba5e42 cc              int     3
75ba5e43 c3              ret
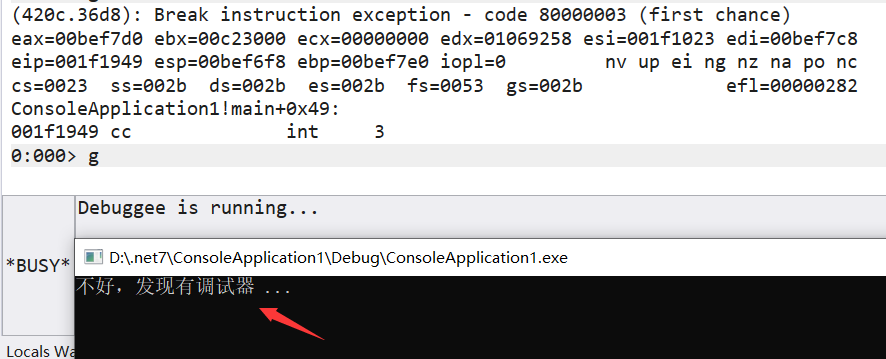
在很多反调试机制中,经常会用 int 3 来检测当前程序是否被附加了调试器,参考如下 C++ 代码。
#include <iostream>
int isAttach = 0;
int main()
{
__try
{
__asm {
int 3
}
isAttach = 1;
}
__except(1)
{
isAttach = 0;
}
if (isAttach) {
printf("不好,发现有调试器 ...");
}
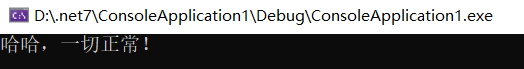
else {
printf("哈哈,一切正常!");
}
getchar();
}
如果你用 WinDbg 附加上去, 就会被程序检测到,截图如下:
如果是正常运行,会是如下界面
可以在 C# 中通过 Pinvoke 引入,这种动态方式,反反调试会有不小的难度。
这次事故是朋友在开发过程中为了方便调试,使用了 Debugger.Break() 方法,但在生产环境下并没有删除,导致在某些客户机器上因为 WER 的开启,被 Waston 捕获导致的事故。
本次教训是:发给客户的版本,内含的调试信息该关闭的一定要关闭,以免生出此乱。

Recommend
About Joyk
Aggregate valuable and interesting links.
Joyk means Joy of geeK