

Implement DevSecOps to Secure Your CI/CD Pipeline
source link: https://dzone.com/articles/implement-devsecops-to-secure-your-cicd-pipeline
Go to the source link to view the article. You can view the picture content, updated content and better typesetting reading experience. If the link is broken, please click the button below to view the snapshot at that time.

Before understanding DevSecOps, let’s understand what DevOps is. DevOps is the combination of cultural philosophies, practices, and tools that increase an organization’s ability to deliver applications and services at high velocity.
In fast-moving projects, security often lags behind and is given low priority, which may lead to buggy code and hacks. Let’s see how we can reduce the risk of attack by integrating security into our DevOps pipeline.
What is DevSecOps (DevOps + Security)?
DevSecOps is a cultural approach where every team and person working on an application considers security throughout its lifecycle. It ensures that security is implemented at every stage of the application Software Development Lifecycle (SDLC) by incorporating required security checks embedded into CI/CD automation using appropriate tools.
For example, let’s see how the DevSecOps process can detect and prevent zero-day vulnerabilities like log4j. Using the Syft tool, we can generate SBOM for our application code and pass this SBOM report to Grype, which can detect these new vulnerabilities and report to us if there is any fix or patch available. As these steps are part of our CI/CD, we can alert our developers and security team to remediate this issue as soon as it is identified.
Benefits of Using DevSecOps
- Finds vulnerabilities and bugs at an earlier stage of development
- Streamlined compliance
- Speedy recovery
- Secure supply chain
- Cost saving
- Can include AI-based monitoring for detecting anomalies
- Reduces the risk of surface attack and increases confidence
- Full visibility of potential threats and possible ways to remediate it
How to Make Security Culture Your Default State
Unless you’ve included security in every employee’s onboarding, creating a widespread security culture mindset will be challenging. Employees will need to think differently, behave differently, and eventually turn those changes into habits so that security becomes a natural part of their day-to-day work.
What Does the DevSecOps CI/CD Pipeline Look Like?
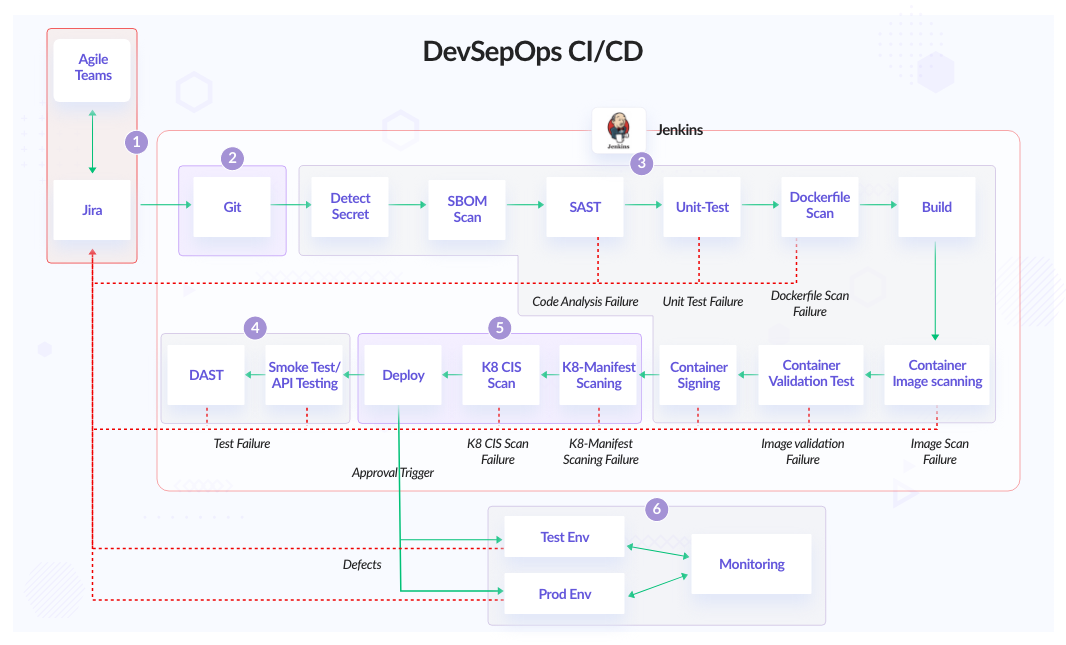
Jenkins DevSecOps Pipeline
In this post, we will cover the following standard CI/CD stages and how to secure them:
- Plan/Design
- Develop
- Build and code analysis
- Test
- Deploy
Let’s dive into how to implement DevSecOps.
1. Plan/Design
In this stage, we outline where, how, and when integration, deployment, and security testing will be done.
1.1 Threat Modeling
It effectively puts you in the mindset of an attacker and allows us to see the application through the attacker's eyes and block their attack before they get a chance to do anything about it. We can use OWASP threat modeling or the method of simple questions from Microsoft to design our threat modeling. We can also use OWASP Threat Dragon and Cairis open-source threat modeling tools to create threat model diagrams for our secure development lifecycle.
1.2 Secure SDLC
A Secure SDLC requires adding security testing at each software development stage, from design to development, to deployment, and beyond. Examples include designing applications to ensure that your architecture will be secure and including security risk factors as part of the initial planning phase.
- Snyk Secure SDLC
In a secure software development cycle, we should separate our development, testing, and production environments and also have authorization processes that control the deployment promotion from one environment to another. This reduces the risk of a developer making unauthorized changes and ensures that any modifications pass through a standard approval process.
2. Develop
The Development stage starts with writing code, and we can use shift-left security best practice, which incorporates security thinking in the earliest stages of development. For example:
- Install linting tools inside the code editor, like Visual Studio Code. One of the most popular linting tools is SonarLint, which highlights bugs and security vulnerabilities as you write code.
- Use pre-commit hooks to prevent adding any secrets to code.
- Set up a protected branch and code reviews process.
- Sign git commits with the GPG key.
- Always verify the downloaded binary/file hash.
- Enable 2-factor authentication.
3. Build and Code Analysis
Before building, we need to scan our code for vulnerabilities and secrets. By doing static code analysis, it may detect a bug or a possible overflow in code, and these overflows lead to a memory leak, which degrades the system performance by reducing the amount of memory available for each program. Sometimes it can be used as an attack surface by hackers to exploit the data.
3.1 Scan for Secrets and Credentials
detect-secret is an enterprise-friendly tool for detecting and preventing secrets in the code base. We can also scan the non-git tracked files. There are other tools like Gitleaks, which also provide similar functionality.
detect-secrets scan test_data/ --all-files3.2 Software Bill of Materials (SBOM)
SBOM lets us identify all software components, libraries, and modules that are running in our environment, even their dependencies. It speeds up response time for new vulnerabilities—including zero-day vulnerabilities like Log4j.
We can use the tools below for the SBOM report.
3.2.1 Syft With Grype and Trivy
The Syft tool gives container image and filesystem SBOM results in CycloneDX open-source format, which can be shared easily. Syft also supports cosign attestations for verifying legit images.
syft nginx:latest -o cyclonedx-json=nginx.sbom.cdx.jsonSo we have generated an SBOM report that shows what libs and modules are running in our software. Now, let’s scan for vulnerabilities in SBOM reports using Grype.
[root@laptop ~]# grype sbom:./nginx.sbom.cdx.json |
head ✔ Vulnerability DB        [no update available]
✔ Scanned image           [157 vulnerabilities]
NAME              INSTALLED              FIXED-IN          TYPE  VULNERABILITY     SEVERITY   apt
    2.2.4                                        deb   CVE-2011-3374     Negligible  bsdutils
    1:2.36.1-8+deb11u1                       deb   CVE-2022-0563     Negligible  coreutils
    8.32-4+b1                                    deb   CVE-2017-18018    Negligible  coreutils
    8.32-4+b1              (won't fix)       deb   CVE-2016-2781     Low         curl
    7.74.0-1.3+deb11u1                       deb   CVE-2022-32208    Unknown     curl
    7.74.0-1.3+deb11u1                       deb   CVE-2022-27776    Medium      curl
    7.74.0-1.3+deb11u1     (won't fix)       deb   CVE-2021-22947    Medium      curl
    7.74.0-1.3+deb11u1     (won't fix)       deb   CVE-2021-22946    High        curl
    7.74.0-1.3+deb11u1     (won't fix)       deb   CVE-2021-22945    Critical
# Or we can directly use Grype for SBOM scanning
grype nginx:latest
Note: Many of the vulnerabilities scanned by SCA tools are neither exploitable nor fixable via regular updates. Curl and glibc are some examples. These tools show them as not fixable or won’t fix.
The latest version of Trivy can also generate SBOM reports, but it’s mostly used for finding vulnerabilities in containers and file systems.
3.2.2 OWASP Dependency-Check
OWASP Dependency-Check is a Software Composition Analysis (SCA) tool that attempts to detect publicly disclosed vulnerabilities contained within a project’s dependencies. It does this by determining if there is a Common Platform Enumeration (CPE) identifier for a given dependency. If found, it will generate a report linking to the associated CVE entries. We can also publish our SBOM report to Dependency-Track and visualize our software components and their vulnerabilities.
dependency-check.sh --scan /project_pathOnce we know what type of vulnerabilities are present in our software, we can patch them and make our application safe and secure.
3.3 Static Application Security Testing (SAST)
It’s a method of debugging code without running the program. It analyzes the code based on predefined rule sets.
SonarQube allows all developers to write cleaner and safer code. It supports several programming languages for scanning (Java, Kotlin, Go, JavaScript). It also supports running unit testing for code coverage. It can be easily integrated with Jenkins and Azure DevOps. Checkmarx, Veracode, and Klocwork also provide similar functionality, but these are paid tools.
docker run \
    --rm \
    -e SONAR_HOST_URL="http://${SONARQUBE_URL}" \
    -e SONAR_LOGIN="AuthenticationToken" \
    -v "${YOUR_REPO}:/usr/src" \
    sonarsource/sonar-scanner-cli
Source: Running SonarScanner from the Docker image.
3.4 Unit Test
In Unit tests, individual software code components are checked to ensure it is working as expected or not. Unit tests isolate a function or module of code and verify its correctness. We can use tools like JaCoCo for Java and Mocha and Jasmine for NodeJS to generate unit test reports. Lastly, we can send these reports to SonarQube, which shows us code coverage and the percentage of your code covered by your test cases.
Once SAST is done, we can scan our Dockerfile as well.
3.5 Dockerfile Static Scanning
Always scan the Dockerfile for vulnerabilities because while writing Dockerfile, we may miss some of the Dockerfile best practices, which may lead to vulnerable containers. To name a few common mistakes that we can avoid.
- Do not use the latest docker image tag.
- Ensure that a user for the container has been created.
Checkov or docker scan can be used to scan Dockerfile, which follows the best practice rules to write Dockerfile.
docker run -i -v $(pwd):/output bridgecrew/checkov -f /output/Dockerfile -o jsonAfter building a container image, we scan it for vulnerabilities and sign our container image.
3.6 Container Image Scan
Scanning images gives the security state of the container images and lets us take actions that result in a more secure container image. We should avoid installing unnecessary packages and use a multistage method. This keeps the image clean and safe. Scanning of images should be done in both development and production environments.
Below are a few well-known open-source and paid tools that we can use for container scanning:
- Open source: Trivy, Gryp, and Clair are widely used open-source tools for container scanning.
- Docker scan: It uses Snyk as the backend engine for scanning. It can also scan Dockerfile.
- Aqua scan: Provides container image scanning, but it has one unique feature: Aqua DTA (Dynamic Threat Analysis) for containers, which monitors behavioral patterns and Indicators of Compromise (IoCs), such as malicious behavior and network activity, to detect container escapes, malware, cryptocurrency miners, code injection backdoors, and additional threats.
trivy image nginx:latest
# OR
docker scan nginx:latest
3.7 Container Image Signing and Verifying
If the container build process is compromised, it makes users vulnerable to accidentally using the malicious image instead of the actual container image. Signing and verifying the container always ensures we are running the actual container image.
Using distroless images not only reduces the size of the container image but also reduces the surface attack. The need for container image signing is because even with the distroless images, there is a chance of facing some security threats, such as receiving a malicious image. We can use cosign or skopeo for container signing and verifying.
cosign sign --key cosign.key custom-nginx:latest cosign verify -key cosign.pub custom-nginx:latest3.8 Container Image Validation Test
Adding an extra layer of security on the container image to verify if it is working as expected and has all required files with correct permissions. We can use dgoss to do validation tests of container images.
For example, let’s do a validation test for the Nginx image that runs on port 80, has internet access, and verifies the correct file permission of /etc/nginx/nginx.conf and the Nginx user shell in the container.
dgoss edit nginx
goss add port 80
goss add http https://google.com
goss add file /etc/nginx/nginx.conf
goss add user nginx

# Once we exit it will copy the goss.yaml from the container to the current directory and we can modify it as per our validation.
# Validate

[root@home ~]# dgoss run -p 8000:80 nginx
INFO: Starting docker container INFO: Container ID: 5f8d9e20 INFO: Sleeping for 0.2 INFO: Container health INFO: Running Tests Port: tcp:80: listening: matches expectation: [true]
Port: tcp:80: ip: matches expectation: [["0.0.0.0"]]
HTTP: https://google.com: status: matches expectation: [200] File: /etc/nginx/nginx.conf: exists: matches expectation: [true]
File: /etc/nginx/nginx.conf: mode: matches expectation: ["0644"]
File: /etc/nginx/nginx.conf: owner: matches expectation: ["root"]
File: /etc/nginx/nginx.conf: group: matches expectation: ["root"]
User: nginx: uid: matches expectation: [101] User: nginx: gid: matches expectation: [101] User: nginx: home: matches expectation: ["/nonexistent"]
User: nginx: groups: matches expectation: [["nginx"]]
User: nginx: shell: matches expectation: ["/bin/false"]
Total Duration: 0.409s Count: 13, Failed: 0, Skipped: 0 INFO: Deleting container
We can also use kgoss to do validation tests on pods.
Until now, we have built and scanned the container image, but before deploying, let’s test and scan the deployment or Helm chart.
4. Test
Testing ensures the application works as expected and has no bugs or vulnerabilities.
4.1 Smoke Test
Smoke tests are small but check critical components and functionality of the application. When implemented, It runs on every application build to verify critical functionality passes before integration, and end-to-end testing can take place, which can be time-consuming. Smoke tests help create fast feedback loops that are vital to the software development life cycle.
For example, in a smoke test, we can run the curl command on API to get the HTTP response code and latency.
4.2 API Testing
Today’s applications might expose hundreds of highly valuable endpoints that are very appealing to hackers. Ensuring your APIs are secure before, during, and after production is crucial. Hence we need to test our APIs.
API Testing reports what type of authentication is required and whether sensitive data is encrypted over HTTP and SQL injections allowing you to bypass the login phase.
We can use Jmeter, Taurus, Postman, and SoapUI tools for API testing. Below is a small example using Jmeter where test.jmx contains the API test cases.
jmeter -n --t test.jmx -l result.jtl4.3 Dynamic Application Security Testing (DAST)
DAST is a web application security test that finds security issues in the running application. DAST tools are also known as web application vulnerability scanners, which can detect common vulnerabilities like SQL injection, cross-site scripting, security misconfigurations, and other common issues detailed in OWASP Top 10. We can use HCL Appscan, ZAP, Burp Suite, and Invicti, which finds vulnerabilities in the running web application.
zap.sh -cmd -quickurl http://example.com/ -quickprogress -quickout example.report.html5. Deploy
Deployment can be infrastructure or application; however, we should scan our deployment files. We can also add a manual trigger where the pipeline waits for external user validation before proceeding to the next stage, or it can be an automated trigger.
5.1 Static Scan of Kubernetes Manifest File or Helm Chart
It is always a good practice to scan your Kubernetes deployment or Helm chart before deploying. We can use Checkov to scan Kubernetes manifests and identifies security and configuration issues. It also supports Helm chart scanning. We can also use terrascan and kubeLinter to scan the Kubernetes manifest.
docker run -t -v $(pwd):/output bridgecrew/checkov -f /output/keycloak-deploy.yml -o json
# For Helm
docker run -t -v $(pwd):/output bridgecrew/checkov -d /output/ --framework helm -o json
5.2 Pre-Deploy Policy Check Kubernetes Manifest YAML File
Kyverno adds an extra layer of security where only the allowed type of manifest is deployed onto Kubernetes, otherwise, it will reject or we can set validationFailureAction to audit, which only logs the policy violation message for reporting. Kubewarden and Gatekeeper are alternative tools available to enforce policies on Kubernetes CRD.
5.3 kube-bench for CIS Scan
kube-bench checks whether Kubernetes is deployed securely by running the checks documented in the CIS Kubernetes Benchmark. We can deploy kube-bench as a job that runs daily and consumes its report in CI/CD to pass or fail the pipeline based on the level of severity.
kubectl apply -f eks-job.yaml kubectl logs kube-bench-pod-name5.4 IaC Scanning
- Checkov, Terrascan, and Kics can be used to scan our Infrastructure code. It supports Terraform, Cloudformation, and Azure ARM resources.
- Terratest can be used to test infrastructure in real time.
terraform init terraform plan -out tf.plan terraform show -json tf.plan | jq '.' > tf.json checkov -f tf.jsonAfter scanning for Kubernetes deployment and kube-bench, we can deploy our application and start with the testing stage.
6. Monitoring and Alerting
Monitoring and alerting is the process of collecting logs and metrics about everything happening in our infrastructure and sending notifications based on the metrics threshold value.
6.1 Metrics Monitoring
- Prometheus: It’s a widely used open-source tool for metrics monitoring. It provides various exporters that can be used for monitoring systems or application metrics. We can also use Grafana to visualize Prometheus metrics.
- Nagios and Zabbix: These are open-source software tools to monitor IT infrastructures such as networks, servers, virtual machines, and cloud services.
- Sensu Go: It is a complete solution for monitoring and observability at scale.
6.2 Log Monitoring
- OpenSearch/Elasticsearch: It is a real-time distributed and analytic engine that helps in performing various kinds of search operations.
- Graylog: It provides centralized log management functionality for collecting, storing, and analyzing data.
- Grafana Loki: It’s a lightweight log aggregation system designed to store and query logs from all your applications and infrastructure.
6.3 Alerting
- Prometheus Alertmanager: The Alertmanager handles alerts sent by client applications such as the Prometheus server.
- Grafana OnCall: Developer-friendly incident response with phone calls, SMS, Slack, and Telegram notifications.
Security-focused logging and monitoring policy is used to prevent sensitive information from being logged in plain text. We can write a test case in our logging system to look for certain patterns of data. For example, a regex to find out sensitive information so we can detect the logs in a lower environment.
Application Performance Monitoring (APM) improves the visibility into a distributed microservices architecture. The APM data can help enhance software security by allowing a full view of an application. Distributed tracing tools like Zipkin and Jaeger kind of stitch all logs together and bring full visibility of requests from start to end. It speeds up response time for new bugs or attacks.
Although all cloud providers have their own monitoring toolsets and some tools are accessible from the marketplace. Also, there are paid monitoring tool providers like Newrelic, Datadog, Appdynamics, and Splunk that provide all types of monitoring.
6.4 Security Information and Event Management (SIEM)
Security Information and Event Management (SIEM) offer real-time monitoring and analysis of events, tracking, and logging of security data for compliance or auditing purposes. Splunk, Elastic SIEM, and Wazuh, which give automated detection of suspicious activity and tools with behavior-based rules also can detect anomalies using prebuilt ML jobs.
6.5 Auditing
After the deployment visibility comes from the level of auditing that has been put in place on the application and infrastructure, the goal is to have your auditing at a level that allows you to feed info into a security tool to give needed data. We can enable audits on the AWS cloud using CloudTrail and on Azure with platform logs. For auditing applications, we can enable inbuilt audit logs and send the audit data to any logging tool like Elasticsearch using auditbeat or Splunk and create an auditing dashboard.
6.6 Kubernetes Runtime Security Monitoring
Falco is a cloud-native Kubernetes threat detection tool. It can detect unexpected behavior, intrusions, and data theft in real-time. In the backend, it uses Linux eBPF technology to trace your system and applications at runtime. For example, it can detect if someone tries to read a secret file inside a container, access a pod as a root user, etc., and trigger a webhook or send logs to the monitoring system. There are similar tools like Tetragon, KubeArmor, and Tracee, which also provide Kubernetes runtime security.
Until now, we have seen what the DevSecOps CI/CD pipeline looks like. Now, let’s dive into adding more security layers on top.
Best Practices to Secure Your Infrastructure for DevSecOps CI/CD
Network Security
Networking is our first defense against any kind of attack and to prevent attacks on our application we should harden our network.
- Create a separate private network for the workload (eg. App and DB) and only allow internet access from NAT.
- Set fine-grained access on inbound and outbound network rules. Also, we can use Cloud custodian to set the security compliance, which automatically removes any unwanted network traffic.
- Always configure Network ACL (NACL) for subnets in AWS. The best practice would be to block all outbound traffic and then allow the required rules.
- Use a Web Application Firewall (WAF).
- Enable DDOS protection.
- Nmap, Wireshark, and tcpdump tools can scan networks and packets.
- Use VPN or Bastion host for connecting to infrastructure networks.
Web Application Firewall (WAF)
WAF is a layer 7 firewall that protects our web applications against common web exploits (like XSS and SQL injection) and bots that may affect availability, compromise security, or consume excessive resources. Most cloud service providers provide WAF, and with a few clicks, we can easily integrate it with our application.
Curiefense is an open-source cloud-native self-managed WAF tool that can be used to protect all forms of web traffic, services, DDoS, and APIs. We can also use WAF as a service from Cloudflare and Imperva.
Identity Access Management (IAM)
IAM is a centrally defined policy to control access to data, applications, and other network assets. Below are a few methods that help prevent unauthorized access.
- Have centralized user management using Active Directory or LDAP.
- Use RBAC access management.
- Have a fine-grained access policy for the AWS IAM role.
- Rotate the user’s access and secret keys periodically.
- Use Teleport for centralized connectivity, authentication, authorization, and audit.
- Store secrets in vaults and ensure that it is only accessible to authorized users.
- Implement zero trust within your services.
Cloud, Server, and Application Hardening
We can use the CIS benchmark to harden the cloud, operating system, and application. It is always a good practice to use a hardened OS as it reduces the attack surface of the server. Most of the cloud providers provide a hardened image, or we can create our own custom hardened image.
Nowadays, most applications run inside containers. We need to harden our applications and containers by doing static analysis and container image scanning.
To protect against viruses, trojans, malware, and other malicious threats, we can install Antivirus like Falcon, SentinelOne, or Clamav.
Server Patching
The most common attack vector exploits vulnerabilities in the OS or applications running on servers. Running regular vulnerability scans against the environments and updating regular packages reduces the risk of vulnerability.
We can create an automation pipeline to patch the server using Foreman or Red Hat Satellite, and for scanning, we can use OpenVAS or Nessus to get the list of vulnerabilities.
Securing Kubernetes
Kubernetes has become the backbone of modern infrastructure and to make sure we are running it securely we can use the below tools:
- Use the correct security context in the Kubernetes YAML file.
- Use Network Policy to block all the traffic by default and only allow required traffic.
- Use Service Mesh (Linkerd, Istio) to have mTLS communication between microservices and implement Authorization to have fine-grained access.
- Implement kube-bench for a CIS benchmark report for the Kubernetes cluster. We can run this scan daily in our Kubernetes cluster and fix any reported vulnerabilities.
- Use tools like Kube-hunter, Popeye, and Kubescape for security weaknesses and misconfigurations in Kubernetes clusters and visibility of security issues.
- Use Checkov, KubeLinter, and Terrascan for scanning Kubernetes YAML and Helm charts with best practices and vulnerabilities.
- Implement pre-deployment policy checks like Kyverno, Kubewarden, and Gatekeeper can block the non-standard deployment.
- Use a hardened image for the worker server. All cloud providers provide CIS benchmark hardened images. We can also build our own custom hardened image using amazon-eks-ami.
- Store Kubernetes secret in an encrypted format or use an external secret manager like Vault.
- Use IAM roles for service accounts to assign AWS roles directly to Kubernetes service accounts.
- Implement Chaos Mesh and Litmus chaos engineering framework to understand the behavior and stability of application in real-world use cases.
- Follow the best practices to secure Kubernetes.
- Use tools like Falco and Tracee to monitor runtime privileged and unwanted system calls.
Containers
Containers are the smallest level of abstraction for running any workload in modern infrastructure. Below are a few methods to secure our containers, and we have also seen above how to integrate them into our CI/CD pipeline.
- Scan the Container image and Dockerfile.
- Reduce the Docker image size with a multi-stage build and use a distroless image to reduce the attack surface.
- Don’t use the root user and privileged containers.
- Have Gvisor and Kata containers for kernel isolation.
- Use container image signing and verification.
- Set up a list of known good containers registry.
- Implement the container security best practices.
Software Supply Chain Security
Supply chain security is crucial to the overall security of a software product. An attacker who can control a step in the supply chain can alter the product for malicious intents that range from introducing backdoors in the source code to including vulnerable libraries in the final product.
- in-toto Specification
As per Anchore 2022 Software Supply Chain Security Report, 62% of Organizations Surveyed have been impacted by Software Supply Chain Attacks. Implementing DevSecOps CI/CD significantly reduces the supply chain attack as we scan all our software components like code, SBOM, containers, infrastructure, sign and verify containers, etc.
Center for Internet Security (CIS) Standards
CIS is a non-profit organization that provides the security standards benchmark to secure our infrastructure. One of the benefits of following the CIS benchmark is that it directly maps to several established standards guidelines, including the NIST Cybersecurity Framework (CSF), ISO 27000 series of standards, PCI DSS, HIPAA, and others. Also, the Level 2 CIS benchmark gives more security controls.
Vulnerability Assessment and Penetration Testing (VAPT)
VAPT is a security testing method used by organizations to test their applications, network, endpoint, and cloud. It can be performed by internal and external third-party vendors. Depending upon compliance and regulation and how risky the technology is, organizations do schedule VPAT scans quarterly, half-yearly, or annually.
Vulnerability Assessment
A Vulnerability Assessment (VA) is a security process to identify weaknesses or vulnerabilities in an application, system, or network. A vulnerability assessment aims to determine all vulnerabilities and help the operator fix them. DAST scanning is also part of vulnerability assessment, and it’s often quick, ranging from 10 minutes to 48 hours, depending on the configuration. It is easier to integrate with our CI/CD pipeline, whereas pen testing goes beyond VA and has aggressive scanning and exploitation after discovering any vulnerabilities.
Penetration Testing
Pen testing is a proactive cybersecurity practice where security experts target individual components or whole applications to find vulnerabilities that can be exploited to compromise the application and data. ZAP, Metasploit, and Burp Suite can be used for pen tests and to discover vulnerabilities that might be missed by SAST and DAST tools. The downside of a pen test is that it takes more time, depending on the coverage and configuration. The proper pen test might take up to several weeks, and with DevOps development speed, it becomes unsustainable. However, it’s still worth adding Internal VAPT, which can be done on every feature release to move fast. External VAPT can be done biannually or annually to keep overall security in check.
Conclusion
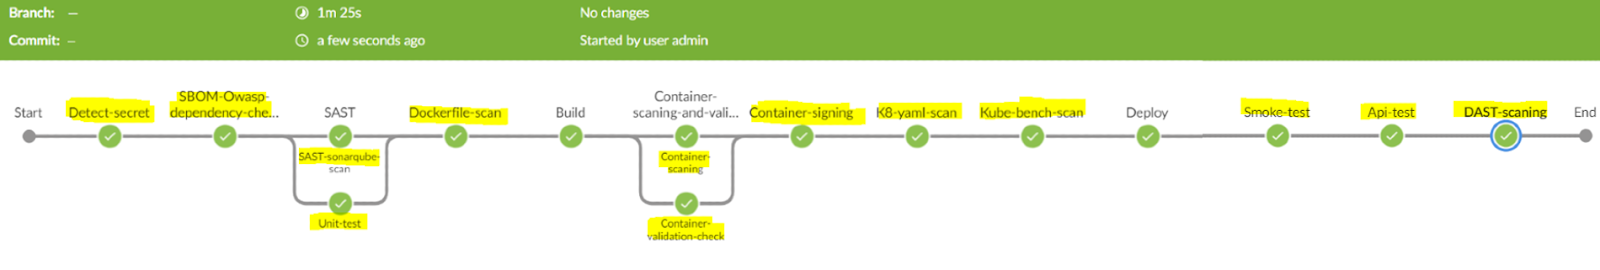
To quickly recap what we have done to make the DevSecOps pipeline, we scanned for secrets, SAST, and SBOM to find any vulnerabilities in our code. After that, we scanned our Dockerfile, container image, Kubernetes manifest, and did a container validation test, and signed our container image to ensure it was safe and secure. After deployment, we did Smoke, API test, and DAST scanning to ensure there is no bug in deployment. Always remember security requires constant attention and improvement. However, these can be the first few steps on the never-ending journey toward DevSecOps.
Implementing DevSecOps best practices reduces the risk of vulnerabilities and hacking. Scanning all parts of your infrastructure and application gives full visibility of potential threats and possible ways to remediate them. “The only way to do security right is to have multiple layers of security,” hence we talked about multiple methods and tools that can be used for finding vulnerabilities.
Here is a list of a few tools we have used to set up our DevSecOps pipeline.
| Category | Tools |
|---|---|
| Threat modeling | Threat dragon, Cairis |
| Secret scan | detect-secret, Gitleaks, git-secrets |
| SBOM scan | Syft, Grype, Trivy, Dependency-check, Dependency-track |
| SAST scan | SonarQube, Checkmarx, Veracode, Klocwork |
| Unit testing | JaCoCo, Mocha, Jasmine |
| Dockerfile scan | Checkov, docker scan |
| Container scan | Trivy, Grype, Clair, docker scan, Aqua scan |
| Container signing | Cosign, Skopeo |
| Container validation | goss, kgoss |
| Kubernetes manifest scan | Checkov, Terrascan, KubeLinter |
| Kubernetes manifest pre-check | Kyverno, Kubewarden, Gatekeeper |
| CIS scan | kube-bench, CIS-CAT Pro, Prowler |
| IaC scan | Checkov, Terrascan, KICS, Terratest |
| API testing | JMeter, Taurus, Postman, SoapUI |
| DAST scan | ZAP, HCL Appscan, Burp Suite, Invicti, Checkmarx, InsightAppSec |
| Distributed tracing | Zipkin, Jaeger |
| Cloud-native runtime security | Falco, Tetragon, Kubearmor, Tracee |
| Service mesh | Istio, Linkerd, Cilium, Traefik |
| Network security scan | Nmap, Wireshark, tcpdump, OpenVAS, Metasploit |
| Antivirus scan | Falcon, SentinelOne, Clamav |
| OS vulnerability scan | OpenVAS, Nessus, Nexpose |
| OS patching | Foreman, Red Hat Satellite, Uyuni |
| Pen testing | ZAP, Metasploit, Burp Suite |
I hope the article was informative and you enjoyed reading it.
Recommend
About Joyk
Aggregate valuable and interesting links.
Joyk means Joy of geeK