

Building a Data Warehouse using Google BigQuery
source link: https://www.analyticsvidhya.com/blog/2022/10/building-a-data-warehouse-using-google-bigquery/
Go to the source link to view the article. You can view the picture content, updated content and better typesetting reading experience. If the link is broken, please click the button below to view the snapshot at that time.

This article was published as a part of the Data Science Blogathon.
Introduction
Like many marketers, I’m sure your marketing data comes from multiple platforms, and you must juggle a mix of classified data to analyze and understand your customer journey. Pretty annoying, isn’t it?
.png)
Classified data from different sources rarely communicate with each other, complicating the interpretation of KPIs and important metrics. Ultimately, it leads to situations where you don’t know how to decide.
Therefore, more than ever, you need to be in control of data and collect it in one place. Generally, the main solution is to use tables, but tables cannot handle large datasets. This is where a data warehouse like BigQuery becomes interesting.
What is BigQuery?
It is a data warehouse from the GCP that helps you store, visualize, analyze and process your data. You can directly upload all your data in real-time from different sources: Google Analytics, CRM, Google Sheets, Google Ads, Google Optimize, and Facebook Ads…
As for the price, the model is quite simple. You will pay both storage and handling costs. Storage costs depend only on the volume of data stored. For processing, you will pay for data querying, data storage, and streaming inserts. Loading data is free.
It provides free tiers for storage (10 Gb) and processing (1 TB). You only pay above these limits. For more pricing information, see the BigQuery pricing overview.
Advantages of Google BigQuery
Google BigQuery is scalable and fast, allowing you to focus only on analyzing your data and enabling large-scale analytics. Because it is connected to intelligence tools like Data Studio, it helps you easily visualize your data in a clear and centralized overview to get clear information about the customer journey and predictions about your clients, for example.
BigQuery ML lets you build and run machine learning models in the data warehouse. You can create, K-means clusters, regression models decision trees, or time series by asking “CREATE model.” It saves time and makes it easy to manage data and models simultaneously.
BigQuery alternatives
BigQuery is not only a data warehouse. Microsoft (Microsoft Azure Synapse Analytics) & Amazon (Amazon Redshift) offer similar services.
We can use BigQuery or another service. It will be a choice based on your project: data type and structure, purpose can be (machine learning), or endpoint (dashboarding, data platform). But also the current stack of technologies: are you already using GCP or Google data such as GA 4.
Why use Google BigQuery?
The main question is: why should marketers start storing their data in the cloud, and how to use it?
Unlimited and historical data: Unlike spreadsheets, you can use BigQuery to collect all marketing data from all platforms in one place, giving you a single source of truth about your performance. It will limit and simplify your data operations. Plus, you have access to all your historical data.
Fast and accessible insights: BigQuery uses the SQL (Structured Query Language) request dialect to help you put your data to work in minutes. This allows you to get results fast and get insights in real time.
Granularity and visualization: You can analyze your events at a detailed level by uploading Google Analytics data. Example, We can define the most common paths to your users’ page and see the difference between buyers and visitors. You can dive into your data, which is impossible in the native interface. Linking with Data studio will also make your data more visual.
When NOT to use Google Bigquery?
If your project does not match the Big Data 3 Vs.: if your data is not large in volume (Size), does not require speed (Execution speed), or is not diverse enough, you may find other solutions within the Google Cloud Platform that best suit our needs ( for example Google Sheets or Google SQL).
Remember that Google is an American company: it has no GDPR adequacy decisions from Europe and is not subject to Privacy Shield protection (repealed by the EU in July 2020). This means that uploading the personal data of EU citizens to Big Query without a data protection assessment should be considered a risk (while playing with big data, a privacy assessment is always a good, US company or not: I respect the privacy of my customers, I process sensitive data such as health/opinions/sexual orientation/… as I respect the right to be forgotten, etc.)
How to Start a Marketing Data Warehouse?
1) Define your goal: What do you want to use Bigquery for?
No, “I want everything” is not a good answer (remember you have to complete the data protection assessment, the purpose of the processing is the first chapter).
You really need to consider what you want to achieve and what value you want to unlock. It predicts your customer’s behavior (churn, acquisition,..), optimizes the behavior of website visitors, CRO, and information about a specific category, enriches your CRM with Analytics data (or vice versa), optimizes relevance, does marketing automation,… Describe exactly what you need to do, be very specific, and evaluate each purpose’s value (in terms of payback or time saved).
2) Make a plan
The second step is to map all your data needed to achieve this goal (automation tools, CRM, Ads platforms,…). Classify them as “need to have” and “nice to have.”
Focus on the must-haves and check if your data sources have a public API or if automatic data export is enabled. If it doesn’t, you’ll need to find another tool. In Marketing Data, Supermetrics extracts data from your marketing platforms and loads it into Big Query.
3) Data import and processing: in which order?
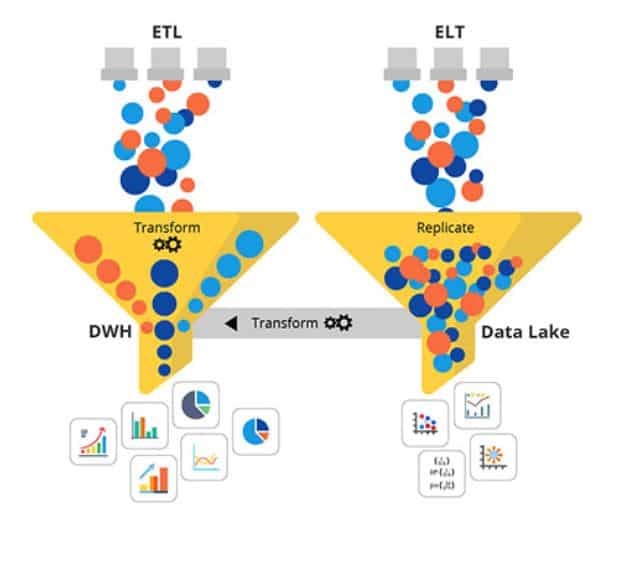
There are two main processing models:
ETL (Extract – Transform – Load): processing occurs during data import. If you want to enrich, merge, filter, or parse the naming convention,…. you can do this on import. You save on storage costs: you only store what you need. It also has GPDR-compliant benefits: data is often aggregated at this level, data is no longer personal…
ELT (Extract – Load – Transform): In this case, you can transfer data as it comes in and process it when needed. This is often the case in the IoT industry: data is coming in continuously, and you don’t have time to process and store it in the same process. You save first and then process.
BigQuery fits the ELT paradigm very well. Because BigQuery is highly scalable, you can handle huge transformations of large amounts of data. This is why Google Analytics 4 works best with BigQuery: the data flow into BigQuery, and then you can do the analysis. you will find instructions below about how to import GA4 data into BigQuery.
In the case of ELT, the transformation is done using SQL to BigQuery. You will find useful bigQuery query syntax documentation here. In short: it is very similar to “traditional” SQL, with additional concepts such as “nesting”: a table can be inserted (“nested”) into another table. This means you must “un-nest” before using the nested data in the record.
If you know SQL, you will also need to look at the schema, especially the partitioning part. The way you organize your data is very important: remember that you pay for the amount of data processed if you tell BigQuery how to organize (“split”) your data (per day, per site, ..), BigQuery will process only the data it needs and charge you less.
4) Visualize
Once your query is prepared and optimized, you will need to visualize the results somewhere. There’s no shame in using Google Sheets to run “last mile” analytics. Tables have built-in connectors (Data -> Data Connectors -> Connect to BigQuery). Search for BigQuery in the connectors. Choose your project – table and enjoy the whole GA4 scheme.
Other visualization tools like PowerBI or Tableau can also connect to BigQuery.
Google BigQuery Use Case: A Process Mining Approach to the Consumer Journey
At Clicktrust, BigQuery allows us to think of the consumer journey as a process. We design the steps a consumer should take, from product discovery to purchase, that define the completion of the process.
We collect and store “events,” analyze process performance, a bit like a supply chain company:
• Determining the process: what is the order and importance of each step? How users use our website (which pages, what they are looking for,..), where they come from, and which “path” converts better, …
• Conformity check: is my mental model consistent with reality? Are “awareness” and “conversion” landing pages accomplishing their tasks?
• Performance: what are the bottlenecks where people stop their journey, and what elements drive conversions at the user level…
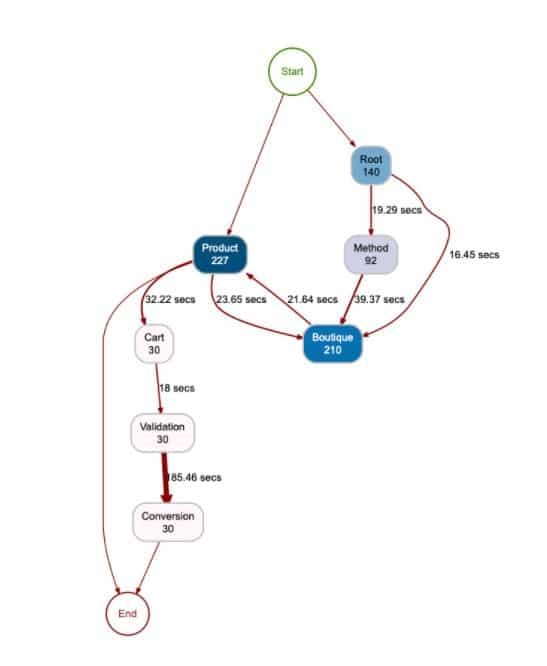
Conversion Flow – Performance (Process Mining Framework)
To achieve this, we can add different layers:
• Google Analytics 4 data – square stone. With GA4, you’ll benefit from the user and log-level data. You can optionally enter a “Customer/CRM ID,” which will be visible as a “User ID” in BigQuery. Therefore, it will be available to connect to offline or CRM data, and then you will have a complete overview of who came to the site, started which events, and bought which product.
• E-commerce: If you run an e-commerce store that uses Shopify, list “orders,” “transactions,” and “customers” to see churn or LTV through reports. You can segment your customers and group them to reach them with the right promotion at the right moment. You can also analyze other data sources to get clear insights about your key metrics and how they relate to other dimensions (LTV by age/source/product/campaign/location).
• Mailing: To who did you send your offers? Did they click? This is also the first block of marketing automation: your data flows to the same place: set rules and run
• The more internal resources you add, the more comprehensive your view of customers will be. Finally, you’ve got a “golden record” of your customers: every interaction is stored in the same place and accessible in the same process. Adding individual paid media data is irritating and brings unnecessary GDPR risks. However, you can still perform SEA – SEO optimization anonymously: are your visitors using SEA and SEO keywords similarly? BigQuery allows you to merge SEA and SEO keywords daily by device and page.
Conclusion
In conclusion, BigQuery (or any other data warehouse) can help you gain an edge over your competitors by enabling detailed and in-depth analysis. With ITP, IOS 14, the death of cookies… Today it is more than necessary to find alternatives to continue to understand your customers’ needs and ensure that they continue to meet the needs of your business.
- BigQuery is not only a data warehouse. Microsoft (Microsoft Azure Synapse Analytics) & Amazon (Amazon Redshift) offer similar services.
- BigQuery fits the ELT paradigm very well. Because BigQuery is highly scalable, you can handle huge transformations of large amounts of data. This is why Google Analytics 4 works best with BigQuery: the data flow into BigQuery.
- In ELT, the transformation is done using SQL to BigQuery. You will find useful bigQuery query syntax documentation here. In short: it is very similar to “traditional” SQL, with additional concepts such as “nesting”.
The media shown in this article is not owned by Analytics Vidhya and is used at the Author’s discretion.
Related
Recommend
About Joyk
Aggregate valuable and interesting links.
Joyk means Joy of geeK