
3

Figures for Dark Mode
source link: https://blogs.mathworks.com/pick/2022/10/19/figures-for-dark-mode/
Go to the source link to view the article. You can view the picture content, updated content and better typesetting reading experience. If the link is broken, please click the button below to view the snapshot at that time.

Figures for Dark Mode
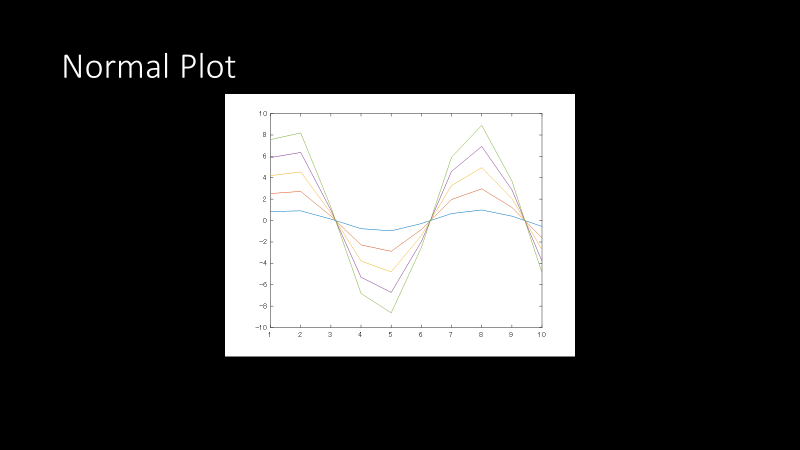
Do you work in dark mode? If you do, you need to take a look at this entry by Natan, especially if you make presentations using the dark theme. As you know, standard plots in MATLAB are created with white background.
figure
plot((1:2:9).*sin((1:10)'))

If we copy and paste this into a dark theme presentation, it's probably not what you want.
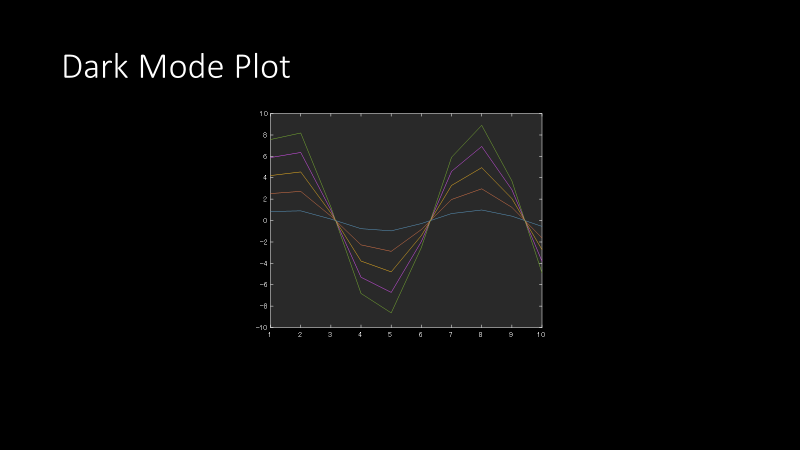
Just run plot_darkmode and it does the appropriate color conversions. The background is set to a dark theme, the text and axes colors are set to white, and the line colors are adjusted accordingly.
plot_darkmode

Copy and paste into a slide, and voila!
It's also worth noting that the line colors are adjusted so that they are appropriately visible in dark mode. For instance, let's create a plot with two lines, a black line and a dark red line.
plot(rand(5,1),"k","LineWidth",2) % black line
hold on
plot(rand(5,1),"Color",[.5 0 0],"LineWidth",2) % dark red line
hold off
legend("Data 1", "Data 2")

You can imagine that simply setting the background to a dark theme will not work. Both lines will be hardly visible. When we run plot_darkmode, you can see that the line colors are adjusted appropriately.
plot_darkmode

Comments
Very nice entry, Natan!
Give this a try and let us know what you think here.
Recommend
About Joyk
Aggregate valuable and interesting links.
Joyk means Joy of geeK