
0

prometheus 监控 mysql
source link: https://www.jansora.com/notebook/107564
Go to the source link to view the article. You can view the picture content, updated content and better typesetting reading experience. If the link is broken, please click the button below to view the snapshot at that time.

部署 mysqld-exporter
采用 docker 来部署 prom/mysqld-exporter
1. 拉取镜像
docker pull prom/mysqld-exporter
# docker pull prom/mysqld-exporter
Using default tag: latest
latest: Pulling from prom/mysqld-exporter
aa2a8d90b84c: Pull complete
b45d31ee2d7f: Pull complete
e65c338b31c3: Pull complete
Digest: sha256:a8af600c3ef1c8df179b736b94d04dc5ec209be88407a4c1c1bd0fc6394f56e8
Status: Downloaded newer image for prom/mysqld-exporter:latest
docker.io/prom/mysqld-exporter:lates
docker run -d --name=mysqld-exporter -p 9104:9104 -e DATA_SOURCE_NAME=root:password@(mysql:3306)/database prom/mysqld-exporter
- 检测运行状态
curl localhost:9104/metrics
正常会输出一下结果
root@l1:~# curl localhost:9104/metrics
# HELP go_gc_duration_seconds A summary of the pause duration of garbage collection cycles.
# TYPE go_gc_duration_seconds summary
go_gc_duration_seconds{quantile="0"} 0
go_gc_duration_seconds{quantile="0.25"} 0
go_gc_duration_seconds{quantile="0.5"} 0
go_gc_duration_seconds{quantile="0.75"} 0
go_gc_duration_seconds{quantile="1"} 0
go_gc_duration_seconds_sum 0
go_gc_duration_seconds_count 0
配置 prometheus 抓取 mysql
在/etc/prometheus/prometheus.yml文件中 [scrape_configs] 加入以下配置才会加入到监控中。
scrape_configs:
  # The job name is added as a label `job=<job_name>` to any timeseries scraped from this config.
  - job_name: mysqld-exporter
    static_configs:
      - targets:  ['localhost:9104']
    scrape_interval: 5s
    scrape_timeout: 5s
配置 grafana
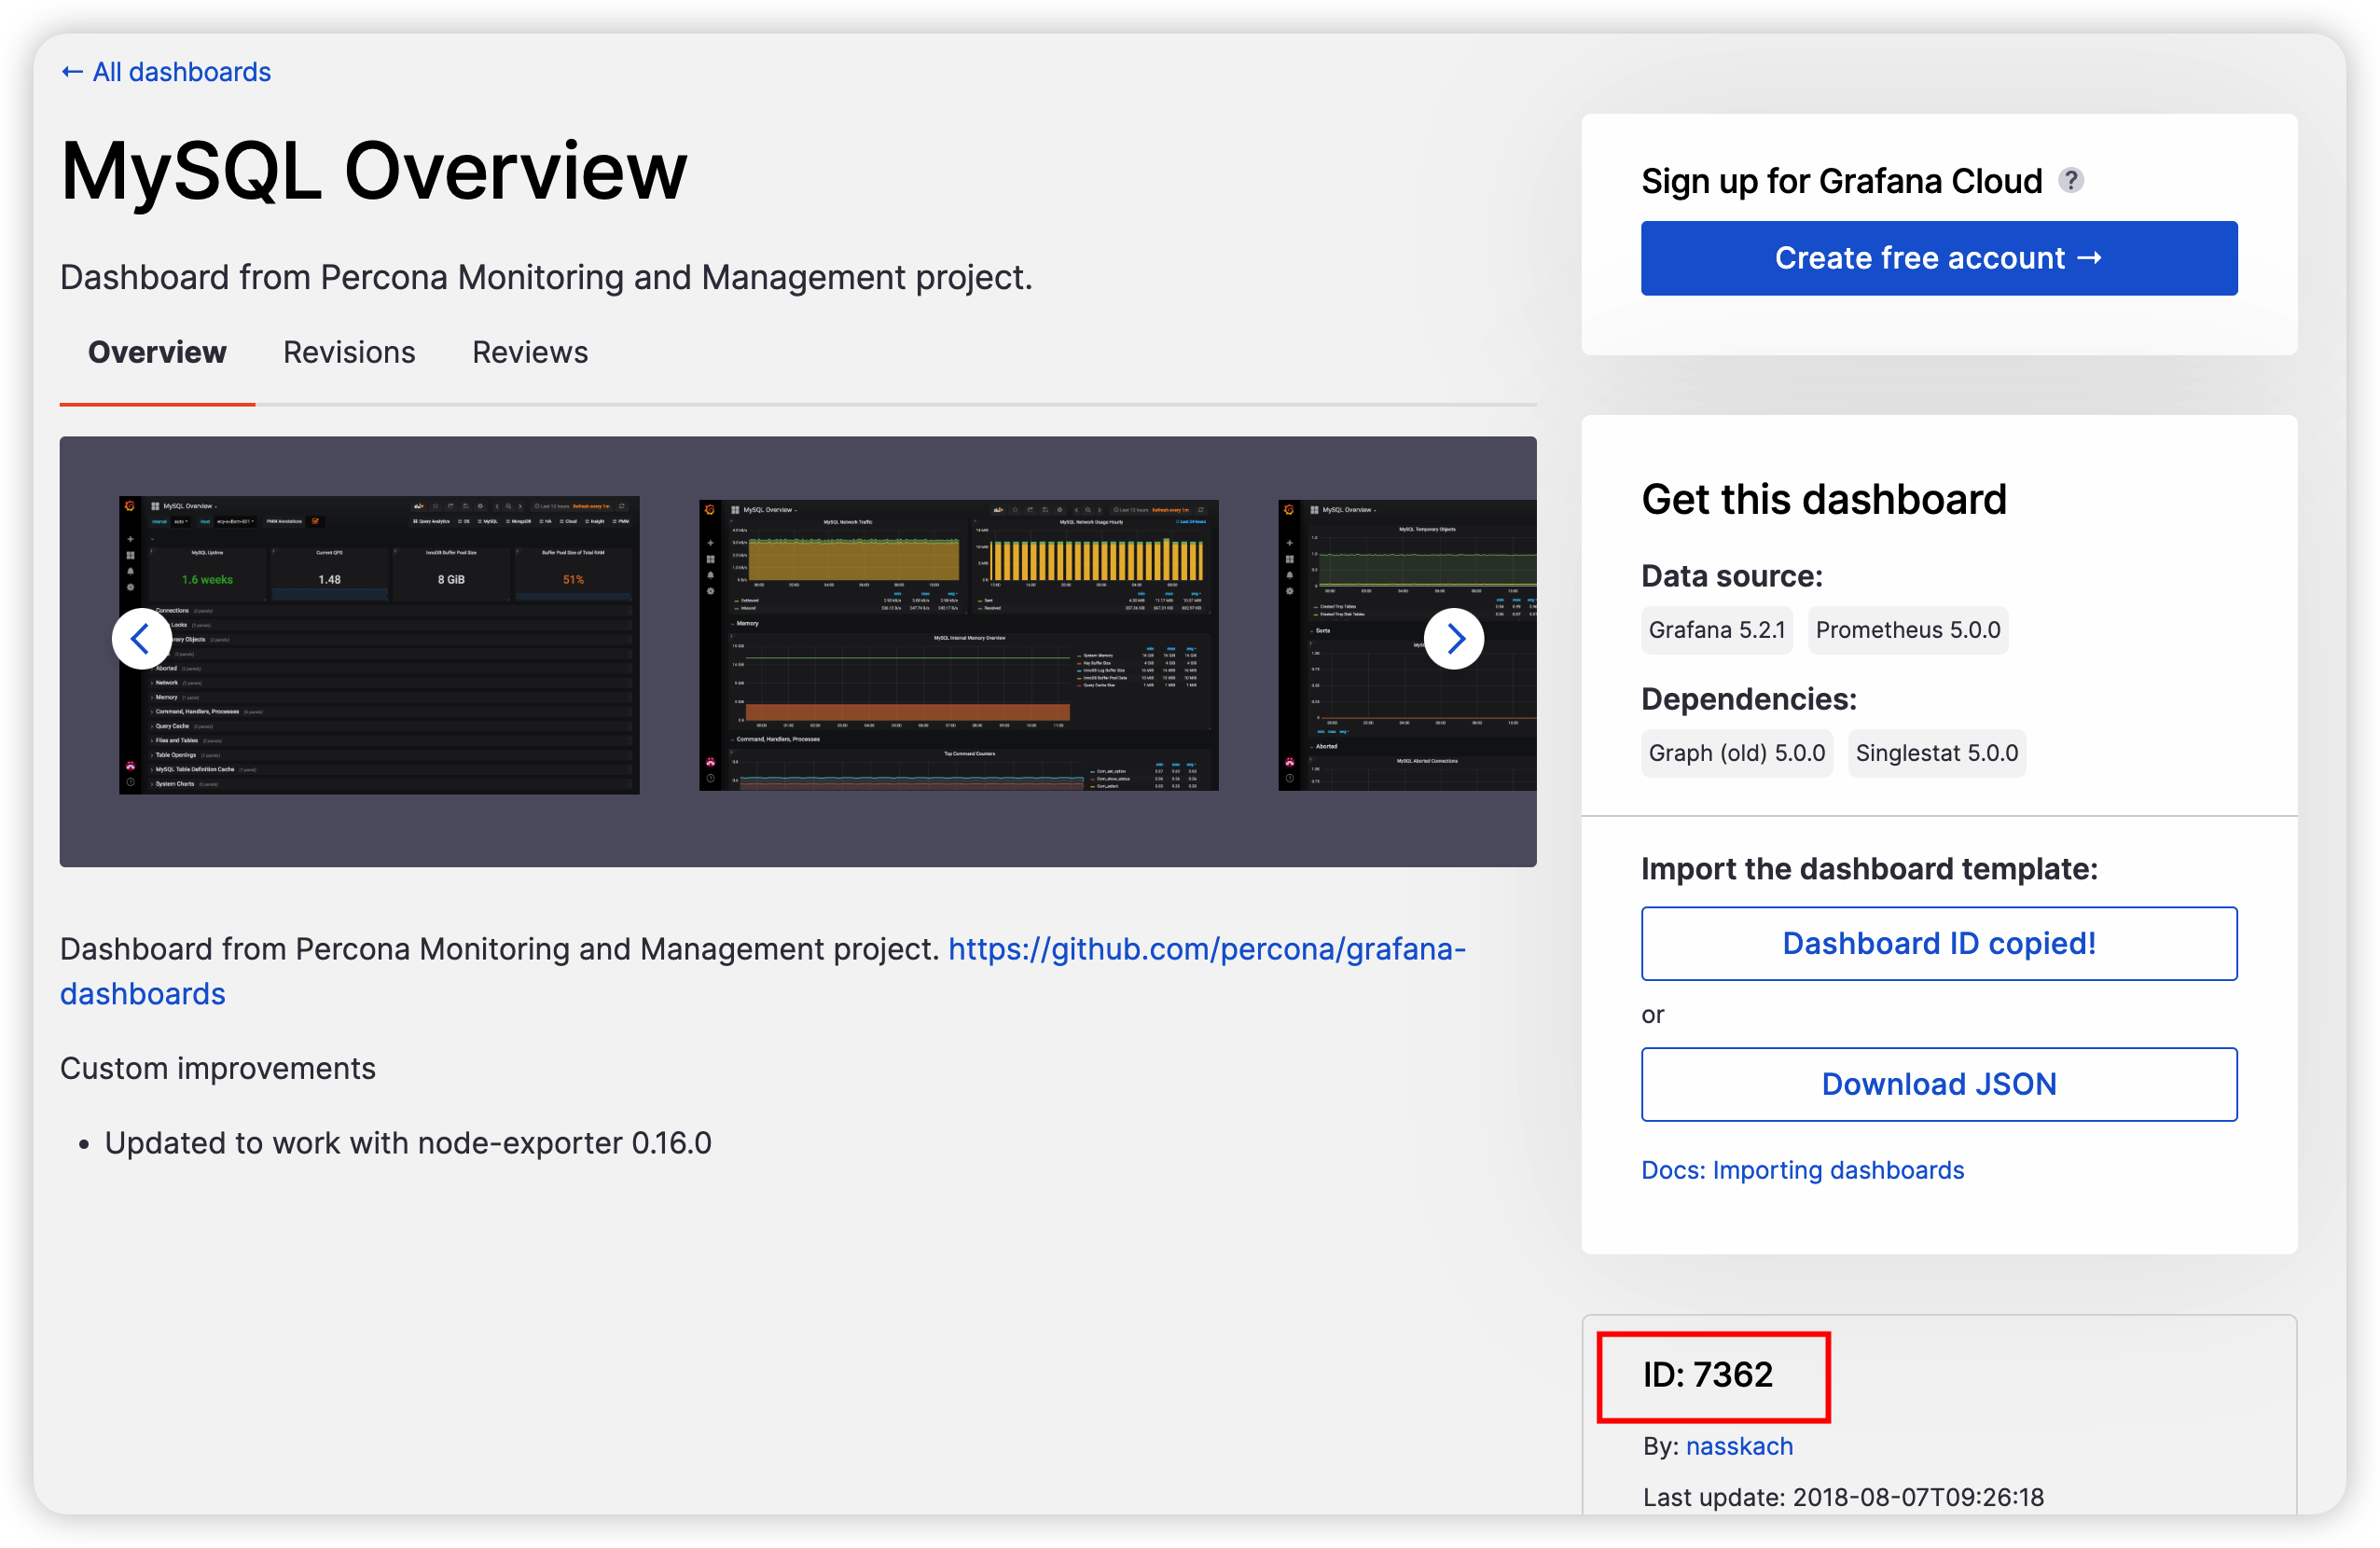
在浏览器中进入 Grafana仪表盘模板网站,搜索MySQL。
找到比如 7362
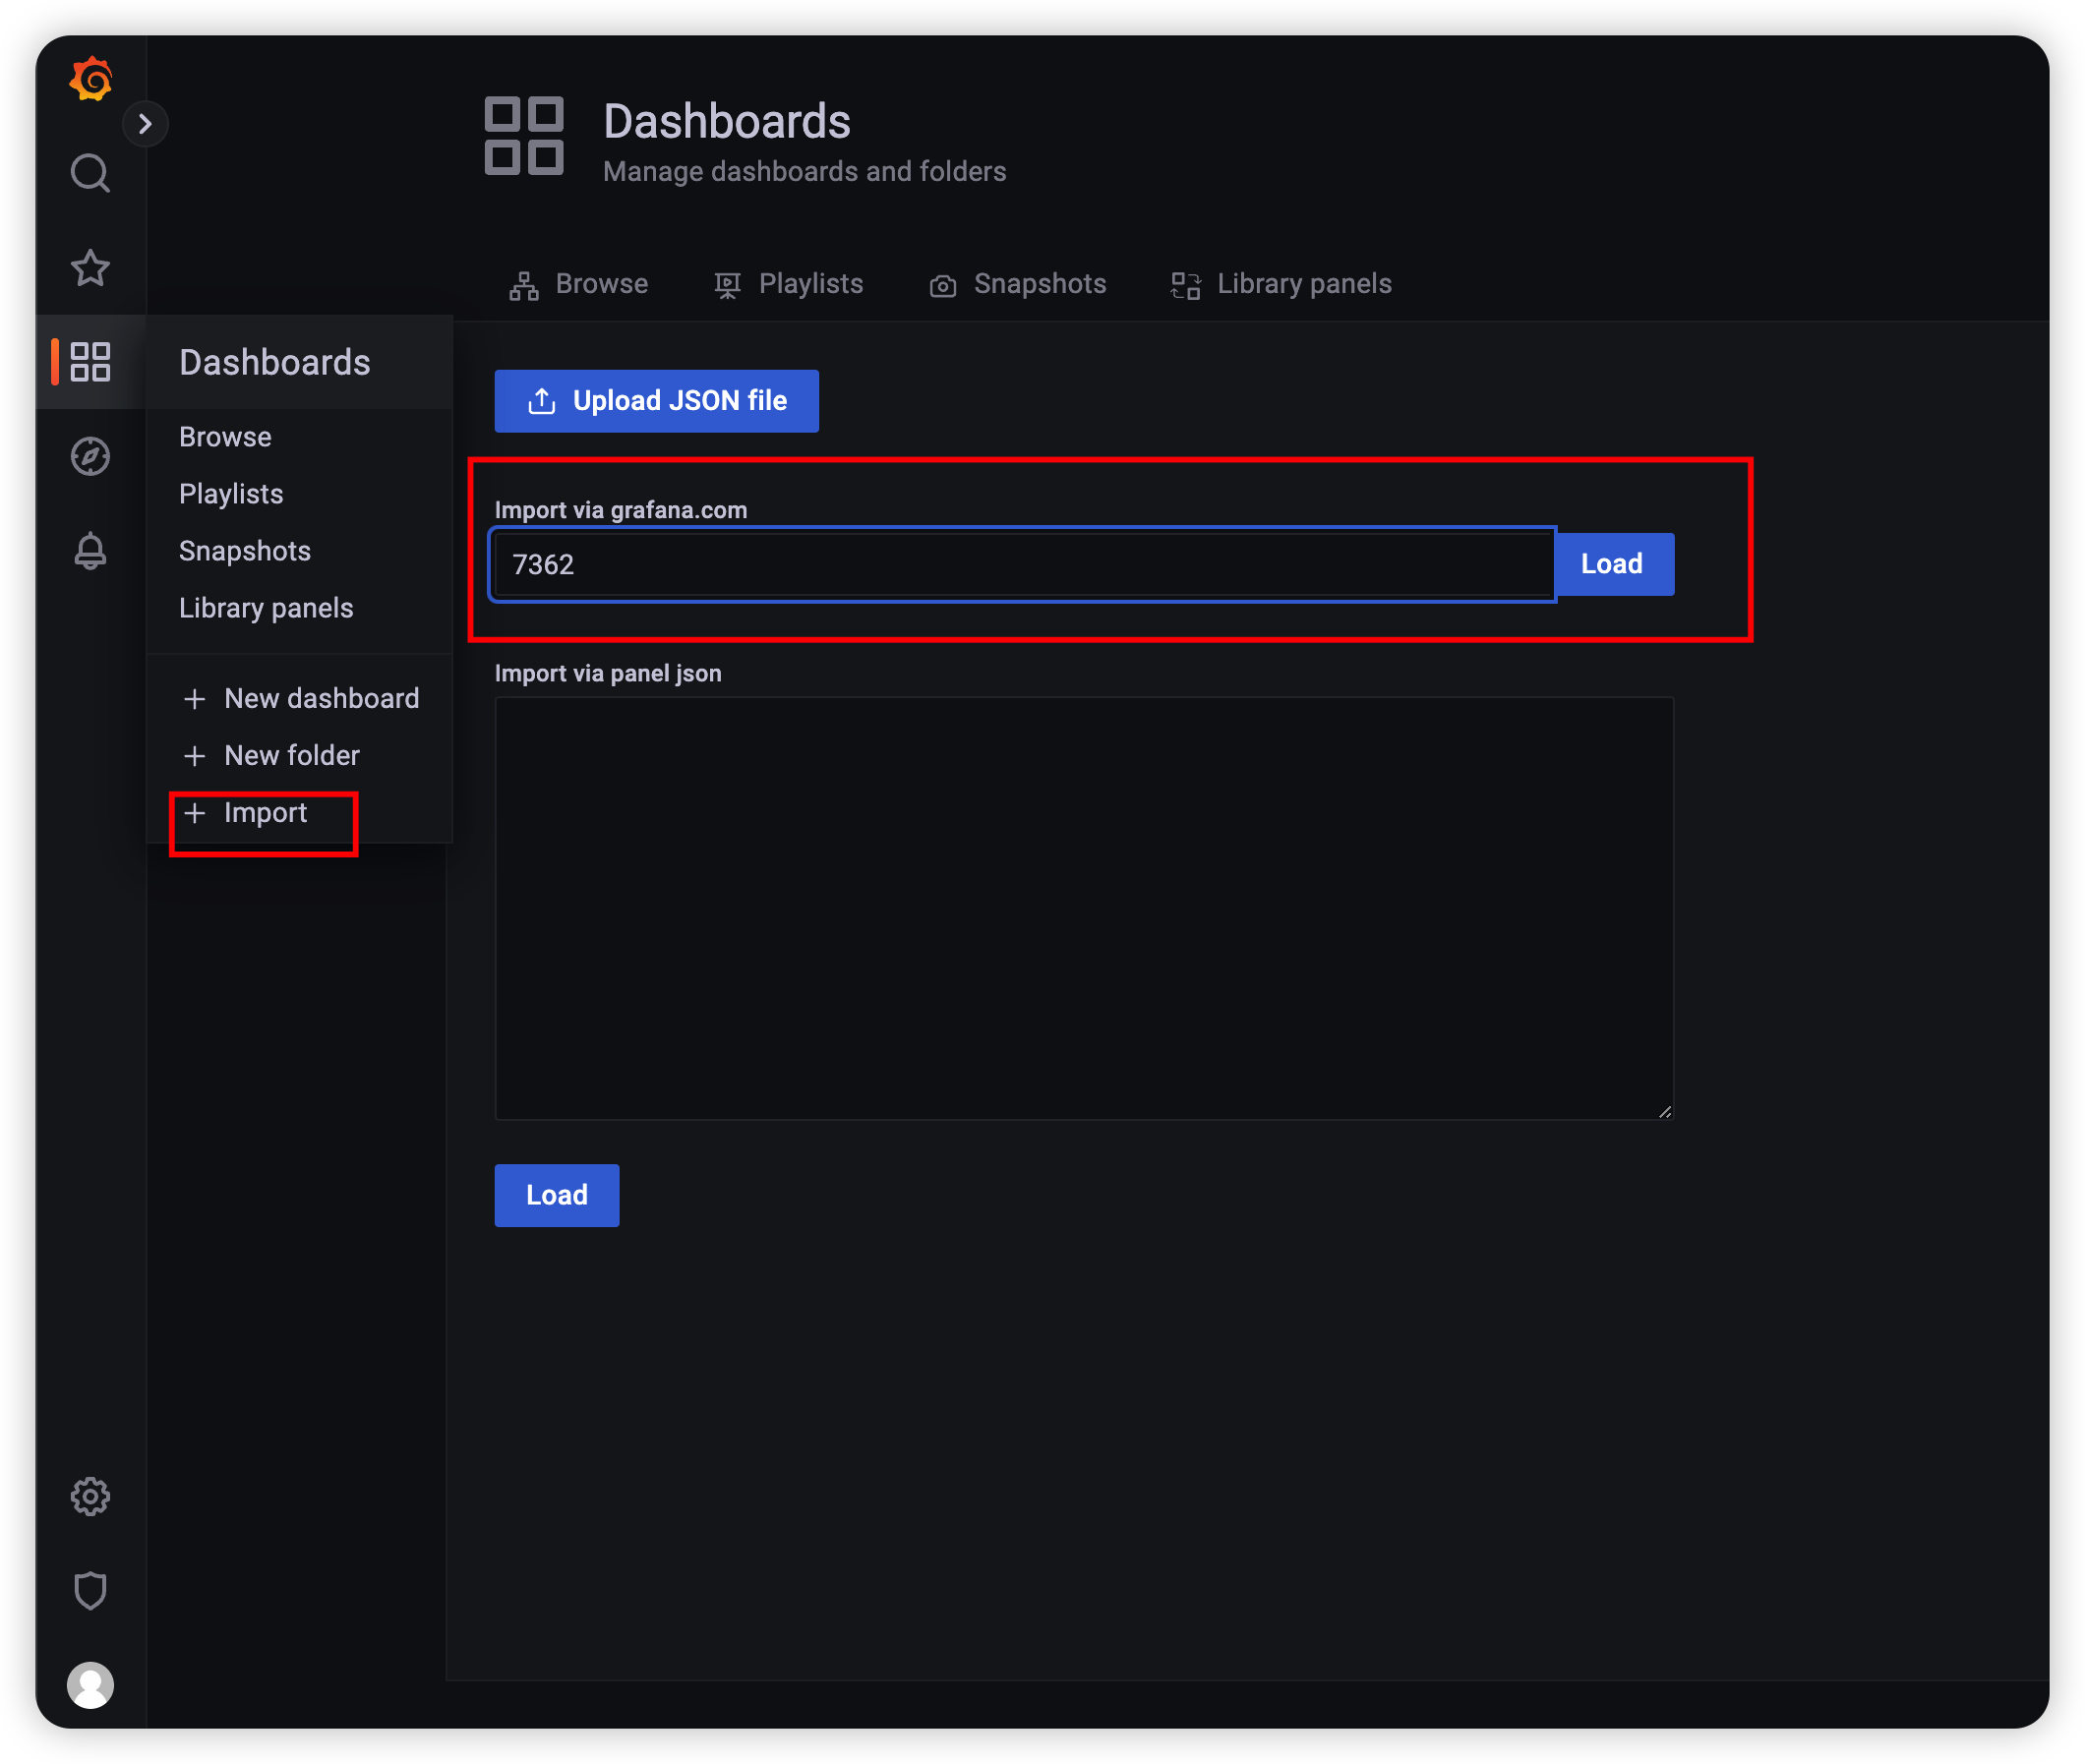
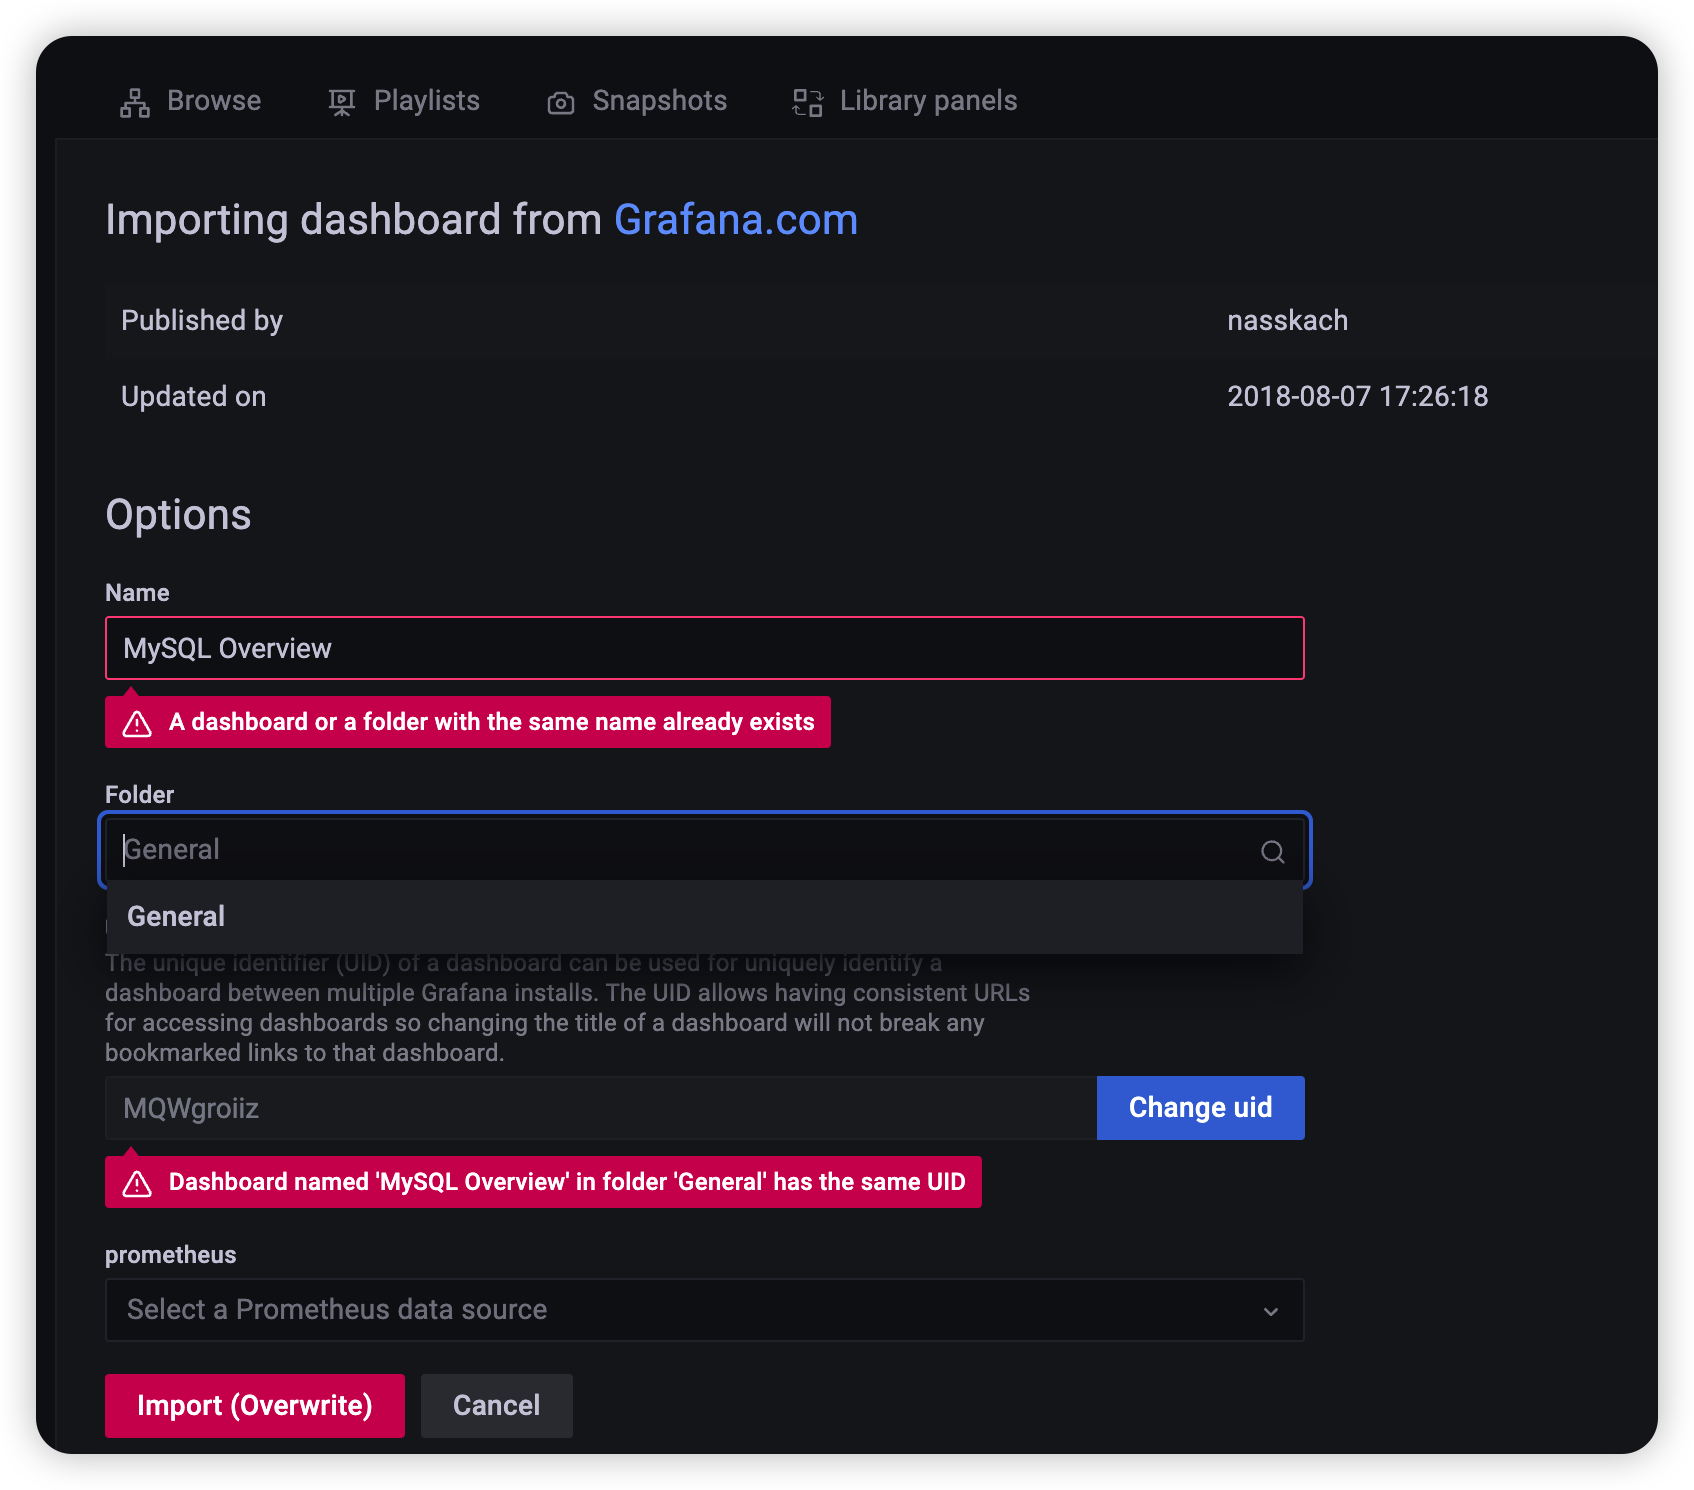
通过 id 导入 dashboard
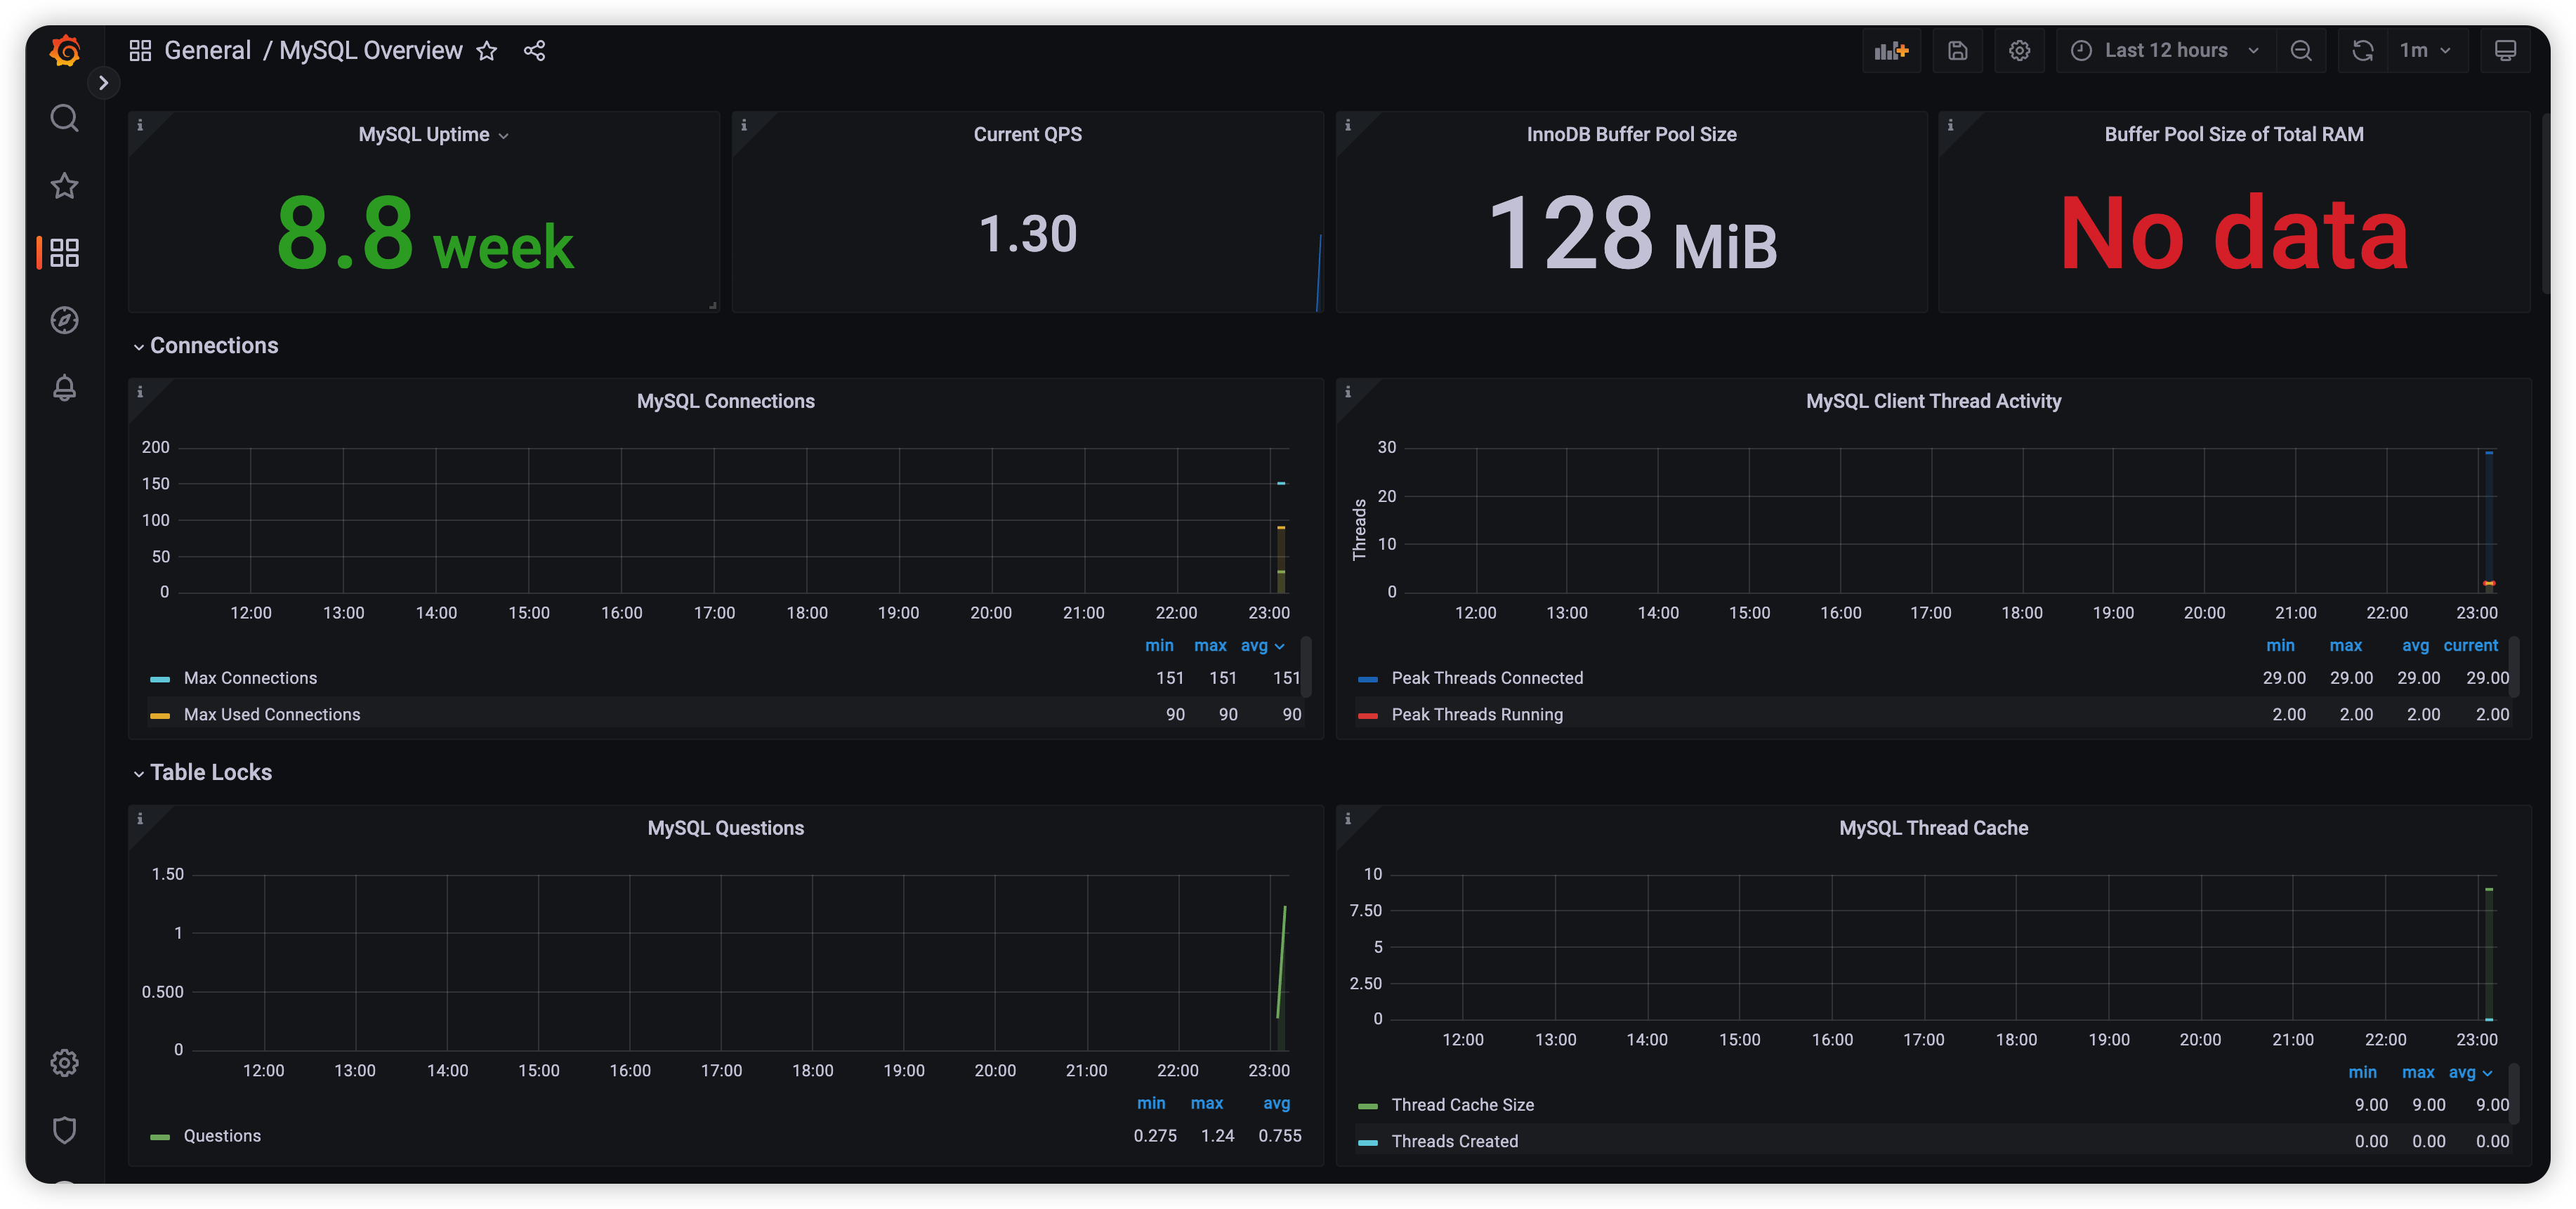
导入成功
Recommend
About Joyk
Aggregate valuable and interesting links.
Joyk means Joy of geeK