The federal government released a set of tools to help cities, businesses, and residents understand the risks from climate change and plan for the future.
It’s been a summer of climate disasters in the U.S.: Brutal heat waves from California to Texas. Catastrophic flooding in Kentucky and Missouri. Wildfires in Alaska that burned an area larger than Connecticut, and, across the rest of the U.S., hundreds of other fires burning now. Droughts that have affected more than half the country.
[Image: CMRA]A
new set of tools from the federal government, built by the mapping company Esri, maps out climate impacts in real-time, and also shows what’s coming as the climate crisis intensifies. The new portal is designed to help cities, businesses, and residents better understand the risks “and give them tools so they can help prepare their communities and make them more resilient in the face of these severe stresses,” David Hayes, special assistant to the president for climate policy, said in a press conference announcing the new platform.
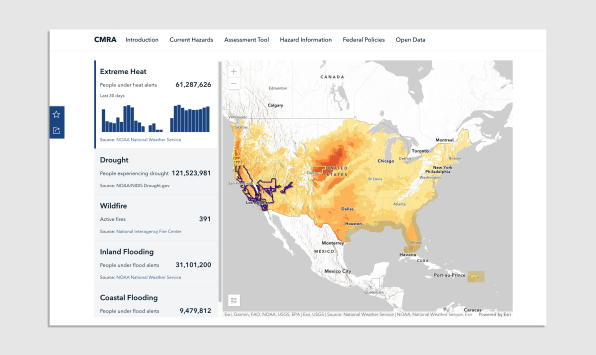
[Image: CMRA]One map shows current extreme heat, wildfires, droughts, plus inland and coastal flooding. If you type a city or address into a separate
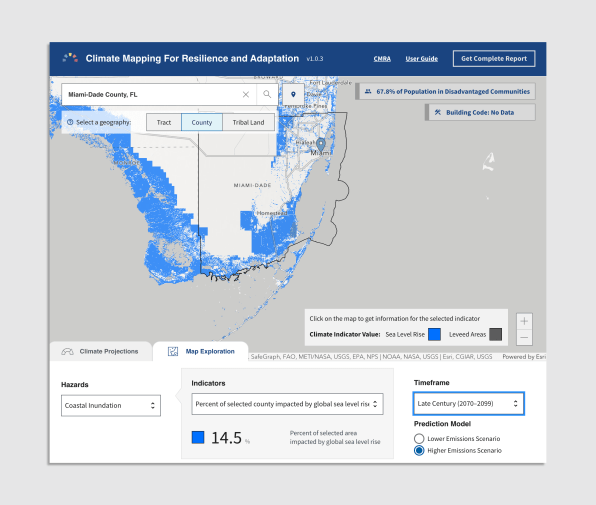
assessment tool on the site, it shows current risks by census tract, and then spells out future hazards under two scenarios: What happens if greenhouse gas emissions quickly drop, and what will happen if they remain high. In Miami, for example, a map shows how much more of the coastline will go underwater in a high-emissions scenario. The dashboard also shows how much extreme heat and other hazards are likely to increase in each scenario. The site also includes links to help cities find federal grants to build more resilient infrastructure.
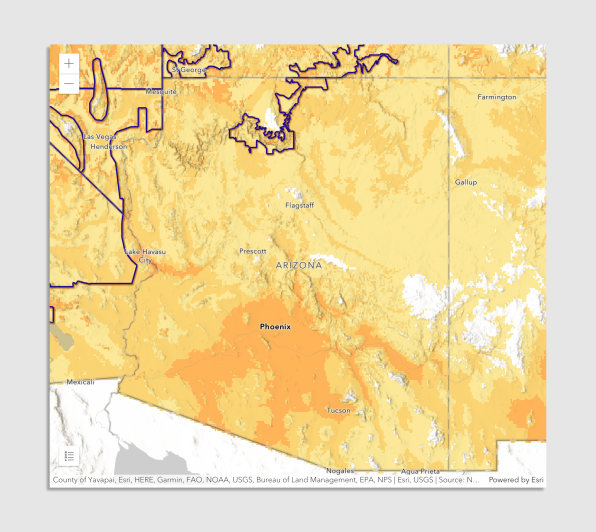
[Image: CMRA]“We are spending tens of millions of dollars on climate resilience and investments that are related, and this tool will help me understand where are the most effective places to put those dollars,” Phoenix Mayor Kate Gallego said at the press conference. Phoenix is one of the first cities to have a
chief heat officer, something that other cities are likely to follow. “How can I help the most people in my community? Do we need to be investing in cool corridors and tree planting? Where is the best place to help those who are most vulnerable to climate change?” The site maps out where disadvantaged communities may be most at risk.
[Image: CMRA]The tools make it clear that we aren’t prepared for the climate disasters happening now—but we also aren’t living with a “new normal” since the impacts are on track to get even worse without radical cuts in emissions. Large fires in the West could be
six times more likely by the middle of the century.