

Integrating de novo and inherited variants in 42,607 autism cases identifies mut...
source link: https://www.nature.com/articles/s41588-022-01148-2
Go to the source link to view the article. You can view the picture content, updated content and better typesetting reading experience. If the link is broken, please click the button below to view the snapshot at that time.

Integrating de novo and inherited variants in 42,607 autism cases identifies mutations in new moderate-risk genes
Many previous genetic studies in autism spectrum disorder (ASD), a neurodevelopmental condition characterized by social communication difficulties and repetitive behaviors1, focused on de novo variants (DNVs) identified from parent–offspring trios2,3,4,5,6,7,8. Over 100 high-confidence ASD genes enriched with likely deleterious DNVs have been identified8, most of which are also enriched for DNVs in other neurodevelopmental disorders (NDDs)9,10,11. Statistical modeling suggests that there are ~1,000 genes with DNVs in ASD12,13. However, despite the large effect size of individual pathogenic DNVs, all DNVs combined explain only ~2% of variance in liability for ASD8,14. ASD is highly heritable14,15,16, and previous studies estimated that common variants explain up to half of the heritability14, although only five genome-wide significant loci have been identified17. Rare LoF variants in genes intolerant of variation9,18 are overtransmitted to probands compared with siblings without ASD7,8,19,20,21,22. However, identification of the individual risk genes enriched by such inherited variants has remained elusive. We have established the largest ASD cohort, Simons Foundation Powering Autism Research for Knowledge (SPARK)23, which currently includes over 100,000 people with ASD, to advance research on the genetic, behavioral and clinical features associated with ASD.
Rare LoF variants are enriched in developmental disorders including ASD22,24, but may also result from sequencing and annotation artifacts25 and present technical challenges in large sequencing studies. Methods to distinguish between high-confidence and low-confidence LoF variants18,26,27 have been used to quantify gene-level LoF intolerance18,26,28,29 and to refine the role of LoF DNVs in NDDs20.
Here, we present an integrated analysis of de novo and inherited coding variants in over 42,607 ASD cases, including cases from previously published ASD cohorts and 35,130 new cases from SPARK. In our two-stage design, we first characterized the contribution of DNVs and rare inherited LoF variants to ASD risk. Results from the first stage informed the second stage meta-analysis of 404 genes. By combining evidence from DNVs, transmission disequilibrium tests (TDTs) and case-control comparisons, we identified 60 ASD risk genes with exome-wide significance, including five new genes not previously implicated in NDDs. Finally, we estimated the effect sizes of known and newly identified genes and conducted power calculations to inform the design of future studies.
Results
Overview of data and workflow
We aggregated exome or whole genome sequencing (WGS) data of 35,130 new cases from SPARK and 7,665 cases from published ASD studies (ASC3,8, MSSNG6 and SSC2,30) (Supplementary Table 1) and performed a two-stage analysis (Fig. 1). In stage 1, we analyzed DNVs in 16,877 ASD trios and assessed transmission of rare LoF variants from 20,491 parents without ASD diagnoses or intellectual disability to offspring with ASD (including 9,504 trios and 2,966 single-parent-proband duos). For DNVs, we characterized the enrichment pattern in known and candidate risk genes, as well as mutation intolerance (probability of being LoF intolerant as defined by the Exome Aggregation Consortium (ExAC pLI)18, and Genome Aggregation Database (gnomAD) metrics26), and performed gene-based burden tests of LoF and missense DNVs by DeNovoWEST11. For rare inherited LoFs, we estimated the overtransmission from unaffected parents to ASD offspring in all genes and gene sets predefined by functional genomic data or results from DNV analysis. Based on DNV enrichment and overtransmission patterns in gene sets, we selected 404 genes for meta-analysis in stage 2 using 22,764 new cases with exome or WGS data. In stage 2, we applied DeNovoWEST on DNVs, conducted TDTs on inherited LoFs in trios or duos, performed burden tests on rare LoFs in unrelated cases compared with population controls (104,068 subjects from non-neuro gnomAD exomes and 132,345 TOPMed subjects) and combined the P values to estimate a final P value for each of the 404 genes. Finally, we performed a mega-analysis of rare LoFs in all cases and controls to estimate the effect sizes of known or new candidate ASD genes to inform future studies.
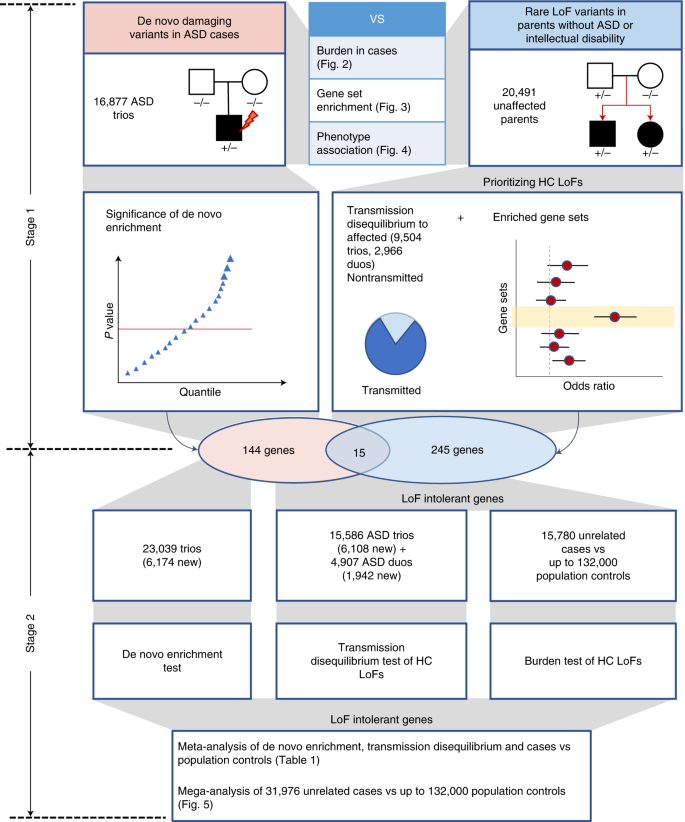
In the discovery stage, we identified DNVs in 16,877 ASD trios and rare LoF variants in 20,491 parents without ASD diagnoses and intellectual disability. We compared properties of de novo and rare variants to identify rare LoFs that contribute to genetic risk in individuals with ASD. We also evaluated their associations with cognitive impairment and enriched gene sets. We performed an initial exome-wide scan of genes enriched by DNVs or showing transmission disequilibrium of rare LoFs to affected offspring and selected a total of 404 genes for further replication, including 159 de novo enriched genes and 260 prioritized transmission disequilibrium genes from enriched gene sets (15 genes were in both). In the meta-analysis stage, we first evaluated evidence from de novo enrichment and transmission disequilibrium of rare inherited LoFs in an expanded set of family-based samples including over 6,000 additional ASD trios and around 2,000 additional duos. The DNVs in ASD were combined with those from an additional 31,565 NDD trios to refine the filters of high-confidence LoF variants in de novo LoF enriched genes. We also constructed an independent dataset of LoF variants of unknown inheritance from 15,780 cases that were not used in de novo or transmission analysis. We compared LoF rates in cases with two population-based sets of controls (n = ~104,000 and ~132,000, respectively). For 367 LoF-intolerant genes on autosomes, the final gene-level evidence was obtained by meta-analyzing P values of de novo enrichment, transmission disequilibrium of high-confidence rare inherited LoFs, and comparison of high-confidence LoFs from cases and controls not used in the de novo or transmission analysis. We also performed a mega-analysis that analyzed high-confidence LoFs identified in all 31,976 unrelated ASD cases and compared their rates with population-based controls. HC, high-confidence.
Known ASD or NDD risk genes explain most de novo burden
In the first stage, we combined data from four large-scale ASD cohorts, including 16,877 unique ASD trios and 5,764 unaffected trios (Supplementary Table 1). The cohorts show similar exome-wide burden of DNVs in simplex families. The burden of LoF DNVs in cases with an ASD family history is significantly lower than those without (P = 1.1 × 10⁻⁴ by Poisson test), whereas the burden of predicted de novo damaging missense (D-mis, defined by rare exome variant ensemble learner (REVEL) score31 ≥ 0.5) and synonymous variants are similar (Extended Data Fig. 1). Compared with unaffected offspring, the excess of damaging DNVs (de novo LoF and D-mis variants) in individuals with ASD is concentrated in LoF-intolerant genes, defined as genes with an ExAC pLI ≥ 0.5 (ref. 18). Using LoF observed/expected upper-bound fraction (LOEUF), a recently developed gene constraint metric26, the burden of damaging DNVs is highest among genes ranked in the top 20% of LOEUF scores (Fig. 2a). Overall, the population attributable risk (PAR) from damaging DNVs is about 10%. We assembled 618 previously established dominant (‘known’) ASD or NDD risk genes (Supplementary Table 2). These genes explained about two-thirds of the PAR from damaging DNVs. Excluding these genes, the fold enrichment of damaging DNVs was greatly attenuated (Fig. 2a).
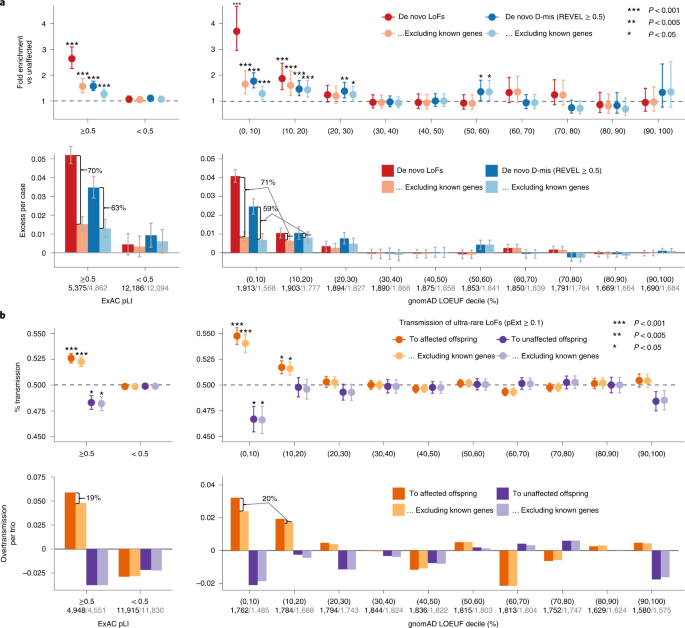
a, The burden of DNVs was evaluated by the rate ratio and rate difference between 16,877 ASD and 5,764 unaffected trios. The exome-wide burden of de novo LoF and D-mis (REVEL ≥ 0.5) variants are concentrated in constrained genes (ExAC pLI ≥ 0.5) and in genes with the highest levels of LoF intolerance in the population (defined by the top two deciles of gnomAD LOEUF scores). Burden analysis was repeated after removing known ASD or NDD genes. The number of genes before and after removing known genes in each constraint bin is shown below the axis label. Data are presented as mean values and 95% confidence intervals. Among constrained genes (ExAC pLI ≥ 0.5 or the top 20% of gnomAD LOEUF scores), close to two-thirds of case-control rate differences of de novo LoF and D-mis variants can be explained by known genes. Exact P values by Poisson test are listed in Supplementary Table 19. b, The burden of inherited LoFs was evaluated by looking at the proportion of rare LoFs in 20,491 parents without ASD diagnoses or intellectual disability that are transmitted to affected offspring in 9,504 trios and 2,966 duos and show evidence of overtransmission of LoFs per ASD trio. As a comparison, we also show the transmission disequilibrium pattern to unaffected offspring in 5,110 trios and 129 duos. Data are presented as mean values ± standard errors as error bars. Two-sided binomial test was used to compute the P values for overtransmission or undertransmission. Using ultra-rare LoFs with pExt ≥ 0.1, exome-wide signals of transmission disequilibrium of rare inherited LoF variants also concentrate in constrained genes (ExAC pLI ≥ 0.5) and in genes within the top two deciles of gnomAD LOEUF scores. Analysis was restricted to autosomal genes and repeated after removing known ASD or NDD genes (number of genes in each constrained bin before and after removing known genes is shown below the axis label). Among all constrained genes, only one-fifth of overtransmission of LoFs to ASD trios can be explained by known ASD or NDD genes. Exact P values by binominal test are listed in Supplementary Table 19.
To assess the evidence of DNVs in individual genes, we applied DeNovoWEST11, which integrates DNV enrichment with clustering of missense variants in each gene. The initial DeNovoWEST scan of DNVs in 16,877 ASD trios identified 159 genes with P < 0.001 (Supplementary Table 3).
Rare inherited LoFs are mostly in unknown ASD risk genes
To analyze the contribution of rare inherited LoF variants to ASD risk, we evaluated transmission disequilibrium in ultra-rare (allele frequency < 1 × 10⁻⁵) high-confidence (by the loss-of-function transcript effect estimator (LOFTEE)26 package and proportion expression across transcripts (pExt)27; see Methods and Supplementary Note) LoF variants from parents without ASD diagnoses or intellectual disability to affected offspring with ASD in 9,504 trios and 2,966 duos from the first stage (Supplementary Table 4). For a given set of genes, we quantified transmission disequilibrium using the number of overtransmitted (excess in transmission over nontransmission) LoF variants per trio; parent–offspring duos were considered half-trios. Among autosomal genes, the overall transmission disequilibrium signal of ultra-rare LoF variants is enriched in LoF-intolerant genes (ExAC pLI ≥ 0.5) and in genes within the top 20% of LOEUF scores (Fig. 2b), similar to the burden of damaging DNVs. We observed both overtransmission to affected and undertransmission to unaffected offspring, especially in genes within the top 10% of LOEUF scores. However, known ASD or NDD genes explain only ~20% of overtransmission of LoF variants to affected offspring (Fig. 2b). On the X chromosome, we only considered transmission from mothers without ASD to 9,883 affected sons and 2,571 affected daughters (Supplementary Table 4). Rare LoF variants in mothers without ASD show significant overtransmission to affected sons but not affected daughters and remain significant after removing known ASD or NDD genes (Supplementary Fig. 1). Together, these results suggest that most genes conferring inherited ASD risk are yet to be identified. Autosomal rare D-mis variants also show evidence of transmission disequilibrium to affected offspring, although the signal is much weaker (Supplementary Fig. 2).
To characterize the properties of genes contributing to ASD risk through rare inherited variants, we defined 25 gene sets from five categories representing both functional and genetic evidence relevant to ASD (Supplementary Table 5 and Supplementary Fig. 3). We limited the genes to 5,754 autosomal constrained genes (ExAC pLI ≥ 0.5 or top 20% of LOEUF scores) and performed TDT (Supplementary Table 6). For each gene set, we tested if ultra-rare high-confidence rare LoF variants show a higher transmission to ASD offspring than the remaining genes in the overall constrained gene set. As a comparison with DNVs, we also tested if the same set of genes are more frequently disrupted by damaging DNVs than the rest of the genes in ASD trios using DNENRICH32.
Using functional gene sets derived from the neuronal transcriptome, proteome or regulome, we confirmed significant enrichment in damaging DNVs (P < 0.005 by simulation) in the gene sets that were previously suggested to be enriched for ASD risk genes including expression module M2/333, RBFOX1/3 targets34, FMRP targets35 and CHD8 targets36. However, this enrichment can be largely explained by known ASD or NDD genes (Extended Data Fig. 2). For ultra-rare inherited LoF variants, we found that the proportion of transmission to ASD individuals in most functional gene sets is close to all other genes; only RBFOX targets show a weak enrichment but can be largely explained by known genes (Fig. 3). We also applied two machine learning methods to prioritize ASD risk genes: forecASD37 and A-risk38. Although enrichment of DNVs in predicted genes is mainly explained by known genes, genes prioritized by A-risk are significantly enriched with inherited LoFs that are not explained by known genes. Using A-risk ≥ 0.4, 30% of constrained genes (n = 1,464) were prioritized and explain 64% of the overtransmission of LoF variants to ASD offspring (P = 2.6 × 10⁻⁵ by χ2 test). This enrichment is higher than genes prioritized by the LOEUF score; 33% of genes (n = 1,777) in the top decile of LOEUF account for 55% of the overtransmission (P = 3.5 × 10⁻⁴ by χ2 test) (Fig. 3).
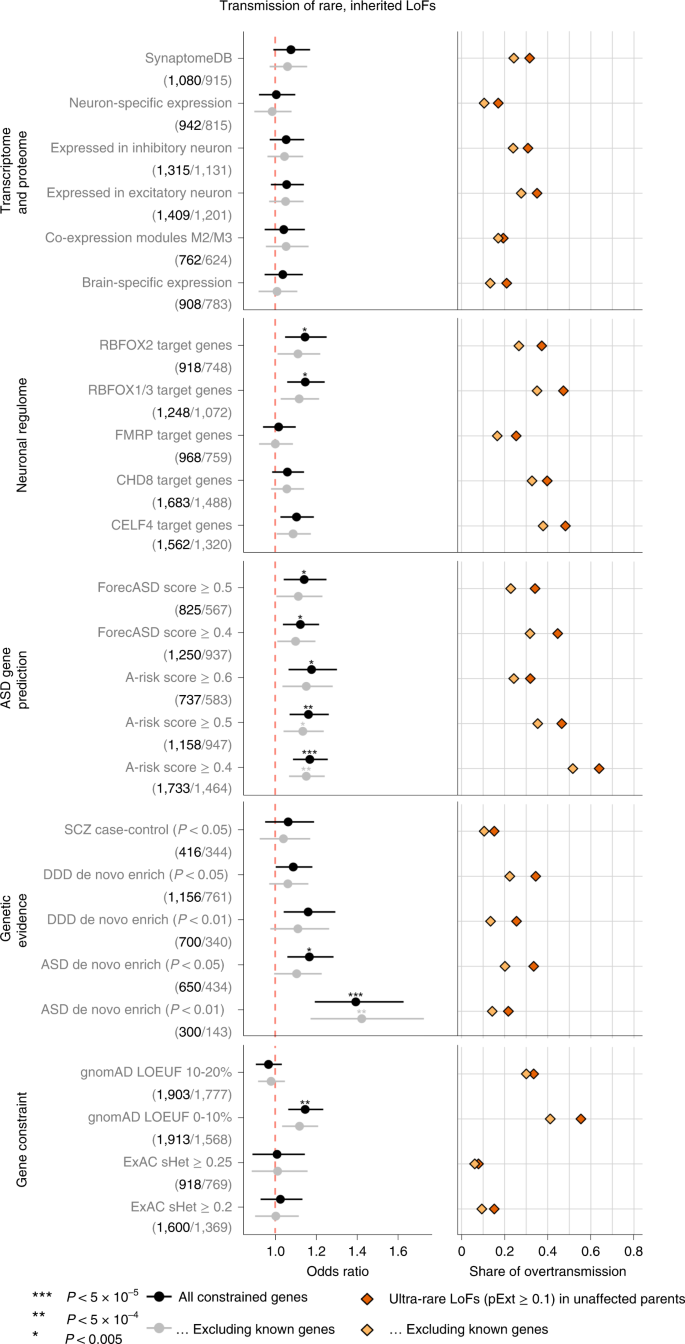
Gene sets were defined and grouped by transcriptome proteome, neuronal regulome, ASD gene prediction scores, genetic evidence from neuropsychiatric diseases, and gene-level constraint. Analyses were repeated after removing known ASD or NDD genes. (Number of genes in each set before and after removing known genes are shown in parentheses below gene set.) Dots represent fold enrichment of DNVs or odds ratios for overtransmission of LoF variants in each set. Horizontal bars are presented as mean values with 95% confidence interval as error bars. For each gene set, we show the percentage of overtransmission of rare LoFs to cases. Enrichment of rare inherited LoFs was evaluated by the share of overtransmission events (the transmission and nontransmission of ultra-rare LoFs with pExt ≥ 0.1) in the selected gene set vs those in all other constrained genes using a two-by-two table. P values were determined using the χ2 test. Exact P values are listed in Supplementary Table 19.
We also considered gene sets that have evidence of genetic association with DNVs. Genes nominally enriched by DNVs (P < 0.01 by DeNovoWEST; n = 300) in ASD from the current study have a significantly higher overtransmission rate than other constrained genes (odds ratio = 1.39, P = 3.0 × 10⁻⁵ by χ2 test) (Fig. 3), although these genes account for only 21% of the overtransmission. Genes nominally enriched by DNVs in other NDDs11 are also significantly enriched by DNVs in ASD and weakly enriched by inherited LoFs in ASD; however, both can be largely explained by known genes (Fig. 3). This suggests that a subset of ASD genes increase risk by both DNVs and inherited variants, and new genes can be identified by integrating evidence from DNV enrichment and TDT.
DNVs and some rare inherited LoFs are associated with intellectual disability
To evaluate the association of genotypes with phenotype in ASD, we used self-reported cognitive impairment in SPARK, a Vineland score of <70 in the SSC or the presence of intellectual disability in ASC. Damaging DNVs in genes ranked within the top 10% of LOEUF scores show a higher burden (P = 1.1 × 10⁻²⁴ by χ2 test) in ASD cases with evidence of cognitive impairment than in other cases, consistent with previous results2,8 (Fig. 4a). Once known ASD or NDD genes were excluded, the residual burden of damaging DNVs in genes within the top 10% of LOEUF scores is greatly reduced and not significantly associated with cognitive phenotype in ASD (Fig. 4a). Overtransmission of rare LoFs in genes within the top 10% of LOEUF genes to ASD cases with cognitive impairment is about 2.7 times higher than to cases without cognitive impairment (P = 4.6 × 10⁻³ by χ2 test) and is still 2 times higher (P = 0.04 by χ2 test) once known ASD or NDD genes were excluded (Fig. 4b). However, rare LoFs in genes prioritized by A-risk are not associated with cognitive impairment (Supplementary Fig. 4). Taken together, these results suggest that rare variants in the top 10% of LOEUF genes—most of which are already known to be ASD or NDD risk genes—are associated with cognitive impairment. However, a subset of rare inherited variants, particularly those prioritized by A-risk, are not associated with cognitive impairment.
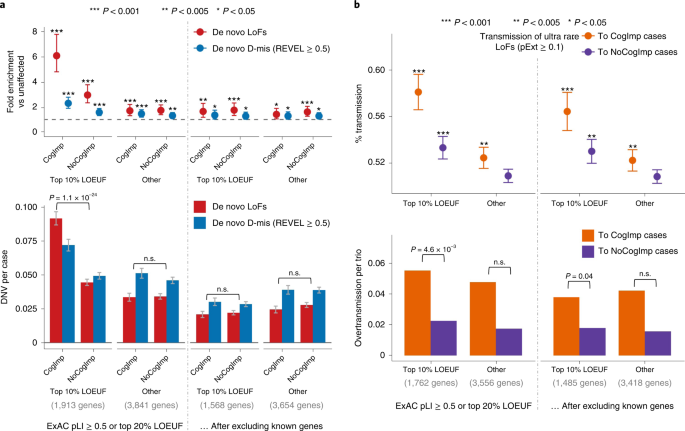
Ultra-rare inherited LoFs with pExt ≥ 0.1 in genes with the top 10% of gnomAD LOEUF scores also show a higher proportion of transmission and a higher overtransmission rate to ASD offspring with cognitive impairment (CogImp) than those without (NoCogImp). Rare LoFs in other constrained genes are not significantly associated with phenotypic severity. The increased burden of inherited LoFs in cases with cognitive impairment remains significant after removing known ASD or NDD genes. Data are presented as mean values ± standard errors as error bars. Poisson test was used to compute the P values to assess the fold enrichment, and binominal test was used for overtransmission. Exact P values are listed in Supplementary Table 19.
Meta-analysis identifies five new risk genes
Based on results from the first stage, we identified 260 genes with evidence of TDT (TDT statistic39 ≥ 1) and in gene sets enriched with rare inherited LoFs (top 10% LOEUF or within top 20% LOEUF and A-risk ≥ 0.4) (Supplementary Table 6) and 159 genes with P < 0.001 from the DeNovoWEST analysis of DNVs (with 15 genes by both) (Supplementary Table 3). We performed a meta-analysis on the 367 autosomal genes with all data from stage 1 and stage 2, which includes 6,174 new ASD trios, 1,942 new duos, 15,780 unrelated cases (see Methods) and 236,000 population controls.
We used Fisher’s method40 to combine three P values that estimate independent evidence of DNVs, TDT and case-control comparison: (1) DeNovoWEST with DNVs from both stage 1 and stage 2 (n = 23,039 trios, Supplementary Tables 1 and 7) using the parameters estimated in stage 1, (2) TDT with rare LoF variants in parents without ASD diagnoses or intellectual disability with affected offspring in 15,586 trios and 4,907 duos (Supplementary Table 4) and (3) unrelated cases (Supplementary Table 8) compared with population controls using a binomial test. We used two sets of controls: gnomAD exome v2.1.1 non-neuro subset (only samples from individuals who were not ascertained for having a neurological condition in a neurological case-control study, n = 104,068) and TOPMed WGS (freeze 8, n = 132,345). We performed a case-control burden test using the two sets separately and input the larger P value for the meta-analysis. This approach avoids sample overlap and helps ensure that significant genes are not dependent on the choice of population reference. Although population reference data were processed by different pipelines, the cumulative allele frequencies (CAFs) of high-confidence LoF variants (see Methods) are similar between internal pseudocontrols (see Methods) and the two population references after applying the same LoF filters (Supplementary Fig. 5). Previous population genetic simulations predict that for genes under moderate to strong selection (selection coefficient > 0.001), deleterious variants are expected to arise within 1,000 generations and population demographic histories do not confound the CAFs of deleterious alleles in these genes41.
For 367 selected autosomal genes, the point estimates of selection coefficient under the mutation–selection balance model42 are all greater than 0.01 (Supplementary Fig. 6). Most high-confidence LoF variants in these genes are ultra-rare (Supplementary Fig. 7), and the CAFs of high-confidence LoF variants in European and non-European population samples are highly correlated (Supplementary Fig. 8). Therefore, we included population samples across all ancestries as controls. The ultra-rare synonymous variant burden is similar between cases and controls across the selected genes (Extended Data Fig. 3). To make use of all genetic data collected, we also included rare variants of unknown inheritance from ASD cases that were analyzed in the first stage. These variants come from cases that are part of unaffected parent–ASD duos; such variants were either inherited from the parent not participating in the study or DNVs. Therefore, these variants are independent of TDT, even though the same cases were included in TDT.
We identified 60 genes with exome-wide significance (P < 2.5 × 10⁻⁶), and 72 genes reached study-wide significance accounting for all 5,754 constrained genes (P < 8.7 × 10⁻⁶, Supplementary Table 9). Figure 5 summarizes the distribution of LoF variants (with different modes of inheritance) in genes that reached study-wide significance by DNV enrichment (Fig. 5a) and other significant genes by meta-analysis (Fig. 5b and Supplementary Fig. 9). Genes that are significant only in meta-analysis tend to harbor more inherited LoF variants than DNVs, consistent with their lower penetrance for ASD or NDD.
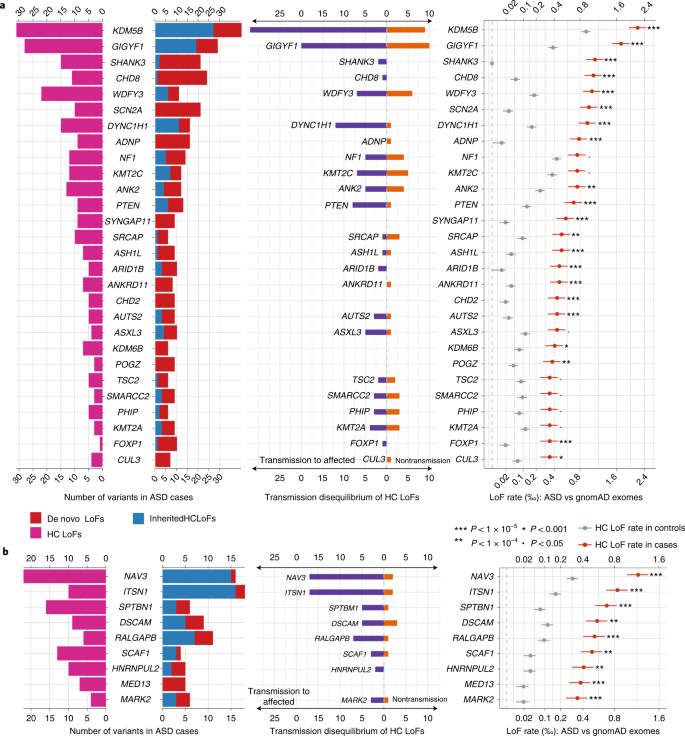
From left to right: pyramid plots summarizing the number of de novo LoFs in 15,857 ASD trios, inherited high-confidence LoFs in 18,720 unrelated offspring included in transmission analysis, and high-confidence LoFs in 15,780 unrelated cases; bar plot of transmission vs nontransmission for rare high-confidence LoFs identified in parents without ASD diagnoses or intellectual disability; three plots comparing the high-confidence LoF rate in 31,976 unrelated ASD cases with gnomAD exomes (non-neuro subset, 104,068 individuals). Horizontal bars are presented as mean values ± standard errors as error bars. a, Twenty-eight known ASD or NDD genes that have LOEUF scores in the top 30% of gnomAD, have a P value for enrichment among all DNVs (P < 9 × 10⁻⁶) in 23,039 ASD trios, and have more than 10 LoFs. b, Nine additional ASD risk genes that achieved a P value of <9 × 10⁻⁶ in stage 2 of this analysis. The majority of genes in b harbor more inherited LoFs than DNVs. All five novel genes (Table 1) are shown in b. Note that the x axes of LoF rates are in the squared root scale. Poisson test was used to compute the P values. Exact P values are listed in Supplementary Table 6.
Although most significant genes were previously known, we identified five new genes that have exome-wide significance regardless of the choice of population reference: NAV3, MARK2, ITSN1, SCAF1 and HNRNPUL2 (Table 1). The combined P values based on ancestry-specific case-control analyses are similar to the overall case-control analysis for these five genes (Supplementary Table 10). As expected, most supporting variants are ultra-rare, and results are robust to the allele frequency filter. These five new genes together explain 0.27% of the PAR ratio (Supplementary Table 11). NAV3 has a similar PAR to that of CHD8 and SCN2A (~0.095%). ITSN1 is similar to PTEN (~0.065%).
The association of NAV3 with ASD risk is primarily driven by rare inherited variants (Table 1). NAV3 has a high A-risk score, suggesting that the expression pattern of NAV3 is highly similar to known ASD genes (Supplementary Data 1)7,43. NAV3 has high expression in the inner cortical plate of the developing cortex33, and in pyramidal neurons (hippocampus CA1 and somatosensory cortex) and cortical interneurons44,45 (Supplementary Fig. 10). The association of MARK2 with ASD risk is primarily driven by DNVs and is also associated with other NDDs11 (P = 2.7 × 10⁻⁵ by DeNovoWEST) including Tourette syndrome46 and epilepsy47. We find that three out of eight autistic offspring with variants in MARK2 report epilepsy, two out of eight report Tourette syndrome and seven out of eight have evidence of cognitive impairment (Supplementary Table 12).
The remaining three novel genes have support from both DNVs and rare LoFs. ITSN1 and SCAF1 show nominal significance of DNV enrichment in 31,058 NDD trios11 (P < 0.05 by DeNovoWEST). SCAF1 was among the top 50 genes from a gene-based burden test in a recent schizophrenia case-control study (P = 0.0027 by burden test)48. Both ITSN1 and NAV3 have moderate effect sizes (point estimate of relative risk 3~6; Supplementary Table 11). ITSN1 has been highlighted in our previous study with evidence of enriched inherited LoFs7. We also assessed deletions in these new genes. For both ITSN1 and NAV3, we identified four partial or whole gene deletions in 33,083 parents without ASD diagnoses or intellectual disability that also show transmission disequilibrium to affected offspring (Extended Data Fig. 4).
Although both de novo and rare inherited LoFs in the most constrained genes are strongly associated with intellectual disability in ASD (Fig. 4), the association of such variants in individual genes is heterogenous, as suggested by the lack of association of rare inherited variants in genes with high A-risk scores (Extended Data Fig. 2). We calculated the burden of cognitive impairment (see Methods) in 87 ASD individuals with high-confidence LoF variants in the four novel moderate-risk genes and compared it with that in 129 individuals with high-confidence LoF in the well-established ASD risk genes CHD8, SCN2A, SHANK3, ADNP and FOXP1, as well as 8,731 individuals with ASD (Supplementary Fig. 11). Although most individuals with variants in well-established ASD risk genes have some evidence of cognitive impairment (88%), individuals with LoF variants in the moderate-risk genes had significantly lower burden (56%, P = 4.5 × 10⁻⁷). Individuals with high-confidence LOFs in the moderate-risk genes did not have a significantly different burden of cognitive impairment than 8,731 individuals with ASD in SPARK (56% vs 50%, P = n.s.). Individuals with LoF variants in the moderate-risk genes also had a similar male:female (4:1) ratio compared with the larger cohort, whereas individuals with variants in the well-established ASD risk genes showed significantly less male bias (1.6:1, P = 0.009) (Supplementary Fig. 11), as previously reported2. We also predicted full-scale intelligence quotient (IQ) on all participants based on parent-reported data using a machine learning method49. Heterozygotes for rare LoFs in three (NAV3, SCAF1 and HNRNPUL2) of the four new genes with substantial contribution from rare inherited variants have similar IQ distribution as the overall SPARK cohort (Fig. 6a), which is substantially higher than heterozygotes with rare LoFs in well-established, highly penetrant genes that contribute to ASD primarily through DNVs (‘DN genes’) such as CHD8, SHANK3 and SCN2A. In fact, both novel and established genes with significant contribution from rare inherited LoFs are less associated with intellectual disability than NDD genes (Fig. 6b). Across these genes, there is a significant negative correlation (r = 0.78, P = 0.001) of estimated relative risk of rare LoFs with average predicted IQ of the individuals with these variants (Fig. 6c).
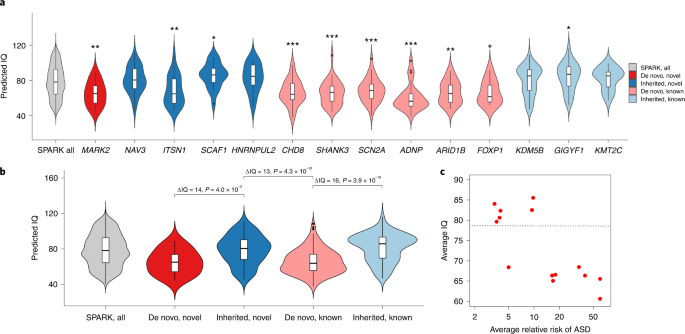
We examined the distribution of predicted IQ using a machine learning method49 for 95 individuals with ASD with an LoF mutation in one of the five novel exome-wide-significant genes (MARK2, NAV3, ITSN1, SCAF1 and HNRNPUL2) and nine known ASD genes (CHD8, SHANK3, SCN2A, ADNP, ARID1B, FOXP1, KDM5B, GIGYF1 and KMT2C), compared with 2,545 SPARK participants with ASD and known IQ scores. The nine known ASD genes include six genes (pink and labeled ‘de novo, known’) that are well-established de novo ASD risk genes that exceed exome-wide significance and were most frequently identified in SPARK, which maximizes the number of samples available for genotype–phenotype analyses. We also included three genes (light blue and labeled ‘inherited, known’) that have some previous evidence for inherited ASD risk (GIGYF17, KDM5B62 and KMT2C63) and were also frequently identified in SPARK. We denote the genes contributing to ASD primarily through de novo LoF variants in our analysis as ‘de novo’ (red), and the genes primarily through inherited LoF variants as ‘inherited’ (blue). a, Distribution of predicted IQ between individuals with ASD with LoF mutations in the five novel genes, nine known genes and all participants with ASD and known IQ scores in SPARK (n = 2,545). We compared the mean predicted IQ between participants with LoF mutations in ASD genes and all participants by two-sample t-test. *, 0.01 ≤ P < 0.05; **, 0.001 ≤ P < 0.01; ***, P < 0.001. Exact P values are listed in Supplementary Table 19. The box plots represent median as center, and interquartile range (IQR) as bounds of the box; the upper whisker extends from the upper bound of the box to 1.5 × IQR, and the lower whisker extends from the lower bound of the box to 1.5 × IQR. Two-sided t-test was used to compute the P values for comparing mean predicted IQ between ASD individuals with LoF mutation in specific gene and all ASD participants. Individuals with pathogenic variants in de novo risk genes have significantly lower predicted IQ than overall SPARK participants with ASD and known IQ scores, whereas individuals with LoF variants in moderate-risk, inherited genes show similar predicted IQ as the overall SPARK participants, with the exception of ITSN1. b, Distribution of predicted IQ between individuals with ASD gene grouped by both inheritance status (‘de novo’ or ‘inherited’) and whether the ASD genes are novel (‘novel’ or ‘known’). We compared the mean predicted IQ between individuals with pathogenic variants in de novo genes and inherited genes among our five novel genes and nine known genes. Overall, people with LoF mutations in de novo genes have an average of 13–16 points lower predicted IQ than individuals with LoF mutations in inherited genes, regardless of whether the ASD genes are novel or known. The box plots represent median as center, and IQR as the bounds of the box; the upper whisker extends from the upper bound of the box to 1.5 × IQR, and the lower whisker extends from the lower bound of the box to 1.5 × IQR. c, Average relative risk of ASD and average predicted IQ among different groups. Each dot shows the average of individuals with rare LoFs of a gene selected in a. The relative risk is estimated from mega-analysis and capped at 60. Pearson correlation between average IQ and log relative risk is −0.78 (P = 0.001). The horizontal line represents the average IQ (IQ = 79) of all SPARK individuals with predicted IQs. ITSN1 is an outlier at the bottom left corner.
Most known ASD or NDD genes that are enriched by LoF DNVs harbor more de novo than LoF inherited variants in ~16,000 unrelated ASD trios (Fig. 5a and Supplementary Fig. 16), consistent with their high penetrance for ASD or NDD phenotypes and strong negative selection. Using population exome or WGS data, we calculated a point estimate of selection coefficient (\(\hat s\))50 of LoFs in each gene (Supplementary Table 11) and found that the fraction of de novo LoFs in ASD genes is higher in genes with large \(\hat s\), and smaller in genes with small \(\hat s\) (Supplementary Fig. 5b), consistent with population genetic theory51. We also estimated average effect size of rare LoFs in ASD genes by comparing CAF in 31,976 unrelated cases and population exome or WGS data. As expected, known and newly significant ASD genes with higher risk for ASD are under stronger selection (larger \(\hat s\)) (Supplementary Fig. 13).
Functional similarity of new genes and known ASD genes
To better appreciate the probable functional implications of the new exome-wide-significant genes that confer inherited risk for ASD, we integrated mechanistic (STRING52) and phenotypic (Human Phenotype Ontology (HPO)53) data into a single embedding space (six dimensions, one for each archetype coefficient) using a combination of canonical correlation analysis and archetypal analysis (see Methods). This embedding space serves as an interpretive framework for putative ASD risk genes (n = 1,776). Six functional or phenotypic archetypes were identified (Fig. 7 and Supplementary Tables 13–15) that represent pathways that are well understood to play a role in ASD: neurotransmission (archetype 1 or A1), chromatin modification (archetype 2 or A2), RNA processing (archetype 3 or A3), vesicle-mediated transport (archetype 4 or A4), MAPK signaling and migration (archetype 5 or A5), and cytoskeleton and mitosis (archetype 6 or A6), also enriched for intermediate filaments. These archetypes organize risk genes in a way that jointly maximizes their association with mechanisms (STRING clusters) and phenotypes (HPO terms). For instance, A1 genes (neurotransmission) are enriched for the STRING cluster CL:8435 (ion channel and neuronal system) and are also associated with seizure and epileptic phenotypes. A2 genes (chromatin modifiers) are enriched for nuclear factors and genes linked to growth and morphological phenotypes (Supplementary Table 14). We call genes that strongly map to an archetype (that is, >2× the next highest-ranking archetype) ‘archetypal’; if this criterion is not met, we call the genes ‘mixed’. Archetypal genes are generally less functionally ambiguous than mixed genes. Of the five novel inherited risk genes, two are archetypal (suggesting function within known risk mechanisms): NAV3 (A6, cytoskeleton and mitosis) and ITSN1 (A4, vesicle-mediated transport). SCAF1, MARK2 and HNRNPUL2 are mixtures of the identified archetypes, largely A4 and A5. That these new genes did not resolve clearly into archetypes (that were defined by known and suspected autism risk genes) suggests that they may operate in potentially novel mechanisms. To elucidate these possibilities, we constructed an ad hoc archetype, defined by the centroid between SCAF1, MARK2 and HNRNPUL2 (see Fig. 7c). Cell–cell junction (CL:6549) was the STRING cluster most associated with this centroid (P = 4.12 × 10⁻¹⁴ by the Kolmogorov–Smirnov test; Fig. 7d), which fits with its location between A4 (vesicle-mediated transport) and A5 (MAPK signaling and migration).
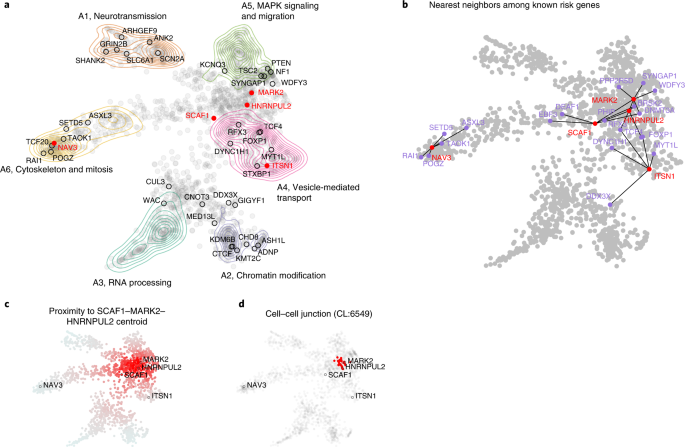
a, Using a combination of archetypal analysis and canonical correlation analysis, putative autism risk genes were organized into k = 6 archetypes that represent distinct mechanistic (STRING) and phenotypic (HPO) categorizations (neurotransmission, chromatin modification, RNA processing, vesicle-mediated transport, MAPK signaling and migration, and cytoskeleton and mitosis). Genes implicated by our meta-analysis are indicated by their label, with novel genes in red. b, For each of the five novel genes, we identified the five nearest neighbors in the embedding space among the 62 meta-analysis genes. SCAF1, MARK2 and HNRNPUL2 were identified as ‘mixed’ rather than ‘archetypal’ in their probable risk mechanisms. c, To gain further insight into possible risk mechanisms, we calculated the embedding distance to the centroid of these three genes, which was then used as an index variable to perform gene set enrichment analysis. d, A STRING cluster (CL:6549) containing genes related to cell–cell junctions and the gap junction was identified as being highly localized in this region of the embedding space (P = 4.12 × 10⁻¹⁴ by the Kolmogorov–Smirnov test). This may suggest that these genes confer autism risk through dysregulation of processes related to cell adhesion and migration.
Power analysis
The power of identifying risk genes with rare inherited variants or DNVs monotonically increases with increasing effect size or expected CAF under the null. New ASD genes to be discovered are likely to have smaller effect size than known ASD genes, as suggested by our results. Additionally, known ASD genes are biased toward longer genes, which have a higher background mutation rate of damaging variants (‘long genes’) (Extended Data Fig. 5). Even though longer genes are more likely to be expressed in the brain and be relevant to ASD or NDD54, among most constrained genes, long genes (LoF mutation rate55,56 above 80% quantile) and short genes (below 80%) have similar enrichment of damaging DNVs and rare inherited LoFs (Supplementary Fig. 14). Notably, for short genes, known genes have virtually no contribution to overtransmitted high-confidence LoFs to affected offspring (Supplementary Fig. 14b), suggesting that many short ASD risk genes remain to be identified.
We used a published framework41 to analyze power based on case-control association of rare variants. For rare variants in genes under strong selection, CAF is largely determined by mutation rate and selection coefficient41. We therefore modeled power of discovering risk genes as a function of relative risk and selection coefficient. With about 5,500 constrained genes, the power of the current study was calculated for 31,976 unrelated cases and an experiment-wise error rate of 9 × 10⁻⁶ (Extended Data Fig. 6).
We inversed the power calculation to determine the required sample size to achieve 90% power under the same assumptions (Extended Data Fig. 7). For genes at median LoF mutation rate across all genes, we estimated that it requires about 96,000 cases (three times the current sample size) to identify genes with similar effect size as NAV3 (relative risk = 4.5) and ITSN1 (relative risk = 5), and about 64,000 cases (twice the current sample size) to find genes with similar effect sizes as SCAF1 (relative risk = 8) and HNRNPUL2 (relative risk = 9). We note that ten and five times the current sample size, respectively, are required to detect genes similar to NAV3 or ITSN1 and genes similar to SCAF1 or HNRNPUL2 by DNVs alone.
Recommend
About Joyk
Aggregate valuable and interesting links.
Joyk means Joy of geeK