

Split data into groups that have the same mean and variance
source link: https://blogs.sas.com/content/iml/2017/05/01/split-data-groups-mean-variance.html
Go to the source link to view the article. You can view the picture content, updated content and better typesetting reading experience. If the link is broken, please click the button below to view the snapshot at that time.

Split data into groups that have the same mean and variance
15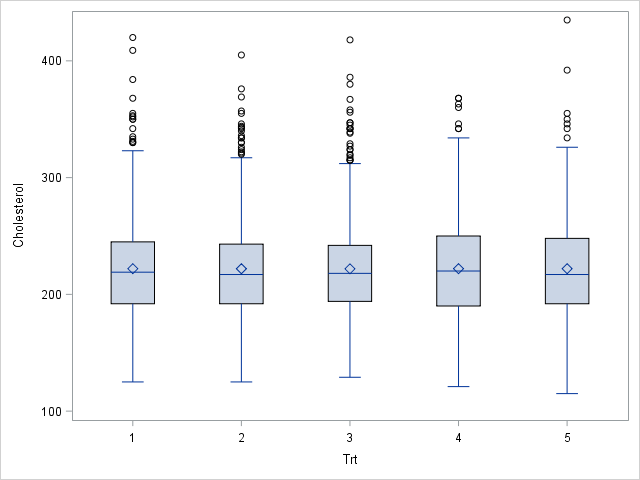
A frequently asked question on SAS discussion forums concerns randomly assigning units (often patients in a study) to various experimental groups so that each group has approximately the same number of units. This basic problem is easily solved in SAS by using PROC SURVEYSELECT or a DATA step program.
A more complex problem is when the researcher wants the distribution of a covariate to be approximately equal for each group. For example, a medical researcher might want each group of patients to have approximately the same mean and variance for their cholesterol levels, as shown in the plot to the right. This second problem is much harder because it involves distributing the units (non-randomly) so that the groups satisfy some objective. Conceptually, you want an assignment that minimizes the difference between moments (mean, variance, skewness,...) of the subgroups.
The OPTEX procedure for optimal design
Creating an experimental design that optimizes some criterion is one of the many uses of the OPTEX procedure in SAS/QC software In fact, this problem is one of the examples in the PROC OPTEX documentation. The example in this blog post follows the documentation example; see the documentation for details.
To solve this assignment problem with PROC OPTEX, you need to specify three things:
- A data set (call it UNITS) that contains the individual units (often patients) that you want to assign to the treatments. For this example, the units are the living patients in the Sashelp.Heart data set.
- A data set (call it TREATMENTS) that contains the names of the treatment groups. This example uses five groups with values 1, 2, 3, 4, and 5.
- The covariate in the problem. The OPTEX procedure will assign units to groups so that the first k moments are approximately equal across treatment groups. This example uses the Cholesterol variable and k=2, which means that the mean and variance of the cholesterol levels for patients in each treatment group will be approximately equal.
The following statements create the two data sets and define a macro variable that contains the name of the Cholesterol variable:
/* Split the living Sashelp.heart patients into five groups so that mean and variance of cholesterol is the same across groups. */ data Units; /* each row is a unit to be assigned */ set Sashelp.Heart(where=(status = "Alive")); keep Sex AgeAtStart Height Weight Diastolic Systolic MRW Cholesterol; run; %let NumGroups =5; /* number of treatment groups */ data Treatments; do Trt = 1 to &NumGroups; /* Trt is variable that assigns patients to groups */ output; end; run; %let Var = Cholesterol; /* name of covariate */ |
As discussed in the PROC OPTEX documentation, the following call creates an output data set (named GROUPS) that assigns each patient to a group (1–5). A call to PROC MEANS displays the mean and variance of each group.
proc optex data=Treatments seed=97531 coding=orthcan; class Trt; model Trt; /* specify treatment model */ blocks design=Units; /* specify units */ model &Var &Var*&Var; /* fixed covariates: &Var--> mean, &Var*&Var--> variance */ output out=Groups; /* merged data: units assigned to groups */ run; proc means data=Groups mean std; class Trt; var &Var; run; |
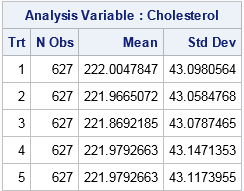
Success! The table shows that each group has approximately the same size and approximately the same mean and variance of the Cholesterol variable. Remember, though, that this assignment scheme is not random, so be careful not to make unjustified inferences from estimates based on these group assignments.
I am not an expert on experimental design, but a knowledgeable colleague tells me that optimal design theory states that the design that minimizes the variance of the treatment effects (adjusting for the first two moments of the covariate) is the design in which treatment means and variances of the covariate are as equal as possible. This is the design that PROC OPTEX has produced.
The following call to PROC SGPLOT uses box plots to visualize the distribution of the Cholesterol variable across treatment groups. The graph is shown at the top of this article. Clearly the distribution of cholesterol is very similar for each group.
proc sgplot data=Groups; vbox &Var / category=Trt; run; |
In summary, the OPTEX procedure in SAS/QC software enables you to assign units to groups, where each group has approximately the same distribution of a specified covariate. In this article, the covariate measured cholesterol levels in patients, but you can also group individuals according to income, scholastic aptitude, and so on. For large data sets, the assignment problem is a challenging optimization problem, but PROC OPTEX provides a concise syntax and solves this problem efficiently.
Recommend
About Joyk
Aggregate valuable and interesting links.
Joyk means Joy of geeK