

链路追踪:Sleuth整合ZipKin-51CTO.COM
source link: https://developer.51cto.com/article/709821.html
Go to the source link to view the article. You can view the picture content, updated content and better typesetting reading experience. If the link is broken, please click the button below to view the snapshot at that time.

链路追踪:Sleuth整合ZipKin-51CTO.COM

在《SpringCloud Alibaba实战》专栏前面的文章中,我们实现了用户微服务、商品微服务和订单微服务之间的远程调用,并且实现了服务调用的负载均衡。也基于阿里开源的Sentinel实现了服务的限流与容错,并详细介绍了Sentinel的核心技术与配置规则。
简单介绍了服务网关,并对SpringCloud Gateway的核心架构进行了简要说明,也在项目中整合了SpringCloud Gateway网关实现了通过网关访问后端微服务,同时,也基于SpringCloud Gateway整合Sentinel实现了网关的限流功能,详细介绍了SpringCloud Gateway网关的核心技术。在链路追踪章节,我们开始简单介绍了分布式链路追踪技术与解决方案,随后在项目中整合Sleuth实现了链路追踪。
在前面整合Sleuth实现链路追踪时,我们是通过查看日志的情况来了解系统调用的链路情况,这并不是一种很好的解决方案,如果系统所包含的微服务越来越多,通过查看日志的方式来分析系统的调用是非常复杂的,在实际项目中根本不可行。此时,我们可以将Sleuth和ZipKin进行整合,利用ZipKin将日志进行聚合,将链路日志进行可视化展示,并支持全文检索。
ZipKin核心架构
Zipkin 是 Twitter 的一个开源项目,它基于Google Dapper论文实现,可以收集微服务运行过程中的实时链路数据,并进行展示。
ZipKin概述
Zipkin是一种分布式链路跟踪系统,能够收集微服务运行过程中的实时调用链路信息,并能够将这些调用链路信息展示到Web界面上供开发人员分析,开发人员能够从ZipKin中分析出调用链路中的性能瓶颈,识别出存在问题的应用程序,进而定位问题和解决问题。
ZipKin核心架构
ZipKin的核心架构图如下所示。
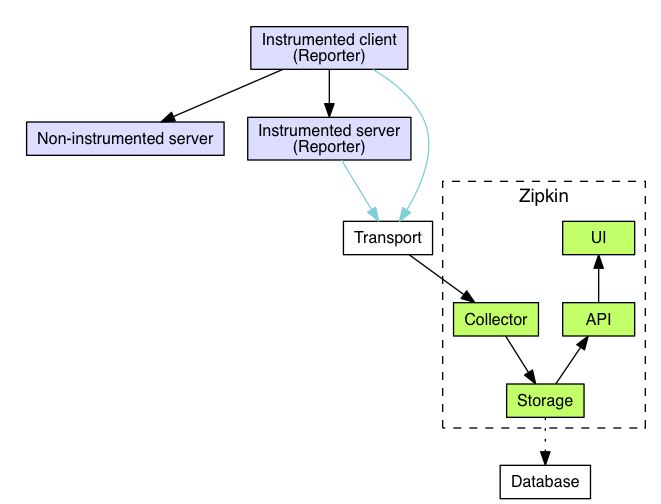
注:图片来源:zipkin.io/pages/architecture.html
其中,ZipKin核心组件的功能如下所示。
- Reporter:ZipKin中上报链路数据的模块,主要配置在具体的微服务应用中。
- Transport:ZipKin中传输链路数据的模块,此模块可以配置为Kafka,RocketMQ、RabbitMQ等。
- Collector:ZipKin中收集并消费链路数据的模块,默认是通过http协议收集,可以配置为Kafka消费。
- Storage:ZipKin中存储链路数据的模块,此模块的具体可以配置为ElasticSearch、Cassandra或者MySQL,目前ZipKin支持这三种数据持久化方式。
- API:ZipKin中的API 组件,主要用来提供外部访问接口。比如给客户端展示跟踪信息,或是开放给外部系统实现监控等。
- UI:ZipKin中的UI 组件,基于API组件实现的上层应用。通过UI组件用户可以方便并且很直观地查询和分析跟踪信息。
Zipkin在总体上会分为两个端,一个是Zipkin服务端,一个是Zipkin客户端,客户端主要是配置在微服务应用中,收集微服务中的调用链路信息,将数据发送给ZipKin服务端。
项目整合ZipKin
Zipkin总体上分为服务端和客户端,我们需要下载并启动ZipKin服务端的Jar包,在微服务中集成ZipKin的客户端。
下载安装ZipKin服务端
(1)下载ZipKin服务端Jar文件,可以直接在浏览器中输入如下链接进行下载。
https://search.maven.org/remote_content?g=io.zipkin.java&a=zipkin-server&v=LATEST&c=exec如果大家使用的是Linux操作系统,也可以在命令行输入如下命令进行下载。
wget https://search.maven.org/remote_content?g=io.zipkin.java&a=zipkin-server&v=LATEST&c=exec这里,我通过浏览器下载的ZipKin服务端Jar文件为:zipkin-server-2.12.9-exec.jar。
(2)在命令行输入如下命令启动ZipKin服务端。
java -jar zipkin-server-2.12.9-exec.jar(3)由于ZipKin服务端启动时,默认监听的端口号为9411,所以,在浏览器中输入http://localhost:9411链接就可以打开ZipKin的界面,如下所示。
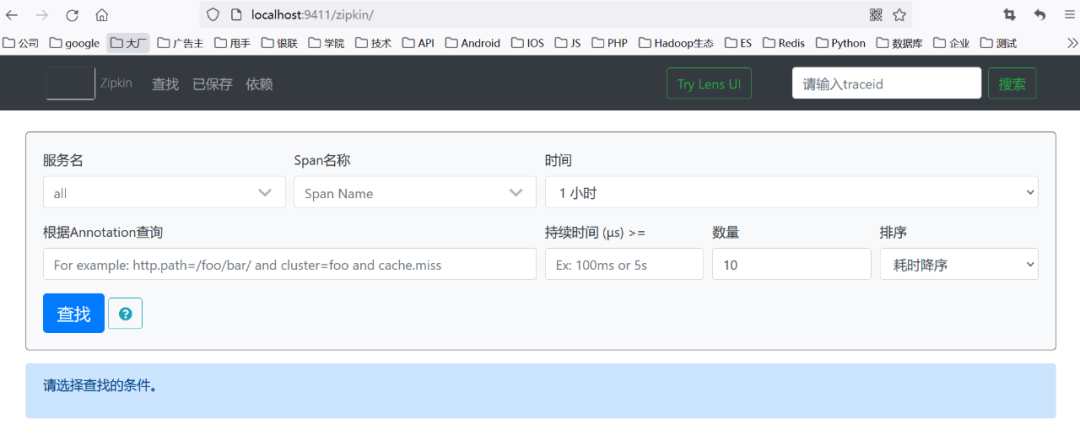
在浏览器中输入http://localhost:9411链接能够打开上述页面就说明ZipKin服务端已经准备好啦。
项目整合ZipKin客户端
(1)在每个微服务(用户微服务shop-user,商品微服务shop-product,订单微服务shop-order,网关服务shop-gateway)中添加ZipKin依赖,如下所示。
<dependency>
    <groupId>org.springframework.cloud</groupId>
    <artifactId>spring-cloud-starter-zipkin</artifactId>
</dependency>
(2)在网关服务shop-gateway的application.yml文件中添加如下配置。
spring:
  sleuth:
    sampler:
      probability: 1.0
  zipkin:
    base-url: http://127.0.0.1:9411
    discovery-client-enabled: false
其中各配置的说明如下所示。
- spring.sleuth.sampler.probability:表示Sleuth的采样百分比。
- spring.zipkin.base-url:ZipKin服务端的地址。
- spring.zipkin.discovery-client-enabled:配置成false,使Nacos将其当成一个URL,不要按服务名处理。
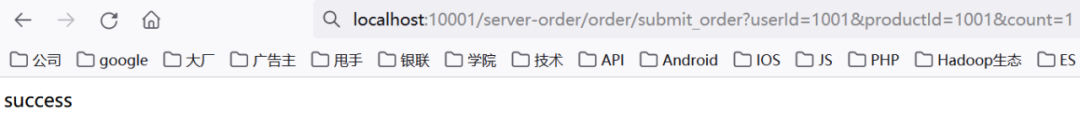
(3)分别启动用户微服务,商品微服务,订单微服务和服务网关,在浏览器中访问链接http://localhost:10001/server-order/order/submit_order?userId=1001&productId=1001&count=1,如下所示。
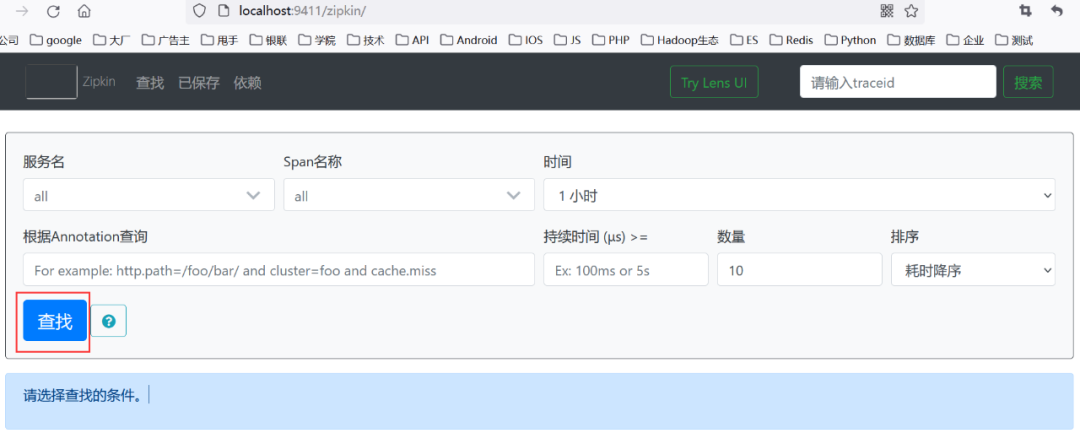
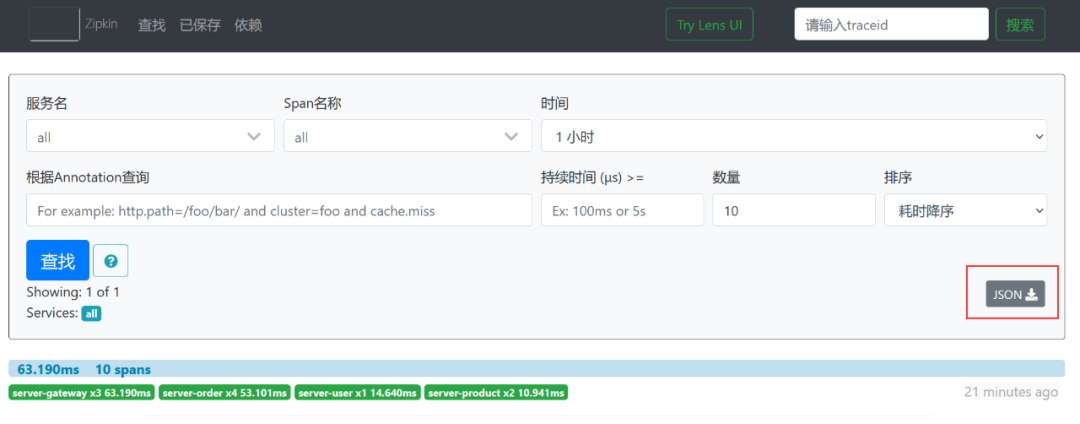
(4)点击Zipkin界面上的查找按钮,如下所示。
点击后的界面如下所示。
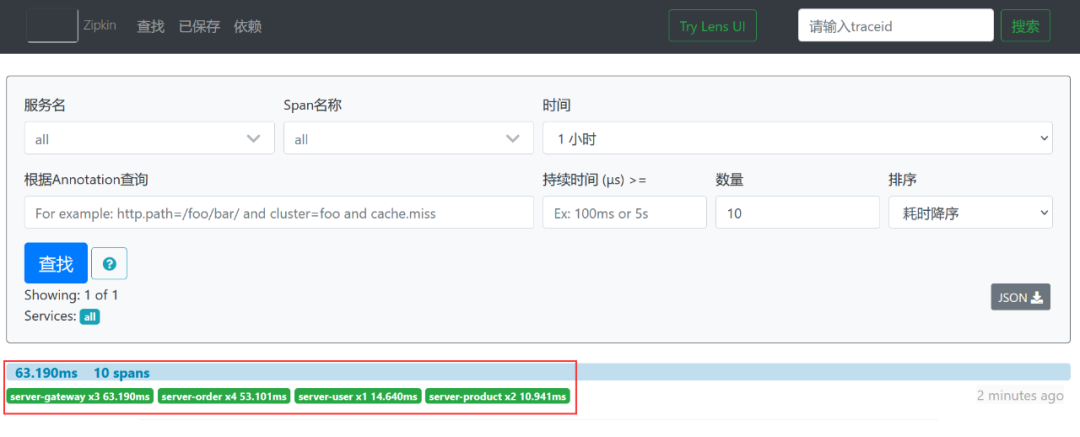
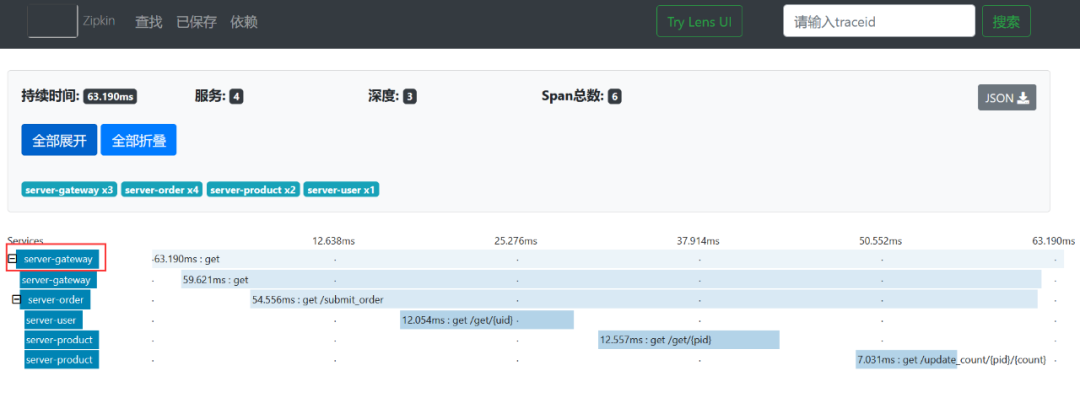
可以看到,点击查找按钮后,会出现一个请求链路,包含:网关服务server-gateway耗时63.190毫秒,订单微服务server-order耗时53.101毫秒,用户微服务server-user耗时14.640毫秒,商品微服务server-product耗时10.941毫秒。
(5)点开ZipKin界面上显示的调用链路,如下所示。
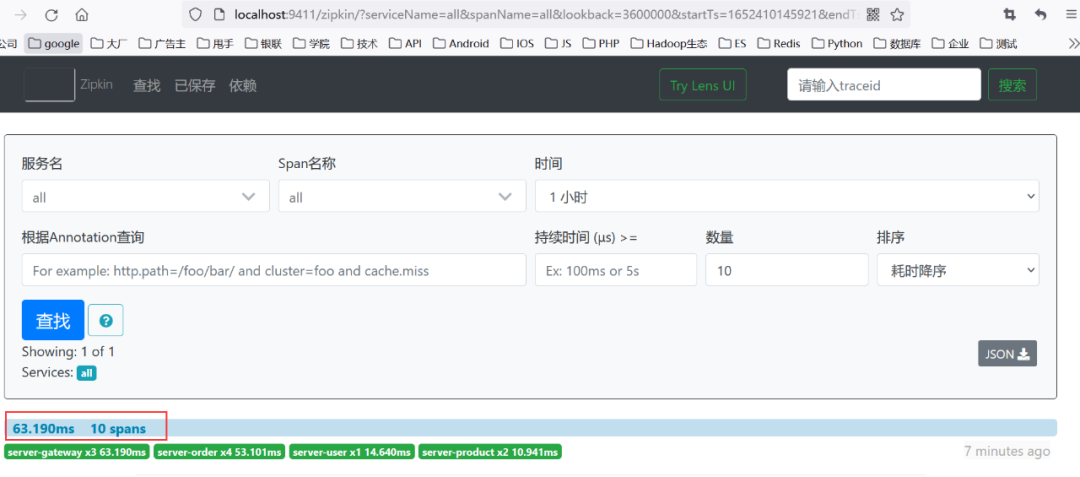
点开后的界面如下所示。
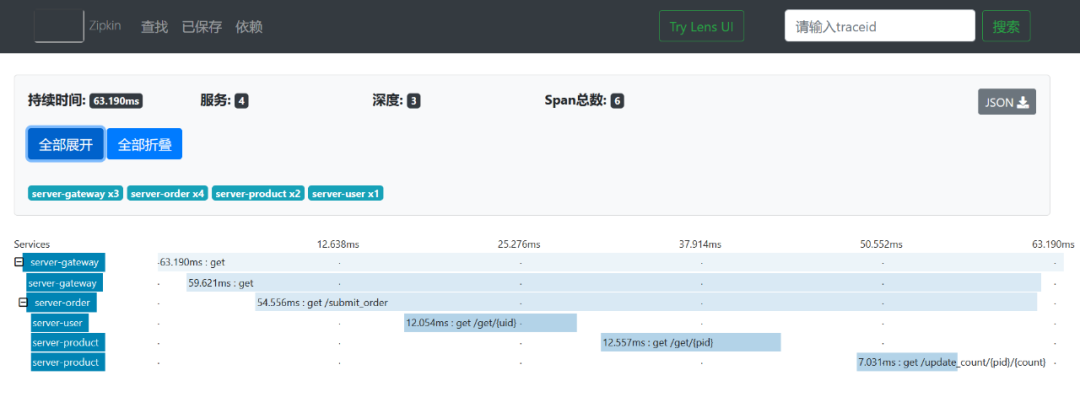
可以非常清晰的看到整个调用的访问链路。
我们还可以点击具体的节点来查看具体的调用信息。
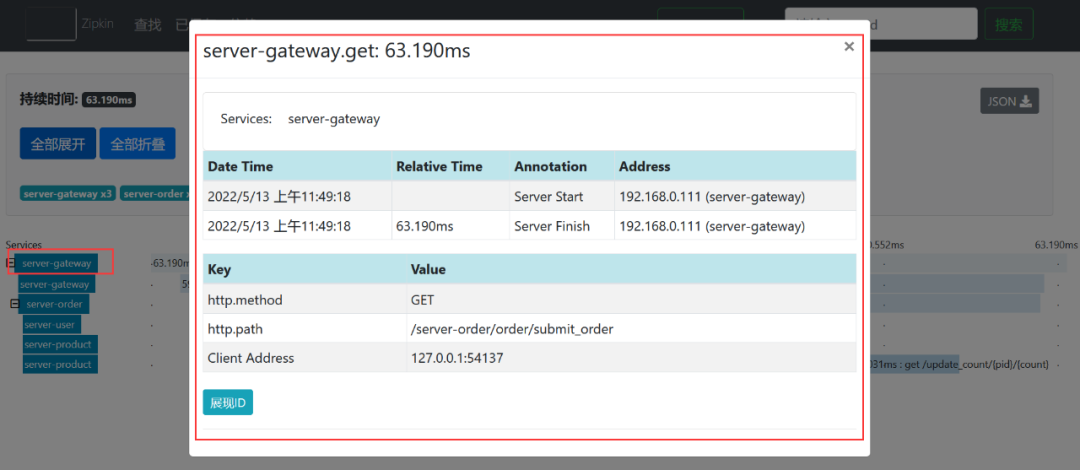
例如我们点击网关微服务查看网关的具体链路,如下所示。
点开后的效果如下所示。
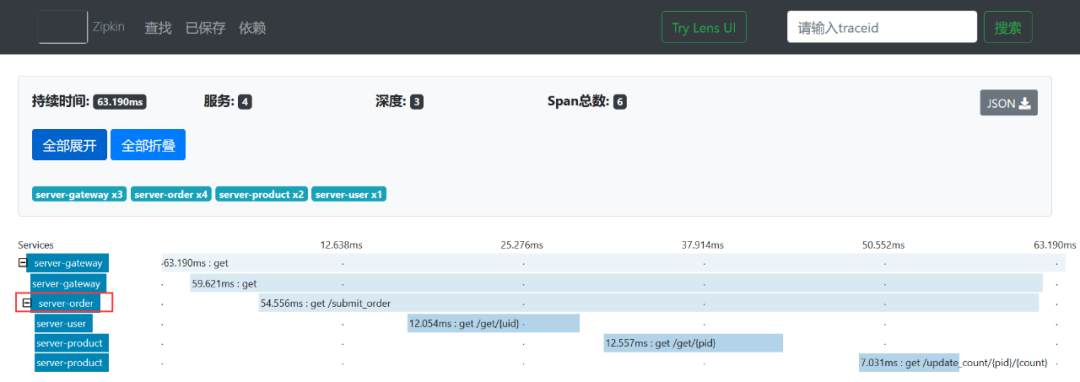
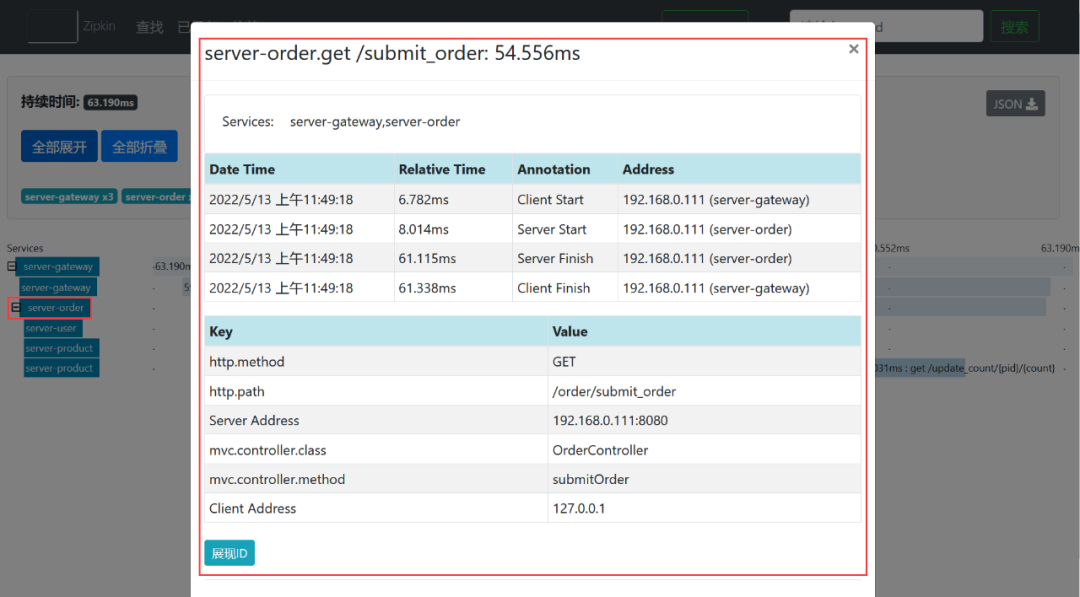
接下来,查看下订单微服务的调用链路具体信息,如下所示。
点开后的效果如下所示。
可以看到,通过ZipKin能够查看服务的调用链路,并且能够查看具体微服务的调用情况。我们可以基于ZipKin来分析系统的调用链路情况,找出系统的瓶颈点,进而进行针对性的优化。
另外,ZipKin中也支持下载系统调用链路的Json数据,如下所示。
点击JSON按钮后,效果如下所示。
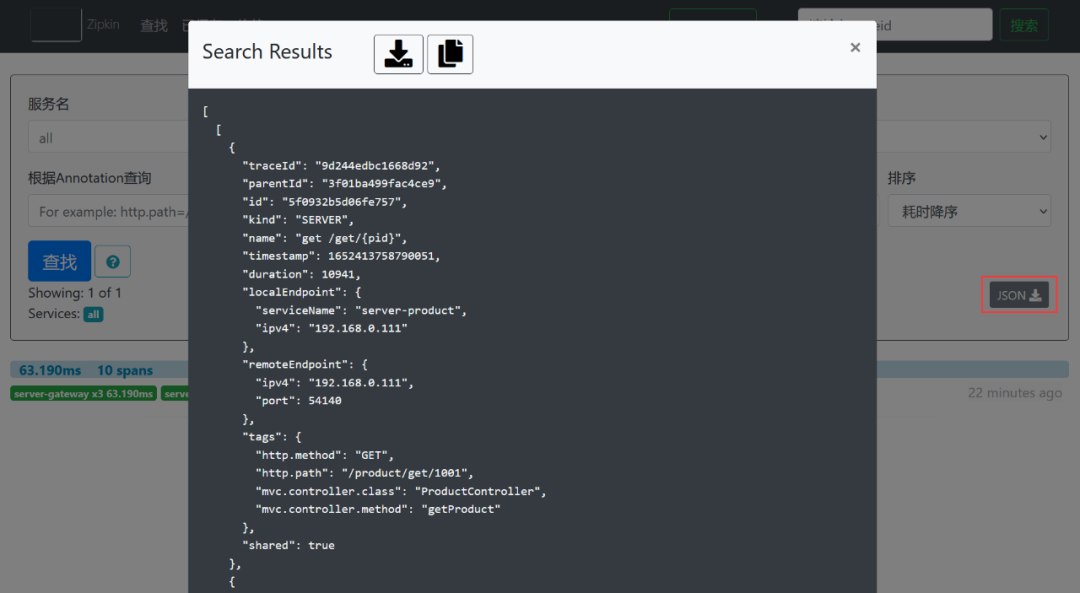
其中,显示的Json数据如下所示。
[
  [
    {
      "traceId": "9d244edbc1668d92",
      "parentId": "3f01ba499fac4ce9",
      "id": "5f0932b5d06fe757",
      "kind": "SERVER",
      "name": "get /get/{pid}",
      "timestamp": 1652413758790051,
      "duration": 10941,
      "localEndpoint": {
        "serviceName": "server-product",
        "ipv4": "192.168.0.111"
      },
      "remoteEndpoint": {
        "ipv4": "192.168.0.111",
        "port": 54140
      },
      "tags": {
        "http.method": "GET",
        "http.path": "/product/get/1001",
        "mvc.controller.class": "ProductController",
        "mvc.controller.method": "getProduct"
      },
      "shared": true
    },
    {
      "traceId": "9d244edbc1668d92",
      "parentId": "3f01ba499fac4ce9",
      "id": "c020c7f6e0fa1604",
      "kind": "SERVER",
      "name": "get /update_count/{pid}/{count}",
      "timestamp": 1652413758808052,
      "duration": 5614,
      "localEndpoint": {
        "serviceName": "server-product",
        "ipv4": "192.168.0.111"
      },
      "remoteEndpoint": {
        "ipv4": "192.168.0.111",
        "port": 54140
      },
      "tags": {
        "http.method": "GET",
        "http.path": "/product/update_count/1001/1",
        "mvc.controller.class": "ProductController",
        "mvc.controller.method": "updateCount"
      },
      "shared": true
    },
    {
      "traceId": "9d244edbc1668d92",
      "parentId": "9d244edbc1668d92",
      "id": "3f01ba499fac4ce9",
      "kind": "CLIENT",
      "name": "get",
      "timestamp": 1652413758763816,
      "duration": 54556,
      "localEndpoint": {
        "serviceName": "server-gateway",
        "ipv4": "192.168.0.111"
      },
      "remoteEndpoint": {
        "ipv4": "192.168.0.111",
        "port": 8080
      },
      "tags": {
        "http.method": "GET",
        "http.path": "/order/submit_order"
      }
    },
    {
      "traceId": "9d244edbc1668d92",
      "parentId": "9d244edbc1668d92",
      "id": "475ff483fb0973b1",
      "kind": "CLIENT",
      "name": "get",
      "timestamp": 1652413758759023,
      "duration": 59621,
      "localEndpoint": {
        "serviceName": "server-gateway",
        "ipv4": "192.168.0.111"
      },
      "tags": {
        "http.method": "GET",
        "http.path": "/order/submit_order"
      }
    },
    {
      "traceId": "9d244edbc1668d92",
      "id": "9d244edbc1668d92",
      "kind": "SERVER",
      "name": "get",
      "timestamp": 1652413758757034,
      "duration": 63190,
      "localEndpoint": {
        "serviceName": "server-gateway",
        "ipv4": "192.168.0.111"
      },
      "remoteEndpoint": {
        "ipv4": "127.0.0.1",
        "port": 54137
      },
      "tags": {
        "http.method": "GET",
        "http.path": "/server-order/order/submit_order"
      }
    },
    {
      "traceId": "9d244edbc1668d92",
      "parentId": "3f01ba499fac4ce9",
      "id": "a048eda8d5fd3dc9",
      "kind": "CLIENT",
      "name": "get",
      "timestamp": 1652413758774201,
      "duration": 12054,
      "localEndpoint": {
        "serviceName": "server-order",
        "ipv4": "192.168.0.111"
      },
      "tags": {
        "http.method": "GET",
        "http.path": "/user/get/1001"
      }
    },
    {
      "traceId": "9d244edbc1668d92",
      "parentId": "3f01ba499fac4ce9",
      "id": "5f0932b5d06fe757",
      "kind": "CLIENT",
      "name": "get",
      "timestamp": 1652413758787924,
      "duration": 12557,
      "localEndpoint": {
        "serviceName": "server-order",
        "ipv4": "192.168.0.111"
      },
      "tags": {
        "http.method": "GET",
        "http.path": "/product/get/1001"
      }
    },
    {
      "traceId": "9d244edbc1668d92",
      "parentId": "3f01ba499fac4ce9",
      "id": "c020c7f6e0fa1604",
      "kind": "CLIENT",
      "name": "get",
      "timestamp": 1652413758805787,
      "duration": 7031,
      "localEndpoint": {
        "serviceName": "server-order",
        "ipv4": "192.168.0.111"
      },
      "tags": {
        "http.method": "GET",
        "http.path": "/product/update_count/1001/1"
      }
    },
    {
      "traceId": "9d244edbc1668d92",
      "parentId": "9d244edbc1668d92",
      "id": "3f01ba499fac4ce9",
      "kind": "SERVER",
      "name": "get /submit_order",
      "timestamp": 1652413758765048,
      "duration": 53101,
      "localEndpoint": {
        "serviceName": "server-order",
        "ipv4": "192.168.0.111"
      },
      "remoteEndpoint": {
        "ipv4": "127.0.0.1"
      },
      "tags": {
        "http.method": "GET",
        "http.path": "/order/submit_order",
        "mvc.controller.class": "OrderController",
        "mvc.controller.method": "submitOrder"
      },
      "shared": true
    },
    {
      "traceId": "9d244edbc1668d92",
      "parentId": "3f01ba499fac4ce9",
      "id": "a048eda8d5fd3dc9",
      "kind": "SERVER",
      "name": "get /get/{uid}",
      "timestamp": 1652413758777073,
      "duration": 14640,
      "localEndpoint": {
        "serviceName": "server-user",
        "ipv4": "192.168.0.111"
      },
      "remoteEndpoint": {
        "ipv4": "192.168.0.111",
        "port": 54139
      },
      "tags": {
        "http.method": "GET",
        "http.path": "/user/get/1001",
        "mvc.controller.class": "UserController",
        "mvc.controller.method": "getUser"
      },
      "shared": true
    }
  ]
]
小伙伴们也可以根据Json数据分析下系统的调用链路。
ZipKin数据持久化
我们实现了在项目中集成ZipKin,但是此时我们集成ZipKin后,ZipKin中的数据是保存在系统内存中的,如果我们重启了ZipKin,则保存在系统内存中的数据就会丢失,那我如何避免数据丢失呢?ZipKin支持将数据进行持久化来防止数据丢失,可以将数据保存到ElasticSearch、Cassandra或者MySQL中。这里,我们重点介绍下如何将数据保存到MySQL和ElasticSearch中。
ZipKin数据持久化到MySQL
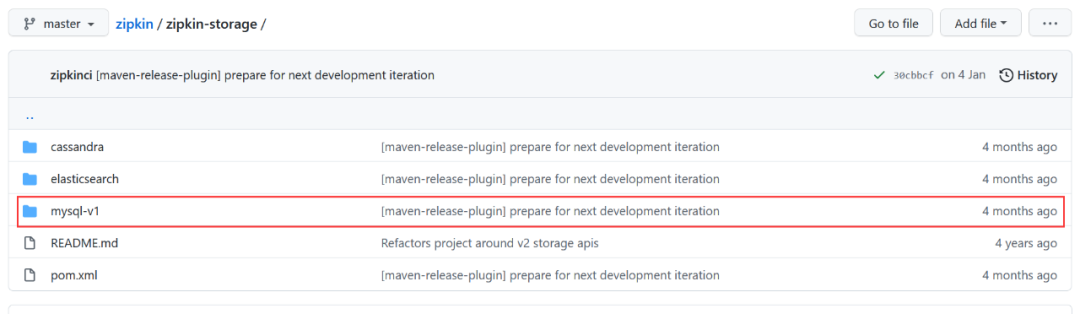
(1)将Zipkin数据持久化到MySQL,我们需要知道MySQL的数据表结构,好在ZipKin提供了MySQL脚本,小伙伴们可以在链接:https://github.com/openzipkin/zipkin/tree/master/zipkin-storage里面下载。
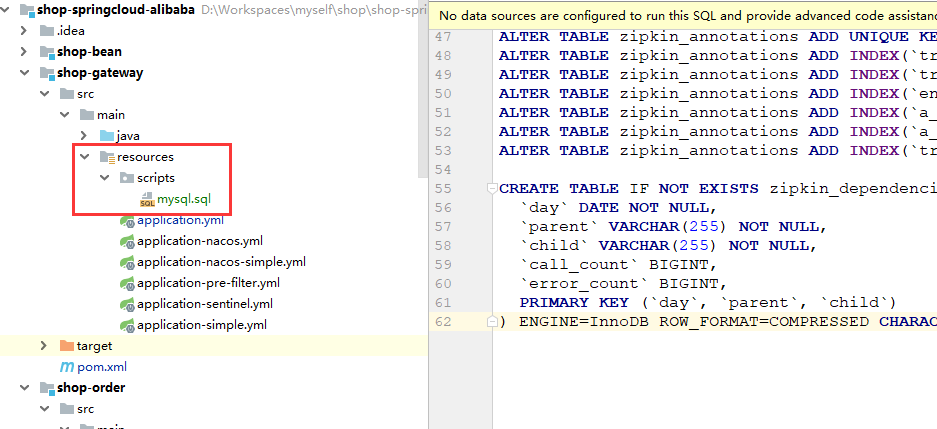
当然,我将下载后的MySQL脚本放到了网关服务shop-gateway的resources目录下的scripts目录下。
(2)在MySQL数据库中新建zipkin数据库,如下所示。
create database if not exists zipkin;(3)在新建的数据库zipkin中运行mysql.sql脚本,运行脚本后的效果如下所示。
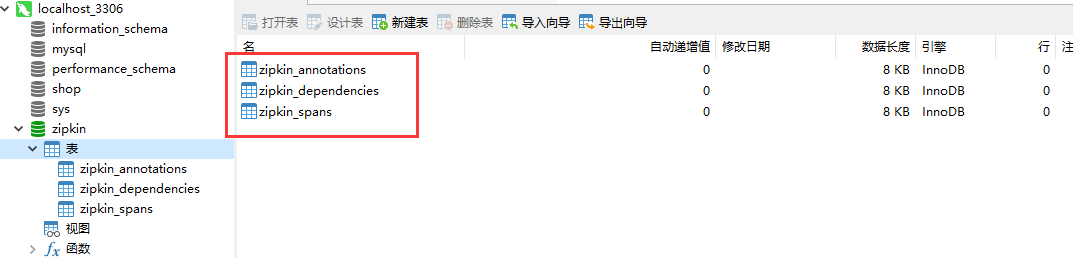
可以看到,在zipkin数据库中新建了zipkin_annotations、zipkin_dependencies和zipkin_spans三张数据表。
(4)启动ZipKin时指定MySQL数据源,如下所示。
java -jar zipkin-server-2.12.9-exec.jar --STORAGE_TYPE=mysql --MYSQL_HOST=127.0.0.1 --MYSQL_TCP_PORT=3306 --MYSQL_DB=zipkin --MYSQL_USER=root --MYSQL_PASS=root(5)启动ZipKin后,在浏览器中访问链接http://localhost:10001/server-order/order/submit_order?userId=1001&productId=1001&count=1,如下所示。

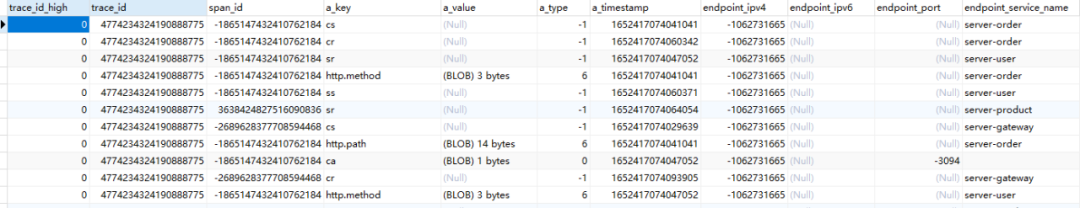
(6)查看zipkin数据库中的数据,发现zipkin_annotations数据表与zipkin_spans数据表已经存在系统的调用链路数据。
zipkin_annotations数据表部分数据如下所示。
zipkin_spans数据表部分数据如下所示。
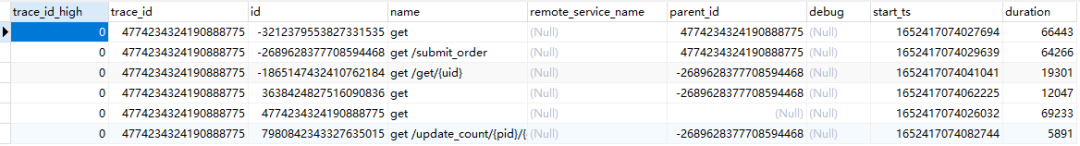
可以看到,ZipKin已经将数据持久化到MySQL中,重启ZipKin后就会从MySQL中读取数据,数据也不会丢失了。
ZipKin数据持久化到ElasticSearch
(1)到ElasticSearch官网下载ElasticSearch,链接为:
https://www.elastic.co/cn/downloads/elasticsearch。
这里下载的安装包是:elasticsearch-8.2.0-windows-x86_64.zip。
(2)解压elasticsearch-8.2.0-windows-x86_64.zip,在解压后的bin目录下找到elasticsearch.bat脚本,双击运行ElasticSearch。
(3)启动ZipKin服务端时,指定ElasticSearch,如下所示。
java -jar zipkin-server-2.12.9-exec.jar --STORAGE_TYPE=elasticsearch --ESHOST=localhost:9200(4)启动ZipKin服务端后,在浏览器中访问链接http://localhost:10001/server-order/order/submit_order?userId=1001&productId=1001&count=1,如下所示。

ZipKin就会将请求的链路信息保存到ElasticSearch中进行持久化。
Recommend
About Joyk
Aggregate valuable and interesting links.
Joyk means Joy of geeK