

如何用十行 bash shell 脚本监控 Linux?-51CTO.COM
source link: https://os.51cto.com/article/707927.html
Go to the source link to view the article. You can view the picture content, updated content and better typesetting reading experience. If the link is broken, please click the button below to view the snapshot at that time.

监控我们的环境对于服务器运维来说至关重要,尤其是在部署新的应用程序时。如今,公司每天都使用开源解决方案来监控系统资源。但是,当出于测试的目的来监控一定时间时,bash 脚本会派上用场。
在本教程中,我们将编写一个 bash shell 脚本,它将输出一个三列表,来显示我们机器上的内存、磁盘和 CPU 的百分比。
让我们开始吧!
该脚本基本上由三个主要部分组成:
1. 监控内存:
free -m | awk 'NR==2{printf "%.2f%%\t\t", $3*100/$2 }'
9.24%
free -m 是用于显示已使用和空闲内存的命令,输出如下:
[root@localhost tmp]# free -m
             total       used       free     shared    buffers     cached
Mem:           996         92        904          0         11         31
-/+ buffers/cache:         49        947
Swap:         1583          0       1583
但是,我们需要从上面的输出中获取第二行的总内存和已用内存。我们可以使用 AWK 来从给定输出中提取数据。
AWK 是一种用于文本处理和数据提取的编程语言。它是大多数 UNIX 系统的标准功能。awk ‘NR==2’ 从第二行提取数据。$3 和 $2 分别充当已用量和总量。
df -h | awk '$NF=="/"{printf "%s\t\t", $5}'
7%
第二个命令输出使用的磁盘百分比。df -h 输出与磁盘使用情况和分区相关的数据。
[root@localhost tmp]# df -h
Filesystem                    Size  Used Avail Use% Mounted on
/dev/mapper/VolGroup-lv_root   14G  814M   12G   7% /
tmpfs                         499M     0  499M   0% /dev/shm
/dev/sda1                     485M   32M  428M   7% /boot
awk $NF 输出字段数。但是,df -h | awk '$NF=="/" 将转到包含字符 / 的那一行。$5 将从该行中选择第 5 个字段。这可确保该命令能够提取正确的磁盘使用百分比(在我们的示例中为 %7)。
监控 CPU
top -bn1 | grep load | awk '{printf "%.2f%%\t\t\n", $(NF-2)}'
top -bn1 命令将只执行一次 top 命令(n1 = 一次迭代),当我们想在 bash 脚本中使用 top 或将其数据输出到文件时使用可以使用 -b 选项。
grep load 将输出包含字符串 load 的行。$(NF-2) 将计算该行上的字段数并减 2。
[root@localhost tmp]# top -bn1 | grep load
top - 19:31:25 up  1:47,  1 user,  load average: 0.00, 0.00, 0.00
在浏览完 bash 脚本的基本部分之后,我们需要将这些命令保存到变量 MEMORY、DISK 和 CPU 中:
MEMORY=$(free -m | awk 'NR==2{printf "%.2f%%\t\t", $3*100/$2 }')
DISK=$(df -h | awk '$NF=="/"{printf "%s\t\t", $5}')
CPU=$(top -bn1 | grep load | awk '{printf "%.2f%%\t\t\n", $(NF-2)}')
我们需要脚本运行一段时间(比如,一个小时)。为了做到这一点,我们需要使用 while do 循环,每次循环后延迟 x 秒(取决于您的测试):
end=$((SECONDS+3600))
while [ $SECONDS -lt $end ]; do
echo "$MEMORY$DISK$CPU"
sleep 5
done
为了在一定时间内运行一次循环,我们可以定义一个变量 $end,它从 bash 脚本开始的时间开始计算当前的秒数,因此是 SECONDS,并在当前秒数上加上一个数字。所以一个小时就是 3600 秒。
上述代码片段的第二行指出,只要$SECONDS(当前秒数)小于 $SECONDS+3600,while 循环就会继续执行。因此,我们定义了循环的开始时间和结束时间,以及将每个循环暂停 5 秒的睡眠时间。循环内部是每 5 秒将那三个变量分配一次新值,以及将输出三个资源使用情况的 echo "$MEMORY$DISK$CPU"。
完整代码如下:
#! /bin/bash
printf "Memory\t\tDisk\t\tCPU\n"
end=$((SECONDS+3600))
while [ $SECONDS -lt $end ]; do
MEMORY=$(free -m | awk 'NR==2{printf "%.2f%%\t\t", $3*100/$2 }')
DISK=$(df -h | awk '$NF=="/"{printf "%s\t\t", $5}')
CPU=$(top -bn1 | grep load | awk '{printf "%.2f%%\t\t\n", $(NF-2)}')
echo "$MEMORY$DISK$CPU"
sleep 5
done
上面的代码将输出以下内容:
[root@localhost tmp]# ./stats.sh
Memory Disk CPU
9.34% 7% 0.00%
9.34% 7% 0.00%
9.34% 7% 0.00%
9.34% 7% 0.00%
^C[root@localhost tmp]#
您始终可以将数据输出到日志文件:
[root@localhost tmp]# ./stats.sh >> log.txt
Stress 测试
由于机器上几乎没有任何负载,我们可以使用 stress 来使 CPU 和内存负载一段时间。
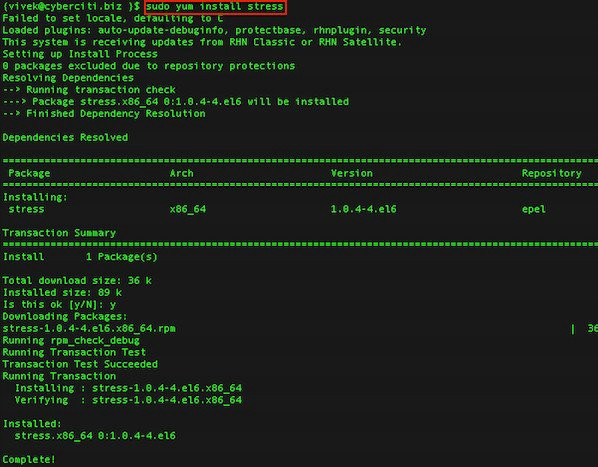
使用以下命令安装(在 CentOS 上):
[root@localhost tmp]# yum install stress
Failed to set locale, defaulting to C
Loaded plugins: fastestmirror
Determining fastest mirrors
epel/metalink                                                               | 4.2 kB     00:00
 * base: ba.mirror.garr.it
 * epel: ftp.riken.jp
 * extras: centos.fastbull.org
 * updates: centos.fastbull.org
base                                                                        | 3.7 kB     00:00
epel                                                                        | 4.3 kB     00:00
epel/primary_db                                                             | 5.9 MB     00:37
extras                                                                      | 3.4 kB     00:00
extras/primary_db                                                           |  37 kB     00:00
updates                                                                     | 3.4 kB     00:00
updates/primary_db                                                          | 5.2 MB     00:30
Setting up Install Process
Resolving Dependencies
--> Running transaction check
---> Package stress.x86_64 0:1.0.4-4.el6 will be installed
--> Finished Dependency Resolution
Dependencies Resolved
===================================================================================================
 Package               Arch                  Version                     Repository           Size
===================================================================================================
Installing:
 stress                x86_64                1.0.4-4.el6                 epel                 36 k
Transaction Summary
===================================================================================================
Install       1 Package(s)
Total download size: 36 k
Installed size: 89 k
Is this ok [y/N]: y
Downloading Packages:
stress-1.0.4-4.el6.x86_64.rpm                                               |  36 kB     00:01
Running rpm_check_debug
Running Transaction Test
Transaction Test Succeeded
Running Transaction
  Installing : stress-1.0.4-4.el6.x86_64                                                       1/1
  Verifying  : stress-1.0.4-4.el6.x86_64                                                       1/1
Installed:
  stress.x86_64 0:1.0.4-4.el6
Complete!
现在我们可以使用命令 stress 来负载我们的机器。例如,通过指定两个 CPU 密集型进程、一个 I/O 密集型进程和一个内存分配器进程,对系统施加 4 个平均负载,如下所示。以下压力测试将运行 1 小时。
[root@localhost tmp]# stress -c 2 -i 1 -m 1 --vm-bytes 128M -t 3600s
stress: info: [1574] dispatching hogs: 2 cpu, 1 io, 1 vm, 0 hdd
stress: info: [1574] successful run completed in 3600s
[root@localhost tmp]# ./stats.sh
Memory  Disk  CPU
20.48%  7%  1.21%
20.48%  7%  1.02%
20.48%  7%  0.94%
21.89%  7%  1.18%
20.68%  7%  1.41%
22.09%  7%  1.62%
24.10%  7%  1.81%
24.90%  7%  1.98%
32.93%  7%  2.14%
30.32%  7%  2.29%
20.58%  7%  2.63%
27.91%  7%  2.82%
20.48%  7%  2.59%
20.48%  7%  2.38%
20.48%  7%  2.19%
20.48%  7%  2.02%
20.48%  7%  1.86%
关于如何为所有系统管理员创建一个非常容易且有用的 bash 脚本的教程到此结束。
Recommend
About Joyk
Aggregate valuable and interesting links.
Joyk means Joy of geeK