

Using XML Policies to Log and Analyze API Calls - DZone Microservices
source link: https://dzone.com/articles/how-log-and-analyze-api-calls-from-azure-api-manag
Go to the source link to view the article. You can view the picture content, updated content and better typesetting reading experience. If the link is broken, please click the button below to view the snapshot at that time.

Using XML Policies to Log and Analyze API Calls from Azure API Management
Follow this tutorial on how to add API logging and monitoring to Azure API Management (APIM) using XML policies without any code changes or restarts.
Join the DZone community and get the full member experience.
Join For FreeAzure API Management (APIM) is a powerful platform that enables you to publish and scale APIs while ensuring they are secured. One of the great features of Azure APIM is that you can add plugins and transforms to your APIs without any code changes or restarts.
These capabilities are deployed using XML Policies which are a collection of statements. Moesif API Observability can be added in just a few minutes using an XML policy for APIM which makes it easy to get visibility into API calls, even ones that are rejected and never reach your underlying service.
What Is API Observability for Azure APIM?
API Observability enables engineering and business to deeply understand how their APIs are used and identify what needs to be fixed before customers email support and overwhelm your team. Unlike classic API monitoring which usually probes an endpoint for typical “Red, Yellow, Green” status, API Observability enables leaders to observe any behavior happening with the API. Some examples include:
- Product owners to understand API usage and what to focus on
- Engineering leaders to stay informed of and troubleshoot API issues
- Security researchers to investigate API threats and prevent them
How Does This Solution Work?
In order for API Observability to work, a monitoring agent needs to passively log API traffic to an observability service. This can be a custom build on a data warehouse like Azure Synapse Analytics or a turnkey solution like Moesif. An API Gateway like Azure APIM provides a natural point to centralize API logs. Otherwise, each service would need to have its own SDK.
This solution is deployed using an Azure Resource Manager Template, which automatically adds a few components to your Azure subscription:
A diagram is below showing how the solution is deployed in your Azure subscription.
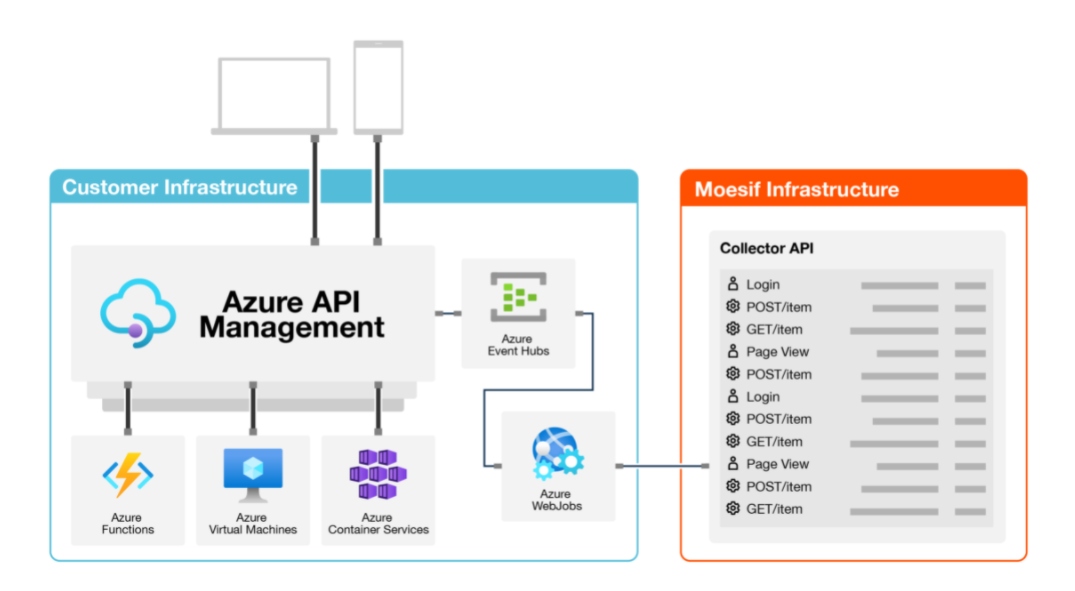
Once the API logs are received by Moesif, the rest of the data processing and analytics is handled by the service.
Use Cases
Understand Customer API Usage
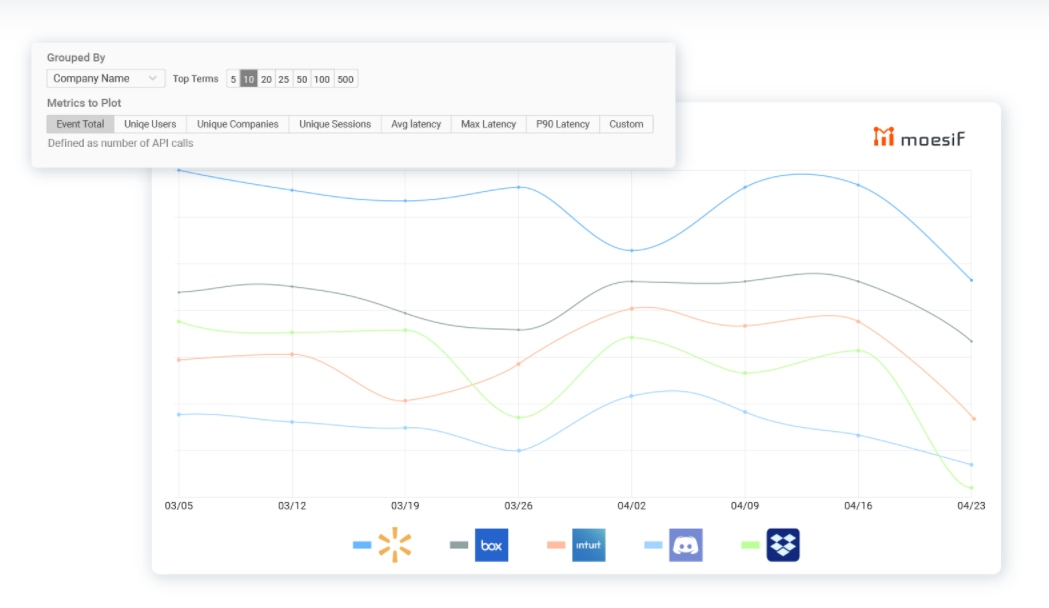
A goal for API analytics is to gain an understanding of who is using your APIs and how they use them. To enable this, the integration will automatically associate API calls to specific user profiles. By default, The XML policy will also extract user info like the User Id, First Name, and Email from the context.User object and saved as part of a user profile in Moesif. You can always add additional user properties using Moesif’s user tracking.
A critical report is understanding which customers are using your APIs the most. Because we are tracking name and email, we can open a report in Moesif showing weekly API traffic by company name.
Troubleshooting Issues
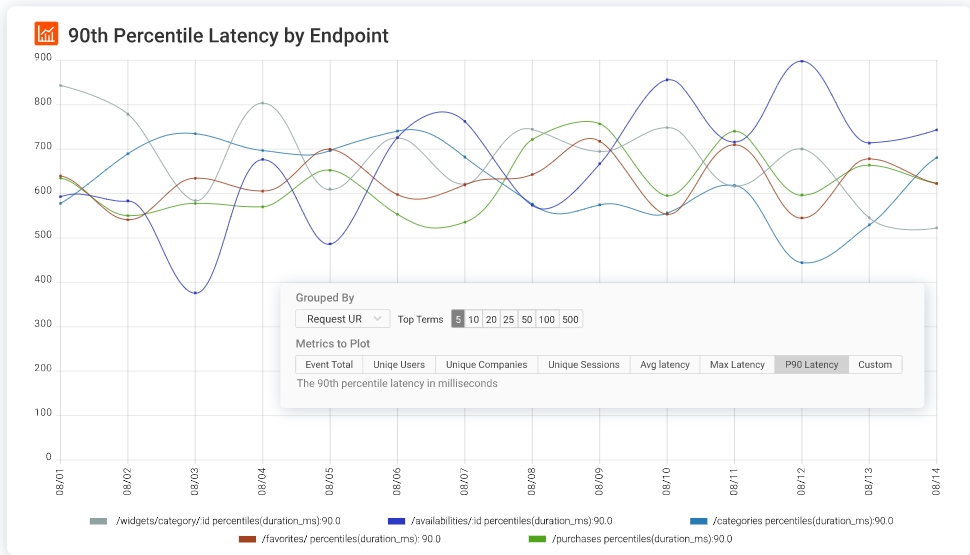
With high-cardinality, high-dimension API observability, you can slice and dice your API logs by any number of fields such as the URI Route, HTTP headers, and even fields in the payload enabling you to drill into issues impacting customers. One such metric we recommend monitoring is the 90th percentile. Unlike average latency, by looking at 90th percentile latency, you can better see large variations in your latency which is usually worse for customers than an API that’s consistently high latency. An API with seamlessly random latency spikes can wreak havoc on its own services.
To do this, go to Events -> Time series and then select the metric P90 Latency. You can also understand this broken down by route or service. To do so, add a group by “Request URI.” Moesif consolidated routes such that /items/1 and /items/2 will show up as /items/:id in the UI which makes it easier for your analysis.
Research Threats
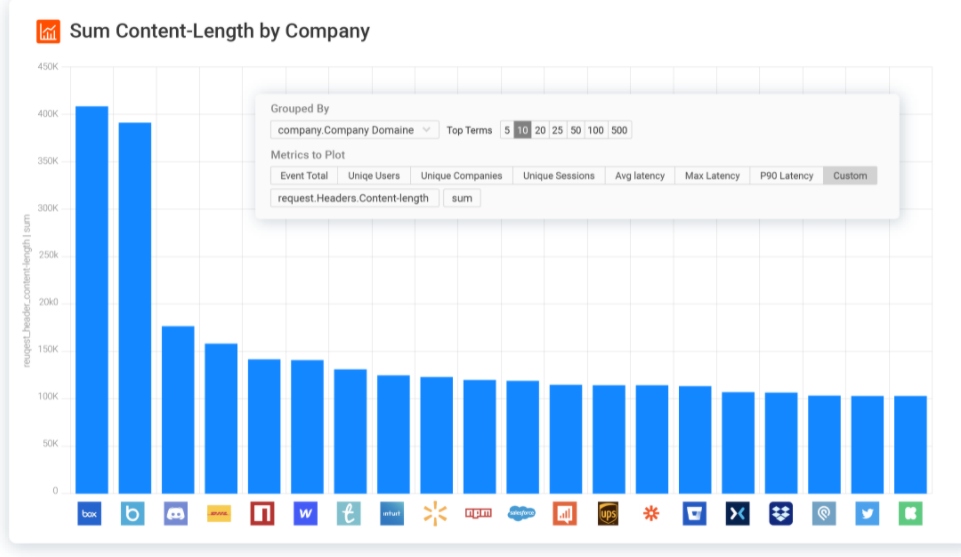
As you expose more APIs to the internet used by customers, partners, and single-page apps, your security risk goes up. Traditional mechanisms like browser fingerprinting and captchas don’t work so you need to leverage advanced user behavior analytics to find suspicious users.
A common API security threat is not having proper protection from data scraping and intentional API abuse. An API provides direct access to your data which a hacker can use to scrape. One way to detect customers abusing your API is to look at the amount of data accessed per user. To create this metric, add a summation of response.headers.Content-Length and then group it by user’s name:
How To Set Up Azure APIM With Moesif API Observability
1. Start Azure Resource Deployment
Click here to start a Custom deployment with the Moesif Azure Resource Template.
2. Configure Parameters
Within the Azure Template Deployment panel, set the following properties:
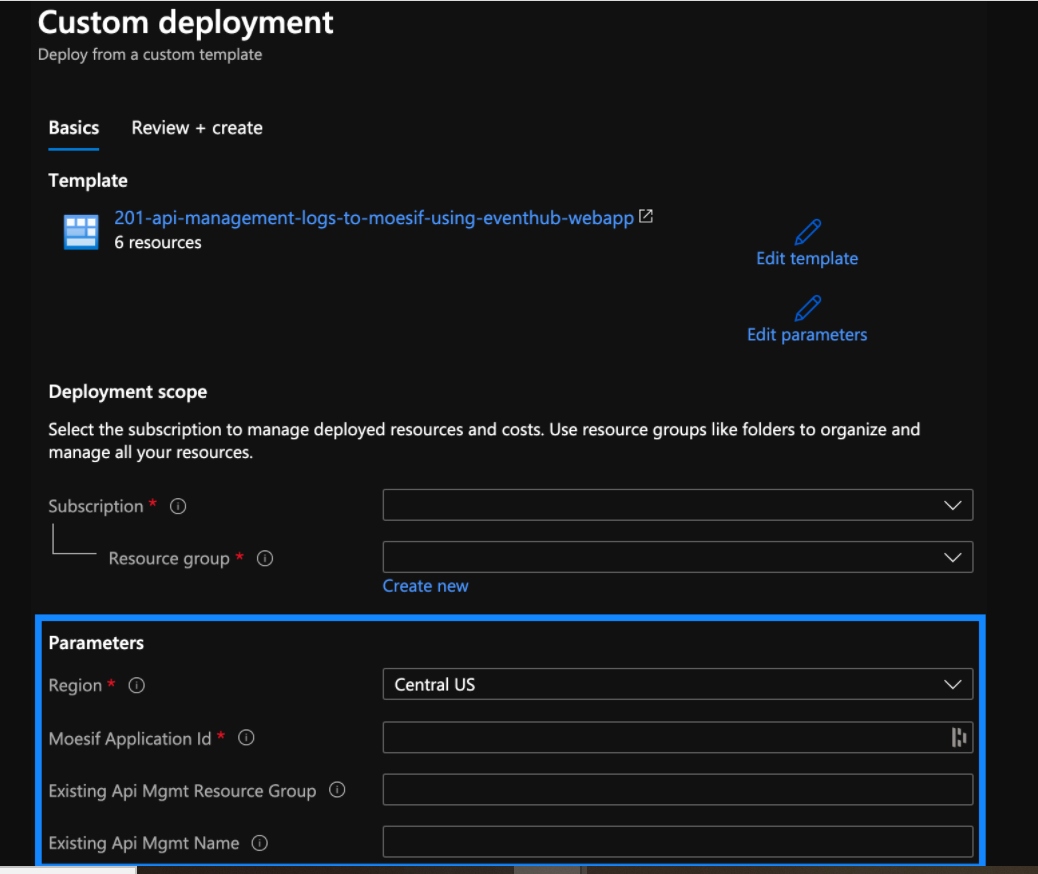
Set Resource group to the same resource group that contains your exiting Azure APIM instance. This ensures the APIM logger,
moesif-log-to-event-hub, is automatically created for you.Set Moesif Application Id to the one displayed after logging into your Moesif account. You can create a free one on Moesif’s website.
Set Existing Api Mgmt Name to the name of your Azure APIM instance. If blank, you will need to manually create the APIM logger.
Once done, click the Review+create button at the bottom and finish the template creation wizard.
Occasionally, Azure reports a failed deployment due to slow propagation of new DNS settings even though everything was deployed successfully. We recommend proceeding with rest of process. If you still have issues after last step, view troubleshooting.
3. Add XML Policy
Within the Azure portal, navigate to your existing Azure API Management instance. Then, add the below XML policies to all products or APIs that you want API logging enabled.
It’s recommended to add the XML policy globally for all APIs. Then, use Moesif dynamic sampling if you want to create rules that selectively sample or suppress data collection. Rules are dynamically enabled based on specific customer behaviors, regex rules, and more.
More info on editing APIM policies is available on the Azure docs.
<policies>
<inbound>
<base />
<set-variable name="moesif-message-id" value="@(Guid.NewGuid())" />
<log-to-eventhub logger-id="moesif-log-to-event-hub" partition-id="0">@{
var body = context.Request.Body?.As<string>(true);
var MAX_BODY_EH = 145000;
var origBodyLen = (null != body) ? body.Length : 0;
if (MAX_BODY_EH < origBodyLen){ body = body.Remove(MAX_BODY_EH); }
var headers = context.Request.Headers
.Where(h => h.Key != "Ocp-Apim-Subscription-Key")
.Select(h => string.Format("{0}: {1}", h.Key, String.Join(", ", h.Value).Replace("\"", "\\\""))).ToArray<string>();
var jwtToken = context.Request.Headers.GetValueOrDefault("Authorization","").AsJwt();
var userId = (context.User != null && context.User.Id != null) ? context.User.Id : (jwtToken != null && jwtToken.Subject != null ? jwtToken.Subject : string.Empty);
var cru = new JObject();
if (context.User != null) {
cru.Add("Email", context.User.Email);
cru.Add("Id", context.User.Id);
cru.Add("FirstName", context.User.FirstName);
cru.Add("LastName", context.User.LastName);}
var crus = System.Convert.ToBase64String(Encoding.UTF8.GetBytes(cru.ToString()));
var requestBody = (body != null ? System.Convert.ToBase64String(Encoding.UTF8.GetBytes(body)) : string.Empty);
return new JObject(
new JProperty("event_type", "request"),
new JProperty("message-id", context.Variables["moesif-message-id"]),
new JProperty("method", context.Request.Method),
new JProperty("ip_address", context.Request.IpAddress),
new JProperty("uri", context.Request.OriginalUrl.ToString()),
new JProperty("user_id", userId),
new JProperty("contextRequestUser", crus),
new JProperty("company_id", ""),
new JProperty("request_headers", string.Join(";;", headers)),
new JProperty("request_body", requestBody),
new JProperty("contextTimestamp", context.Timestamp.ToString("o")),
new JProperty("metadata", $@"")
).ToString();}</log-to-eventhub>
<set-variable name="sent-moesif-request" value="@(true)" />
</inbound>
<backend>
<forward-request follow-redirects="true" />
</backend>
<outbound>
<base />
<choose>
<when condition="@(context.Variables.ContainsKey("sent-moesif-request") && !context.Variables.ContainsKey("sent-moesif-response"))">
<log-to-eventhub logger-id="moesif-log-to-event-hub" partition-id="1">@{
var body = context.Response.Body?.As<string>(true);
var MAX_BODY_EH = 145000;
var origBodyLen = (null != body) ? body.Length : 0;
if (MAX_BODY_EH < origBodyLen){ body = body.Remove(MAX_BODY_EH);}
var headers = context.Response.Headers.Select(h => string.Format("{0}: {1}", h.Key, String.Join(", ", h.Value).Replace("\"", "\\\""))).ToArray<string>();
var responseBody = (body != null ? System.Convert.ToBase64String(Encoding.UTF8.GetBytes(body)) : string.Empty);
return new JObject(
new JProperty("event_type", "response"),
new JProperty("orig_body_len", origBodyLen),
new JProperty("message-id", context.Variables["moesif-message-id"]),
new JProperty("status_code", context.Response.StatusCode),
new JProperty("response_headers", string.Join(";;", headers)),
new JProperty("contextTimestamp", context.Timestamp.Add(context.Elapsed).ToString("o")),
new JProperty("response_body", responseBody)
).ToString();}</log-to-eventhub>
<set-variable name="sent-moesif-response" value="@(true)" />
</when>
</choose>
</outbound>
<on-error>
<base />
<choose>
<when condition="@(context.Variables.ContainsKey("sent-moesif-request") && !context.Variables.ContainsKey("sent-moesif-response"))">
<log-to-eventhub logger-id="moesif-log-to-event-hub" partition-id="1">@{
var body = context.Response.Body?.As<string>(true);
var MAX_BODY_EH = 145000;
var origBodyLen = (null != body) ? body.Length : 0;
if (MAX_BODY_EH < origBodyLen){ body = body.Remove(MAX_BODY_EH);}
var headers = context.Response.Headers.Select(h => string.Format("{0}: {1}", h.Key, String.Join(", ", h.Value).Replace("\"", "\\\""))).ToArray<string>();
var responseBody = (body != null ? System.Convert.ToBase64String(Encoding.UTF8.GetBytes(body)) : string.Empty);
return new JObject(
new JProperty("event_type", "response"),
new JProperty("orig_body_len", origBodyLen),
new JProperty("message-id", context.Variables["moesif-message-id"]),
new JProperty("status_code", context.Response.StatusCode),
new JProperty("response_headers", string.Join(";;", headers)),
new JProperty("contextTimestamp", context.Timestamp.Add(context.Elapsed).ToString("o")),
new JProperty("response_body", responseBody)
).ToString();}</log-to-eventhub>
<set-variable name="sent-moesif-response" value="@(true)" />
</when>
</choose>
</on-error>
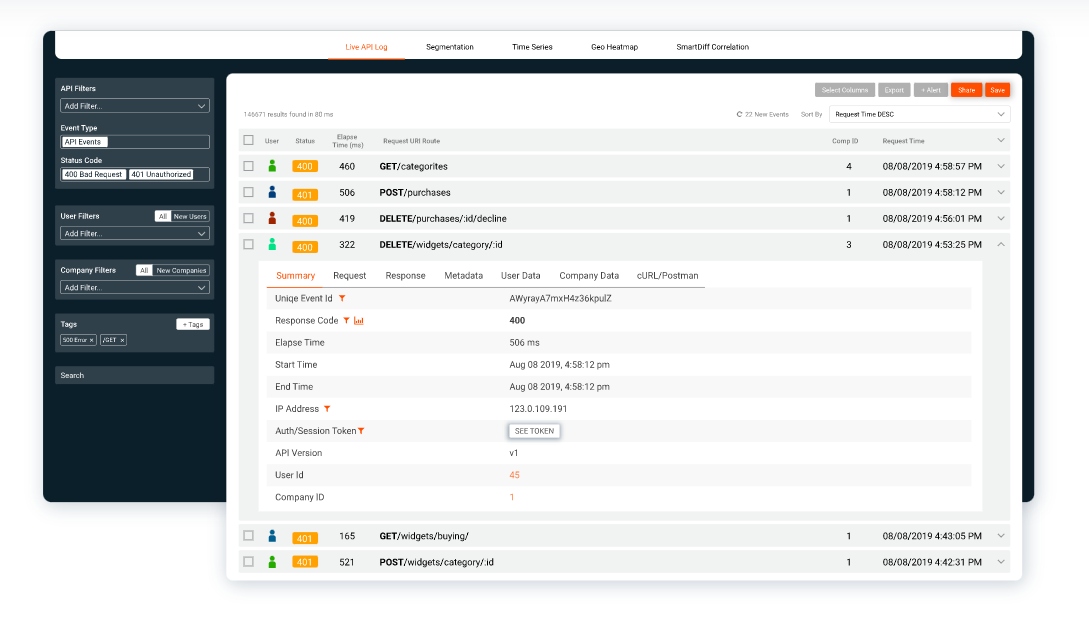
</policies>4. Success!
With the Azure APIM integration done, you should see your API logs show up in Moesif. Make a few calls against your API Gateway domain and see them show up in Moesif’s event log in real-time. You should see the status code, URL, and other HTTP parameters as captured in the below screenshot:
Identifying Users
API calls are associated to users using the field user_id. The default XML policy extracts this from the context.User.Id or the JWT Token using the following logic:
var jwtToken = context.Request.Headers.GetValueOrDefault("Authorization","").AsJwt();
var userId = (context.User != null && context.User.Id != null) ? context.User.Id : (jwtToken != null && jwtToken.Subject != null ? jwtToken.Subject : null);
You can modify what the userId is by changing these lines of code.
Adding User Metadata
By default, the XML policy also saves some helpful user properties like Email and FirstName using the following code in the XML Policy:
if (context.User != null) {  cru.Add("Email", context.User.Email);  cru.Add("FirstName", context.User.FirstName);  cru.Add("LastName", context.User.LastName);
}
var crus = System.Convert.ToBase64String(Encoding.UTF8.GetBytes(cru.ToString()));
These will be saved with the user profile in Moesif that matches the defined userId. You can add additional fields from the context.User to meet your requirements by changing these lines of code.
Adding Event Metadata
You can also save event metadata. Unlike user metadata, event metadata is specific to each API transaction and can contain helpful info not already logged by Moesif such as trace ids or environment variables. The metadata field should be a JSON encoded string.
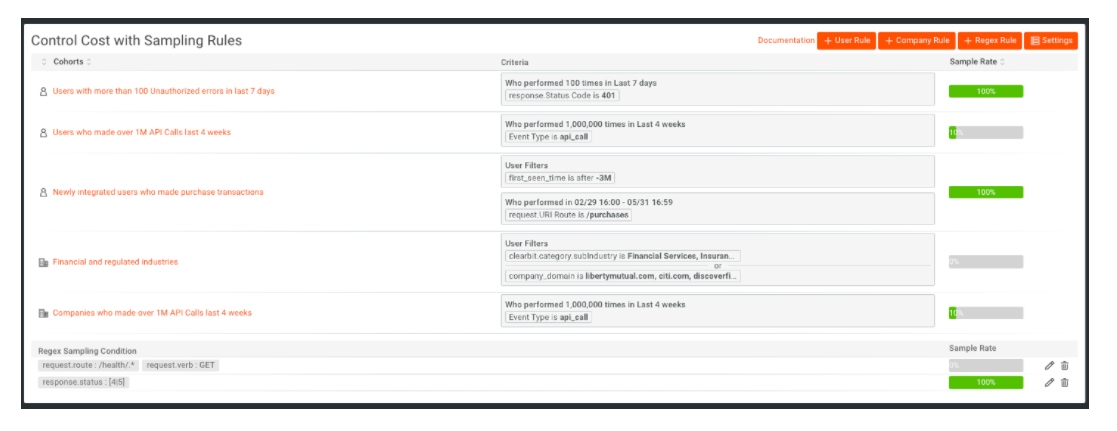
Sampling Requests
This integration also supports dynamic sampling. This enables you to selectively sample API calls based on user behavior to save on your Moesif subscription cost. Moesif will still extrapolate the original metrics.
Advanced User Behavior API Analytics
You can leverage your integration beyond just looking at API calls in isolation and stitch your entire customer journey together. This approach makes it easier to see things like funnel reports on “Time to First Hello World” and “Time to Value.”
Track user actions in your UI such as “Signed In” or “Viewed Docs” and start tracking user actions in your UI like “Signed In” or “Viewed Docs”. This makes it easier to slice and dice API usage by customer traffics. In order to do so, add the moesif-browser-js to your UI and call the track method:
moesif.track('Clicked Sign Up', {  button_label: 'Get Started',  sign_up_method: 'Google SSO'
});
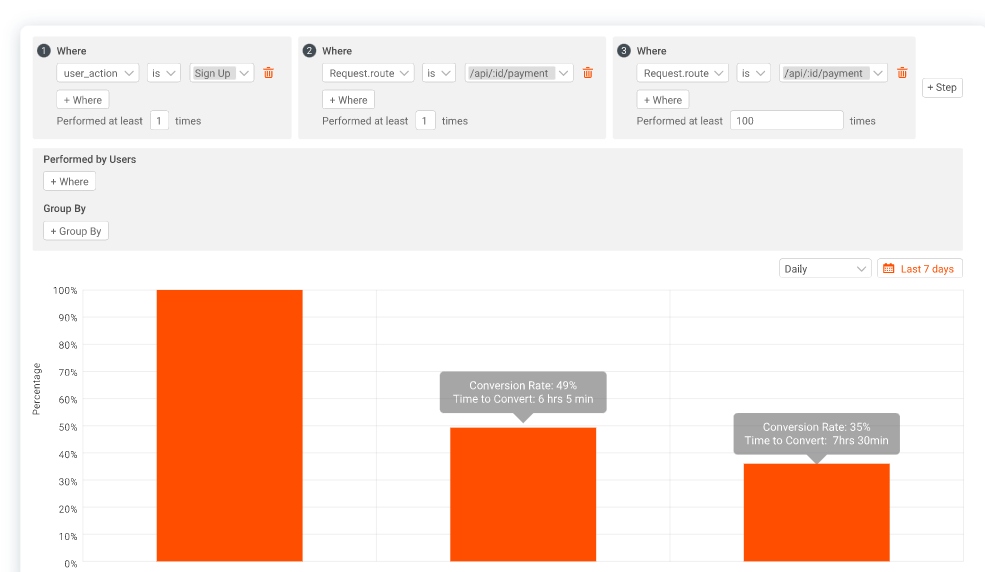
Once done, the first thing you should do is generate a funnel report. In the below report, we created a funnel analysis composed of three steps.
- The first step is a customer signing in to your web application (a user action).
- The second step is a single payment transaction via the API; thus, moving from step 1 to step 2 shows the conversion rate of sign-ups to the first API call.
- The third step is over 100 payment transactions. For this example, we consider this the “aha” moment demonstrating customer value. Moving from step 2 to step 3 shows the drop-off of customers who made API calls who actually got to see real value.
Conclusion
API observability is critical for engineering and business leaders to make informed decisions on what to focus on and where issues are. While you can roll your own API gateway, data processing pipeline, and data warehouse, this can create a massive time sink for your engineering team. Using fully managed services like Azure API Management API Gateway and Moesif API Analytics can help you scale without being held back by legacy infrastructure.
Recommend
About Joyk
Aggregate valuable and interesting links.
Joyk means Joy of geeK