

How BASF Agricultural Solutions Uses New Relic | New Relic
source link: https://newrelic.com/blog/how-to-relic/how-basf-uses-new-relic
Go to the source link to view the article. You can view the picture content, updated content and better typesetting reading experience. If the link is broken, please click the button below to view the snapshot at that time.

How BASF Agricultural Solutions Uses New Relic Skip to main content
As Head of IT Solutions Delivery Europe at BASF Agricultural Solutions Department, Leif Geiger is responsible for ensuring the delivery and operations of all kinds of digital solutions to his stakeholders. Leif explains how building a central interface on New Relic was key for the team to see the health of all applications in one overview and to be able to communicate business KPIs to various stakeholders.
In the Digital Agriculture Solutions team at BASF, there are hundreds of applications to support and a digital roadmap of new features and functionality to deliver. But we often find ourselves tied up in identifying and troubleshooting software issues.
We envisioned a way to continuously see the health and performance of every application we needed to monitor, within one interface. We soon came to a goal to streamline and automate the monitoring of our apps and the application environment. This goal became central to our monitoring initiative.
At BASF, we create chemistry for a sustainable future. We combine economic success with environmental protection and social responsibility. Around 111,000 employees in the BASF Group contribute to the success of our customers in nearly all sectors and almost every country in the world. Our portfolio comprises six segments: Chemicals, Materials, Industrial Solutions, Surface Technologies, Nutrition & Care and Agricultural Solutions. BASF generated sales of €78.6 billion in 2021. BASF shares are traded on the stock exchange in Frankfurt (BAS) and as American Depositary Receipts (BASFY) in the U.S. You can learn more at www.basf.com.
Connecting business KPIs and cloud environments in real-time
First, we had to determine the tech to help us achieve our monitoring objectives. We quickly discovered that the monitoring solution we were currently using was great at technical KPIs and drag and drop scenarios, but it lacked some crucial functionalities to create custom dashboards. We also needed visibility across business KPIs that correlate with our cloud environments—to see things like our server health and the number of active users at any given time.
This led us to New Relic. The New Relic observability platform gave us a real-time view of all the telemetry data we need in one place. It centralized our information from multiple cloud environments and supported custom apps to maximize flexibility. With New Relic, we could create our own custom apps and even integrate other monitoring tools into our environment.
Previously, we had been trying to execute our vision for over a year—but failed. One of the key differences that New Relic gave us was the exemplary support we received.
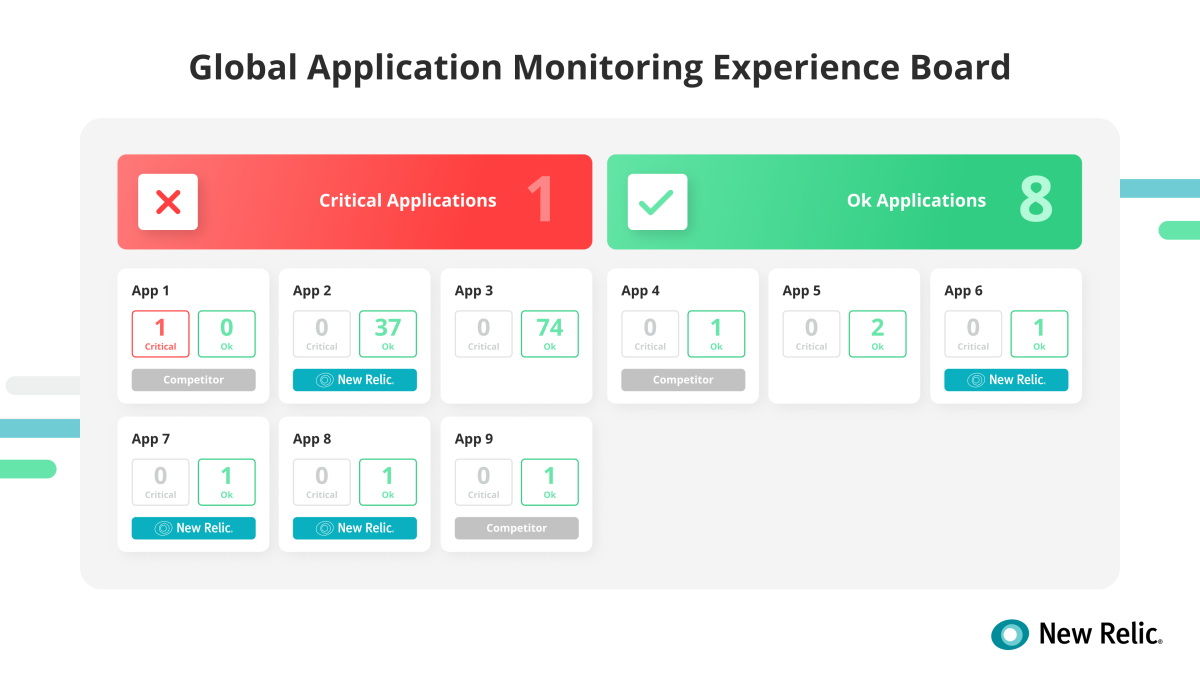
GAME Board is part of BASF's observability initiative, built by New Relic and BASF engineers. GAME Board gives BASF an instant view of which applications are running in a healthy state and which aren't working at all. When an issue impacts an application, engineers get immediate alerts to get the situation corrected before it affects users and the BASF user experience.
Building a custom application with New Relic engineers
As part of our monitoring initiative, we worked with New Relic engineers to build our own custom application running on New Relic. We call it the GAME Board, which stands for global application monitoring experience. GAME Board serves as our one-stop shop for observability for our applications, whether they are in the cloud or on premises.
GAME Board gives us an instant view of which applications are running in a healthy state and which are unhealthy, or not working at all. If there is an issue that impacts an application, we’re immediately alerted, and we can prioritize a rapid response to get the situation corrected before it affects our users and the BASF user experience.
Centralizing our view across multiple clouds—with cost and metrics
Another reason we chose New Relic is its deep integration with the cloud services we rely on, namely Microsoft Azure and Amazon Web Services (AWS). In AWS, for example, New Relic provides us with at least 50 key metrics. We get visibility into app health in one central place regardless of the environment where the app is running.
It’s not just about the number of metrics available automatically. We can also gain visibility into core metrics such as cloud costs, which helps us make business decisions. As with any huge environment, there are multiple cloud subscriptions. Going into each subscription manually to calculate the cost versus the expected output, whether that be the number of users or a monetary amount, is cumbersome and time-consuming. With New Relic, we developed a centralized cost dashboard to see all of our subscriptions and total costs in one place.
Insights from the team: Jörg & Philipp
Jörg Lohmann, Senior Digital Ecosystem Manager
Philipp Sturm, Product Owner, Monitoring Digital Agricultural Solutions
A huge challenge across all teams was infrastructure costs. It wasn’t possible to get a report on costs across all different environments. We had two wishes: Measure the costs in real time and then use the insights to optimize costs. New Relic brought the possibility of a cost tracking dashboard. The team uses this dashboard to inform decision-making—like shutting down expensive services that aren’t being used over the weekend. Before each team was thinking about infrastructure costs within their own tooling and environments, this dashboard gave transparency to a more intelligent and scalable way of working. A one-time effort created a repeatable process for teams to follow and now it’s self-service. It’s a “gift” for our product owners. If teams want to develop their own projects, we recommend going to learn.newrelic.com as a starting point for free webinars and workshops.
Predicting problems and responding before customers notice
In addition to our GAME Board app that shows us the health of our applications, New Relic has a powerful and time-saving capability to proactively help us catch performance issues and errors before they affect the internal and external users of our applications. New Relic synthetic monitoring simulates user traffic so we can detect and resolve issues before we deploy new software or updates. It also helps us quickly identify and address performance issues in production software that could affect our users.
Tracking and communicating business KPIs
Another major reason we’re using New Relic for our monitoring initiative is the ability to track not only app and infrastructure health and performance but also business KPIs. As part of our project, we knew we wanted to introduce real business monitoring to understand how, when, and by whom our software is being used.
With the ability to monitor and track KPIs, such as the number of users at any given time, we can give business stakeholders and product owners the data they need to make informed decisions to prioritize new capabilities on our digital roadmap.
What’s next?
We’re still in the early phases of our observability and monitoring journey, but our GAME Board app is already a success. As we add applications to this centralized dashboard, we add transparency by giving teams visibility into each other’s applications—for the first time ever.
The next phase of our initiative is to automate the instrumentation of environments and applications using Terraform scripts, so that it’s only a click or two to begin collecting telemetry data and visualizing it on New Relic. We want the minimum effort—using sample code and templates—for product owners to begin using New Relic to monitor their applications, whether they are in Azure or AWS.
Read other ways people are using New Relic, like monitoring a home solar array.
Related Topics
ObservabilityThe views expressed on this blog are those of the author and do not necessarily reflect the views of New Relic. Any solutions offered by the author are environment-specific and not part of the commercial solutions or support offered by New Relic. Please join us exclusively at the Explorers Hub (discuss.newrelic.com) for questions and support related to this blog post. This blog may contain links to content on third-party sites. By providing such links, New Relic does not adopt, guarantee, approve or endorse the information, views or products available on such sites.
Recommend
-
56
S4 Agtech picks Google Cloud to transform agricul...
-
11
The lowdown on the farmer’s protest and Agricultural Reforms: Everything you need to know
-
4
Howdy and Welcome Welcome to Aggieland & TAMU Department of Agricultural Economics "Our Students In Action" from the U...
-
8
August 5, 2021
-
6
According to the latest report by Renub Research, Global Agricultural Micronutrients Market is Forecasted to be more than US$ 10.7 Billion by the end of year 2027.
-
8
More Ajit Posted on Jan 13...
-
5
How agricultural drones are helping Ukraine prepare for the upcoming farming season ...
-
3
Syslogic targets AI agricultura...
-
6
Cambodian farmers mull agricultural drones to boost cassava productivity ...
-
3
XAG makes its P100 agricultural drone available globally
About Joyk
Aggregate valuable and interesting links.
Joyk means Joy of geeK