
50

使用prometheus监控群晖
source link: https://www.bboy.app/2022/03/25/%E4%BD%BF%E7%94%A8prometheus%E7%9B%91%E6%8E%A7%E7%BE%A4%E6%99%96/
Go to the source link to view the article. You can view the picture content, updated content and better typesetting reading experience. If the link is broken, please click the button below to view the snapshot at that time.

使用prometheus监控群晖
就是下面这个项目
https://github.com/ddiiwoong/synology-prometheus
因为我家里已经又了prometheus等,所以就看下他的docker-compose里面写了什么
https://github.com/ddiiwoong/synology-prometheus/blob/master/docker-compose.yml
也就是我只要node-exporter和snmp-exporter就好了
version: '3.8'
services:
  node_exporter:
    image: prom/node-exporter:v1.3.1
    container_name: node_exporter
    command:
      - '--path.rootfs=/host'
    network_mode: host
    pid: host
    restart: unless-stopped
    volumes:
      - '/:/host:ro,rslave'
version: '3.8'
services:
  snmp-exporter:
    image: prom/snmp-exporter
    container_name: snmp-exporter
    command:
      - '--config.file=/etc/snmp_exporter/snmp.yml'
    network_mode: host
    restart: always
    volumes:
      - './snmp_exporter/:/etc/snmp_exporter/'
群晖里面要开启snmpv1服务,然后社群填写synology
然后snmp.yml就是
https://github.com/ddiiwoong/synology-prometheus/blob/master/snmp-synology/snmp.yml
之后配置prometheus
- job_name: 'snmp-exporter'
  static_configs:
  - targets: ['10.10.100.244']
  metrics_path: /snmp
  params:
    module: [synology]
  relabel_configs:
    - source_labels: [__address__]
      target_label: __param_target
    - source_labels: [__param_target]
      target_label: instance
    - target_label: __address__
      replacement: 10.10.100.244:9116
- job_name: 'node'
  file_sd_configs:
  - files:
    - "/file_sd/node-exporter.yaml"
    refresh_interval: 5s
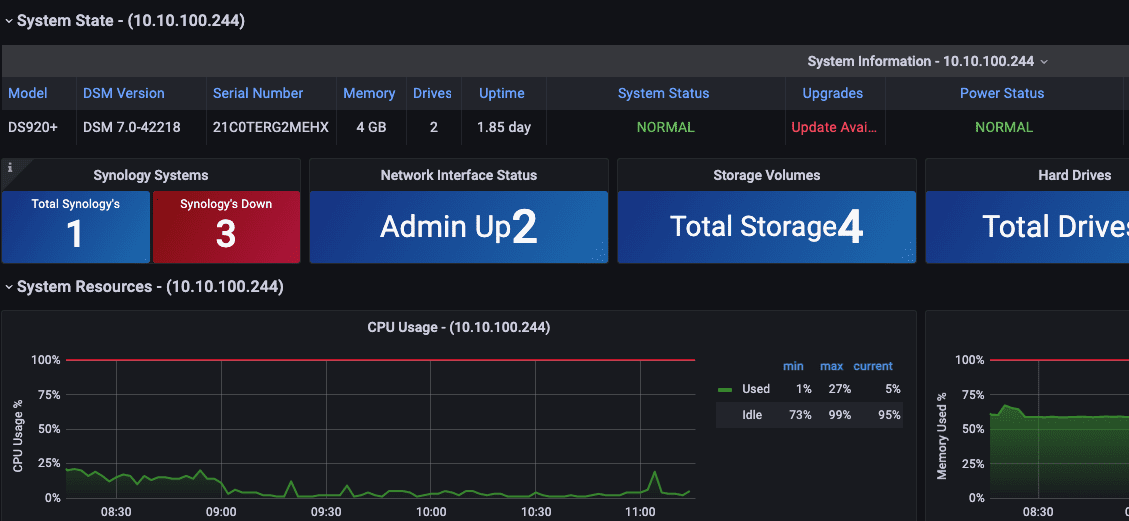
grafana的dashboard
它提供的也还可以
https://grafana.com/grafana/dashboards/14284
但是数据太多了,我还是喜欢自己配置
欢迎关注我的博客www.bboy.app
Have Fun
Recommend
About Joyk
Aggregate valuable and interesting links.
Joyk means Joy of geeK