

Feature Engineering - Expand category column
source link: https://dev.to/mage_ai/feature-engineering-expand-category-column-42n3
Go to the source link to view the article. You can view the picture content, updated content and better typesetting reading experience. If the link is broken, please click the button below to view the snapshot at that time.

In this Mage Academy lesson, we’ll go over how to expand a category column and see how this can help us understand the data better.
Glossary
- Definition
- Why is it necessary
- How to gain information
- Conceptual example
- How to code
Definition
Expanding the category column means splitting a categorical column into multiple numerical columns (i.e., the values of these columns are in the form of numbers), and the number of numerical columns is equal to the number of categories in the categorical column.
Why is it necessary
Data is available in 2 forms (numbers or strings). Machine learning models can understand only numbers, so before building any machine learning model, we’ve to convert strings into numbers without losing any information. Expanding category columns is one such action that helps to represent categorical columns in the form of numbers without losing information.
Now, let’s see in detail what the expand category column is and how to perform this action.
How to gain information
As mentioned, expanding the category column splits the categorical column into multiple new numerical columns (i.e., the values in these columns are in the form of numbers). These new columns have the frequency of each category as column values, and these frequency values help us prioritize the data.
For example, there’s sample data with columns "ID" and "Dish". Using the expand category column action, we can prioritize the dishes based on the number of times they've been ordered.
And with this information, we can predict how many dishes we can sell next month or we can estimate the quantity of ingredients required for the next month.
Frequency of each category"Noodles" were ordered 4 times, so we can conclude that "Noodles" are the most popular dish. "Ice cream" was ordered twice, making it the second best-selling dish, and "Biryani" was ordered only once, making it the least favorite among the customers who visited the restaurant. As "Noodles" are our best-selling dish, we'll need to buy more ingredients to make this recipe more frequently.
Note: After expanding the category column "Dish", we can remove this column as this column’s information is already in the new columns "Noodles," "Biryani," and "Ice cream."
Conceptual example
Let’s understand the importance of expanding category columns in detail with the help of a more complicated example.
Image by digital designer from PixabayYou own 4 pizza restaurants. Now, you'd like to know how frequently each variety of pizza is sold at each restaurant, as this helps you estimate the quantity of groceries you'll need for the next month at each restaurant.
Image by Alexas_Fotos from PixabayRestaurant names
All 4 restaurants sell 2 varieties of pizza.
MenuFirst, let’s take a look at the order data of all restaurants.
Image by Photo Mix from PixabayStep-1: Let’s group the orders by restaurant names.
Step-2: Group the data by types of pizzas sold at each restaurant.
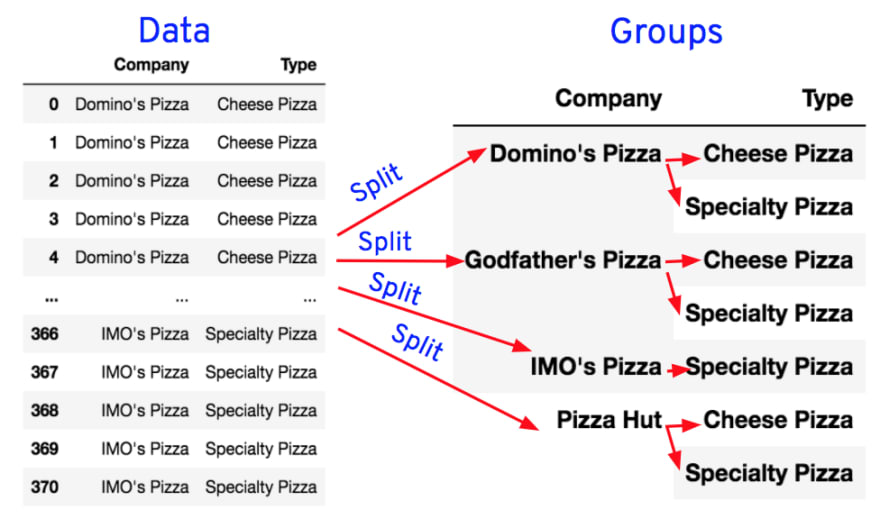
We see that there are 4 restaurants and each restaurant has 2 varieties or categories of pizzas sold. Now, for each variety or category, let’s count the number of pizzas sold at each restaurant.
Step-3: Display the count of pizzas sold at each restaurant.

We can also display the same result in a more readable format as shown below.

Step-4: Add the results back to the original data.

How to code
Until now, we’ve seen how to manually calculate the count of pizzas sold per variety at each restaurant. Now, let’s see how we can automate the process through code.
Find the count of each variety of pizza sold at each restaurant.
Step-1:
First, let’s group orders by company name and then by types of pizzas sold. To do this, we’ll iterate through the rows of order data and save the “Company” as keys of the dictionary. The final result should be as shown below.
Output format: {‘CompanyA’: [List of pizzas sold], ‘CompanyB’:[List of pizzas sold],....}
Step-2:
Calculate the number of pizzas sold in each category at each restaurant.
The number of pizzas sold in each category at each restaurant is calculated by counting the number of times a pizza category appears in the list corresponding to each restaurant. The final result should be as shown below.
Output format: {‘CompanyA’: {Type1: count, Type2: count}, ‘CompanyB’: {Type1: count, Type2: count},....}
First, we’ve to group the data to calculate the frequency of each category and then we’ve to join the result back into the original dataset.
Step-1: We can either use crosstab(), groupby() or pivot_table() functions to get the count of the pizzas sold in each variety or category.
Using crosstab()
Using groupby()
Using pivot_table()
Step-2: Finally, create new columns in the original data frame for each category with values equal to the number of pizzas sold in each category with respect to each restaurant and add the result back to the original dataset using join() function.
Original data set after expanding the “Type” columnWe've got 2 categories in the column "Type", so 2 new columns "Cheese Pizza" and "Speciality Pizza" are created after expand the category column action. The values in the new columns represent the frequency or count of pizzas sold at each restaurant. From this, we can say "Domino’s Pizza," "Godfather’s Pizza," and "IMO’s Pizza" are famous for specialty pizzas. IMO’s Pizza sold the least, i.e., 0 cheese pizzas, while "Pizza Hut" sold the most, i.e., cheese pizzas. Based on this, we can say that 3 of the restaurants require more ingredients to make specialty pizzas than cheese pizza ingredients.
Note: After expanding the "Type" column, we can remove this column from the dataset as its information is already in the new columns "Cheese Pizza" and "Speciality Pizza."
For quick analysis and results, try our product, Mage. Our service features an "Edit data" area with “Expand category column” action.
Data set before expanding the category column actionData set after expanding “type” column_

Want to learn more about machine learning (ML)? Visit Mage Academy! ✨🔮
Recommend
About Joyk
Aggregate valuable and interesting links.
Joyk means Joy of geeK