

Cube: Time Series Visualization
source link: https://developer.squareup.com/blog/cube-time-series-visualization/
Go to the source link to view the article. You can view the picture content, updated content and better typesetting reading experience. If the link is broken, please click the button below to view the snapshot at that time.

Cube: Time Series Visualization
Announcing an open-source system for visualizing time series data, built with MongoDB, Node, and D3.
Written by Mike Bostock.
We’ve found visualization to be a powerful tool with myriad applications at Square, whether it’s monitoring system performance, analyzing website traffic, helping merchants optimize their business, or finding new ways to combat fraud. So we’re constantly looking to make the process of data visualization and analysis easier, allowing anyone to gain the insight they need to make decisions quickly.
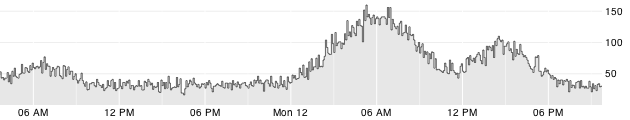
While some visualizations are necessarily bespoke, tailored to specialized domains, there are plenty of useful generic applications. For decision-making, time is of the essence. That’s why we built Cube: an open-source system for visualizing time series data, built on MongoDB, Node and D3. If you send Cube timestamped events (with optional structured data), you can easily build realtime visualizations of aggregate metrics. For example, you might use Cube to monitor traffic to your website, counting requests:
Cube is intentionally generic: you can send it any structured data, collecting events from various systems for analysis. This allows you to analyze related-but-disparate systems easily — for example, comparing traffic on your website to load on your database. These internal dashboards can be assembled directly in the browser by writing simple queries and dragging charts onto the screen.
Cube is a work in progress. This initial release includes only the most basic visualization components, but we have exciting new features in the works. Realtime visualizations are great, but they’re just a starting point for interaction and exploration. (For example, we want coordinated views, dynamic filtering, brushing and linking.) Cube builds on many awesome open-projects, so we’re committed to developing Cube in the open as well. Mike Bostock - Profile As someone who creates open-source software, I spend a lot of time thinking about how to make software better. This is…medium.com

By Square Engineering
@SquareEngMedium
Recommend
About Joyk
Aggregate valuable and interesting links.
Joyk means Joy of geeK