

十个 Python 小技巧,覆盖了90%的数据分析需求!
source link: https://www.51cto.com/article/703449.html
Go to the source link to view the article. You can view the picture content, updated content and better typesetting reading experience. If the link is broken, please click the button below to view the snapshot at that time.

在本文中,我将分享10个 Python 操作,它们可覆盖90%的数据分析问题。有所收获点赞、收藏、关注。
数据分析师日常工作会涉及各种任务,比如数据预处理、数据分析、机器学习模型创建、模型部署。
在本文中,我将分享10个 Python 操作,它们可覆盖90%的数据分析问题。有所收获点赞、收藏、关注。
1、阅读数据集
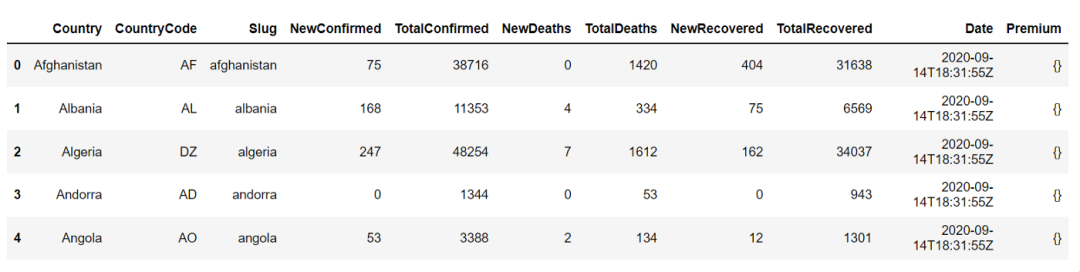
阅读数据是数据分析的组成部分,了解如何从不同的文件格式读取数据是数据分析师的第一步。下面是如何使用 pandas 读取包含 Covid-19 数据的 csv 文件的示例。
import pandas as pd
# reading the countries_data file along with the location within read_csv function.
countries_df = pd.read_csv('C:/Users/anmol/Desktop/Courses/Python for Data Science/Code/countries_data.csv')
# showing the first 5 rows of the dataframe
countries_df.head()
以下是 countries_df.head() 的输出,我们可以使用它查看数据框的前 5 行:
2、汇总统计
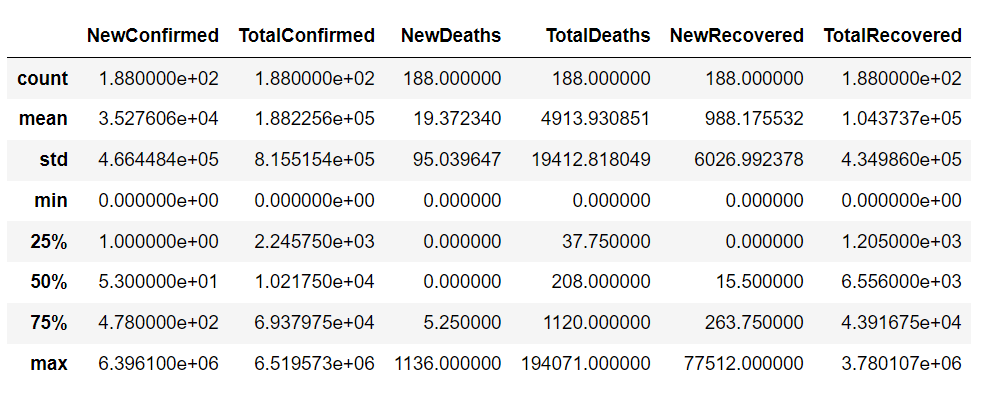
下一步就是通过查看数据汇总来了解数据,例如 NewConfirmed、TotalConfirmed 等数字列的计数、均值、标准偏差、分位数以及国家代码等分类列的频率、最高出现值
countries_df.describe()使用 describe 函数,我们可以得到数据集连续变量的摘要,如下所示:
在 describe() 函数中,我们可以设置参数"include = 'all'"来获取连续变量和分类变量的摘要
countries_df.describe(include = 'all')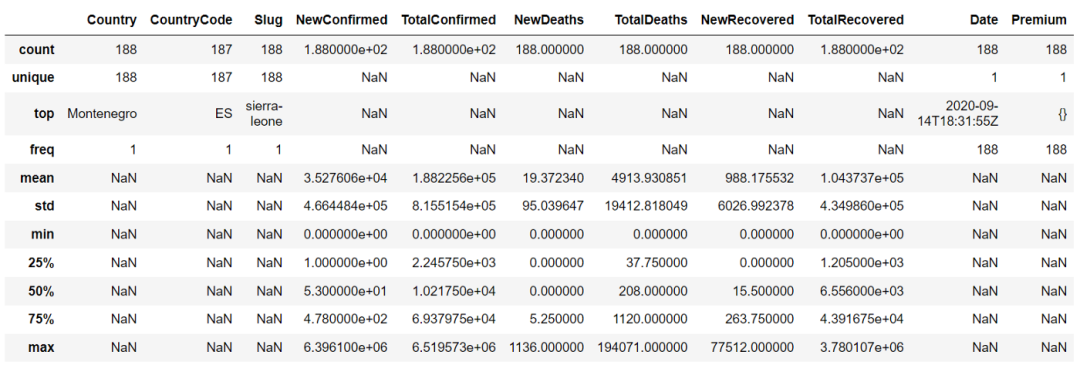
3、数据选择和过滤
分析其实不需要数据集的所有行和列,只需要选择感兴趣的列并根据问题过滤一些行。
例如,我们可以使用以下代码选择 Country 和 NewConfirmed 列:
countries_df[['Country','NewConfirmed']]我们还可以将数据过滤Country,使用 loc,我们可以根据一些值过滤列,如下所示:
countries_df.loc[countries_df['Country'] == 'United States of America']
计数、总和、均值等数据聚合,是数据分析最常执行的任务之一。
我们可以使用聚合找到各国的 NewConfimed 病例总数。使用 groupby 和 agg 函数执行聚合。
countries_df.groupby(['Country']).agg({'NewConfirmed':'sum'})5、Join
使用 Join 操作将 2 个数据集组合成一个数据集。
例如:一个数据集可能包含不同国家/地区的 Covid-19 病例数,另一个数据集可能包含不同国家/地区的纬度和经度信息。
现在我们需要结合这两个信息,那么我们可以执行如下所示的连接操作
countries_lat_lon = pd.read_excel('C:/Users/anmol/Desktop/Courses/Python for Data Science/Code/countries_lat_lon.xlsx')

# joining the 2 dataframe : countries_df and countries_lat_lon
# syntax : pd.merge(left_df, right_df, on = 'on_column', how = 'type_of_join')
joined_df = pd.merge(countries_df, countries_lat_lon, on = 'CountryCode', how = 'inner')
joined_df
6、内建函数
了解数学内建函数,如 min()、max()、mean()、sum() 等,对于执行不同的分析非常有帮助。
我们可以通过调用它们直接在数据帧上应用这些函数,这些函数可以在列上或在聚合函数中独立使用,如下所示:
# finding sum of NewConfirmed cases of all the countries
countries_df['NewConfirmed'].sum()
# Output : 6,631,899

# finding the sum of NewConfirmed cases across different countries
countries_df.groupby(['Country']).agg({'NewConfirmed':'sum'})

# Output
#          NewConfirmed
#Country
#Afghanistan    75
#Albania       168
#Algeria       247
#Andorra        0
#Angola        53
7、用户自定义函数
我们自己编写的函数是用户自定义函数。我们可以在需要时通过调用该函数来执行这些函数中的代码。例如,我们可以创建一个函数来添加 2 个数字,如下所示:
# User defined function is created using 'def' keyword, followed by function definition - 'addition()'
# and 2 arguments num1 and num2
def addition(num1, num2):
    return num1+num2

# calling the function using function name and providing the arguments
print(addition(1,2))
#output : 3
8、Pivot
Pivot 是将一列行内的唯一值转换为多个新列,这是很棒的数据处理技术。
在 Covid-19 数据集上使用 pivot_table() 函数,我们可以将国家名称转换为单独的新列:
# using pivot_table to convert values within the Country column into individual columns and
# filling the values corresponding to these columns with numeric variable - NewConfimed
pivot_df = pd.pivot_table(countries_df,  columns = 'Country', values = 'NewConfirmed')
pivot_df
9、遍历数据框
很多时候需要遍历数据框的索引和行,我们可以使用 iterrows 函数遍历数据框:
# iterating over the index and row of a dataframe using iterrows() function
for index, row in countries_df.iterrows():
    print('Index is ' + str(index))
    print('Country is '+ str(row['Country']))

# Output :
# Index is 0
# Country is Afghanistan
# Index is 1
# Country is Albania
# .......
10、字符串操作
很多时候我们处理数据集中的字符串列,在这种情况下,了解一些基本的字符串操作很重要。
例如如何将字符串转换为大写、小写以及如何找到字符串的长度。
# country column to upper case
countries_df['Country_upper'] = countries_df['Country'].str.upper()

# country column to lower case
countries_df['CountryCode_lower']=countries_df['CountryCode'].str.lower()

# finding length of characters in the country column
countries_df['len'] = countries_df['Country'].str.len()

countries_df.head()Recommend
About Joyk
Aggregate valuable and interesting links.
Joyk means Joy of geeK