

11 Best API Monitoring Tools & Services [2022 Review] - Sematext
source link: https://sematext.com/blog/api-monitoring-tools/
Go to the source link to view the article. You can view the picture content, updated content and better typesetting reading experience. If the link is broken, please click the button below to view the snapshot at that time.

This website uses cookies to ensure you get the best experience on our website. For more information visit our Privacy Policy.
As APIs play a crucial role in connecting modern cloud applications, monitoring their availability and performance is a must if you want to provide a top-notch experience. A good API monitoring tool will help you build reliable APIs by identifying and resolving the issues before they reach your users.
If you’re interested in such a solution, look no further. In this article, we reviewed some of the best API monitoring tools and services available today, both open source and commercial. From strengths and weaknesses to pricing, we’re going to dive into all the nooks and crannies to help you find the right fit for your use case.
Let’s get started!
1. Sematext
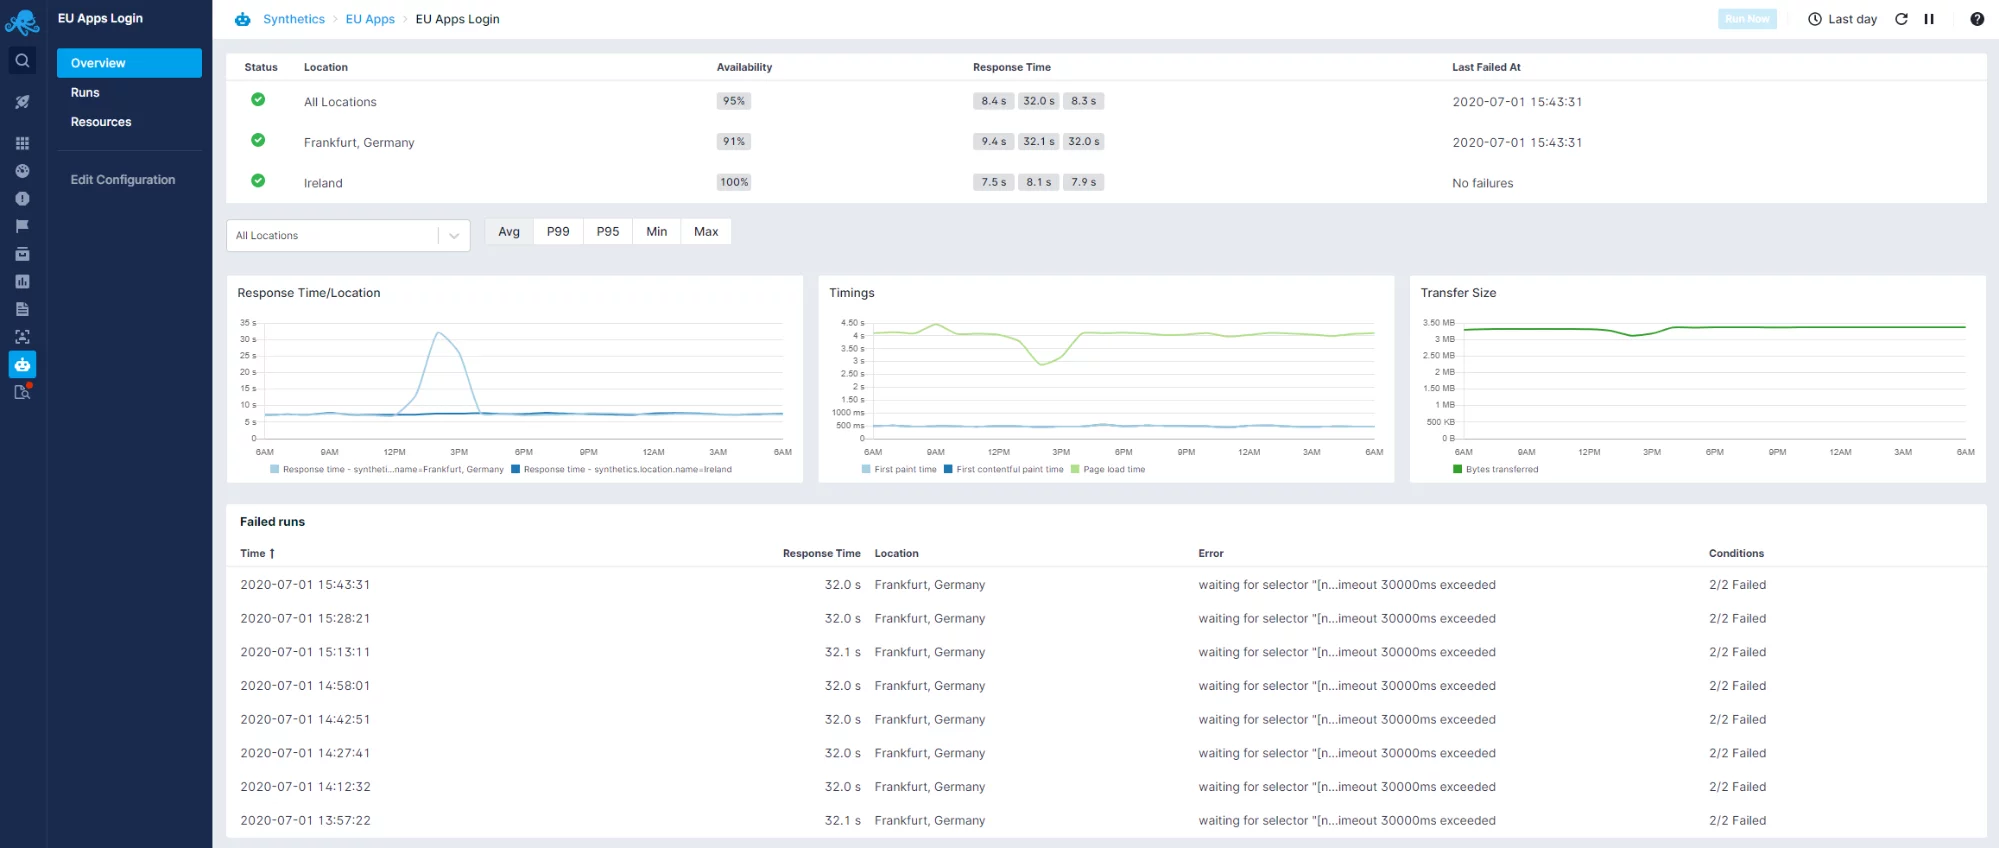
Sematext offers a powerful API monitoring tool that enables you to track key API metrics to help improve the performance, functionality, and availability of your APIs. It features an advanced API monitoring notification system that you can customize to work on several different conditions based on errors and metrics. This allows you more granular control over the alerts you get by having Sematext do double or triple checks before sending a notification. Basically, it eliminates false positives (alerts that get fired even though the website works just fine) in the process. As an added bonus, you can schedule your alerts to only be sent at given hours throughout the day.
Sematext’s API monitoring service is part of Synthetics, a suite of tools meant to respond to the customers’ need to better their users’ experience by simulating interactions with the website or application. Using synthetic monitoring, Sematext can identify business-critical web performance metrics, send alerts in case of a failure, monitor website uptime, and even benchmark your website against competitors.
Besides the simple Browser monitor that is often found as a monitoring solution to most vendors in this space, Sematext offers a comprehensive HTTP monitor that allows you to collect web performance metrics based on scripted user interactions with the website. This means that you can test beyond the page speed but go deeper and look at detailed interactions with the website like login and registration, add to cart and run search queries. Besides being able to monitor your APIs from both a public and a private location (behind your firewall), with Sematext you’ll also be able to monitor your SSL Certificates. Any and all incidents can be displayed publicly or privately on a status page that you create by navigating to Synthetics -> Status pages.
When looking at the pricing plans, you’ll see three options, the Standard and Pro packages that cost $29 and $99 a month, and the option of choosing a Pay-as-you-Go package where you pay a flat fee for each monitor and start at just $2 a month.
2. Prometheus
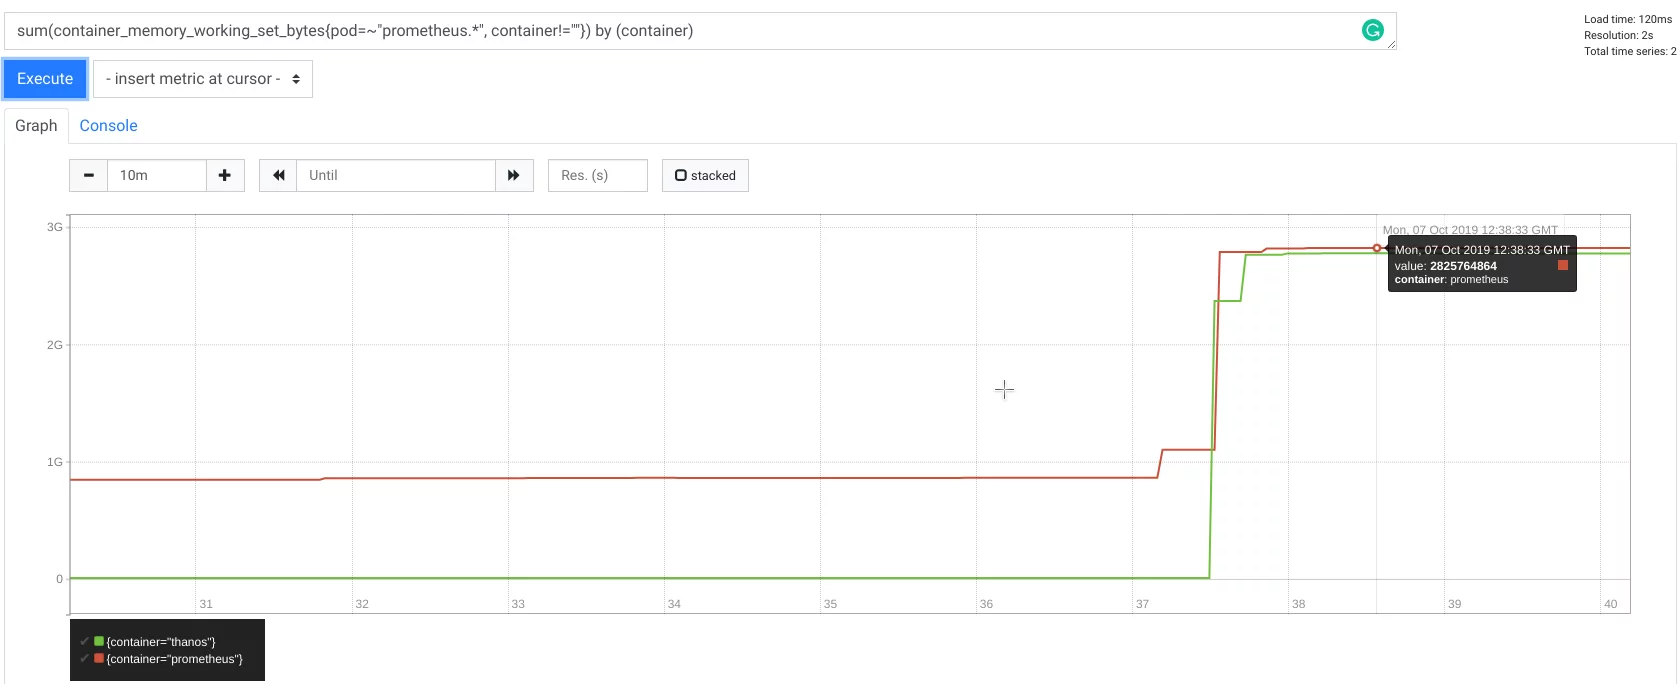
Amongst the most recognized open source monitoring solutions for API’s and web services in cloud applications, Prometheus is best for mission-critical applications due to its inherent simplicity.
Prometheus provides extensive documentation with detailed instructions on how the tool works, how to set it up, and use it to get the most out of it. It’s worth noting that the official Prometheus website has a blog dedicated to exploring use cases, tips, tricks, and features writers all over the world using Prometheus in their day-to-day operations.
Due to how it works, Prometheus lacks in the data analysis department you’d otherwise find in an out-of-the-box API monitoring tool. You can only rely on an append-only file per metric, and data is stored on the local disk. If you do end up using Prometheus, we recommend looking into a remote storage option for long-term retention and analysis.
3. Graphite
Graphite is a push-based open source monitoring system that allows you to gather metrics from modern APIs by having the application push the data into Graphite’s Carbon component, which is later stored in a database.
One thing that sets Graphite apart from the rest of the open-source is the ease with which it gets installed and how users can just pick it up and start using it thanks to Synthesize, an automated installation and configuration script for the Graphite stack.
An interesting feature of Graphite is the ability to store arbitrary events that should be related to time-series metrics. In particular, application or infrastructure deployments can be added and tracked within Graphite. This allows developers to find the issue faster by having more context about the event and the anomaly that led to the unexpected behavior.
4. Uptrends
Uptrends’ API monitoring product uses an advanced multi-step solution to check APIs for performance, function, and uptime. It relies on a solid alerting system that will trigger a message every time something breaks.
Uptrends can monitor your API from 209 locations scattered across the world and test your app and web services behind your Firewall using Private checkpoints. These private checkpoints can be virtual machines or physical servers you have on-premise and are used to monitor your intranet, web applications, and APIs using Uptrends checkpoint software.
Their multi-step monitoring platform lets you set up powerful testing scenarios with virtually no need for programming skills. It’s easy to configure, and you get instant alerting and custom metrics.
While they have five different pricing plans, they only offer API monitoring with their advanced website monitoring plans that start at $35 for Business and $65 for Enterprise.
5. Dotcom-Monitor
With Dotcom-Monitor, you can monitor your APIs web services for functionality, availability, and performance. Your tests will run from 25 different locations and seven different browsers.
Setting up is pretty straightforward. You can call a specified web function and check for response content, performance, and uptime for either a REST or a SOAP web service. If you have been using Postman, you get the option to import your calls from Postman directly into dotcom-monitor by using the Postman Collection Task.
After you run the test, you’ll get graded based on your load time and get details on your server responses. You’ll also be able to check what a repeat visit looks like for someone that comes to your website a second time and has already cached resources on their machine. You’ll also get a detailed page speed insight report generated by Lighthouse.
Dotcom-Monitor has a risk-free 30-day trial, and their pro plans start at $19.95 per month and go up to $39.95.
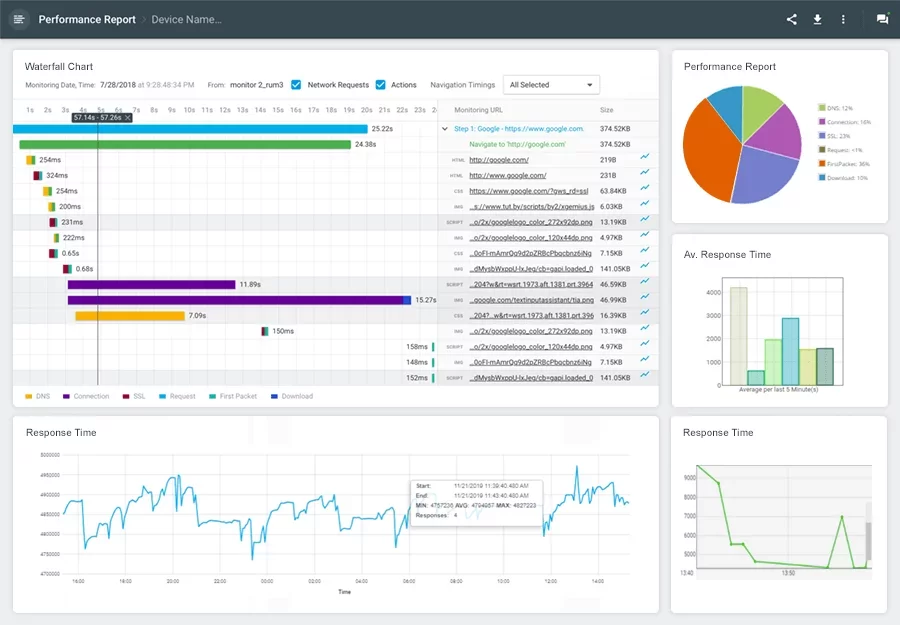
6. AppDynamics
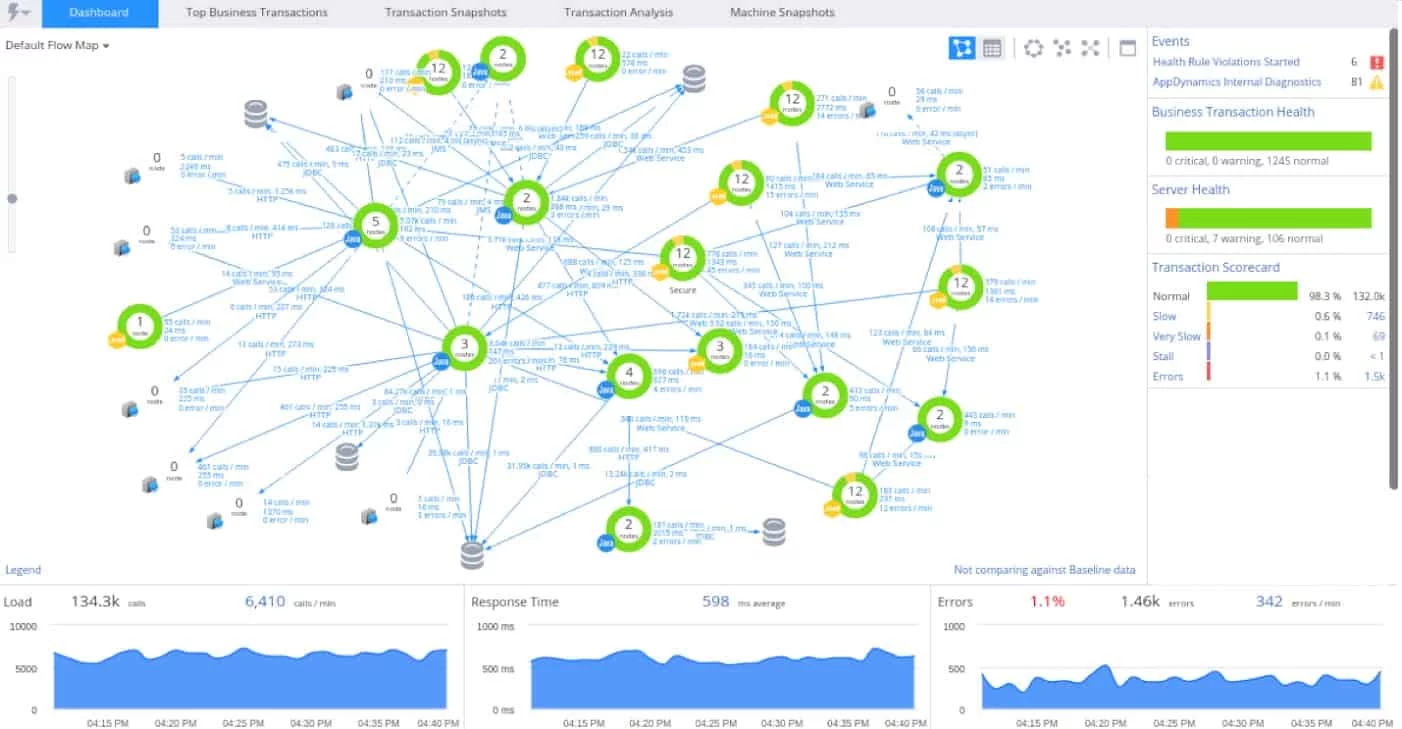
A powerful API monitor that is currently part of the Cisco product suite. AppDynamics offers real-time data visualization in a simple to comprehend and concise way allowing you to avoid user-impacting experiences with out-of-the-box monitoring solutions.
With AppDynamics, you can stay confident that your app or web service is ready and able to serve users at any point in time by measuring your entire workflows, including data and user actions, through Selenium-based tests.
You’ll be able to measure and track end-user experience as perceived by your customers, not some proxy metric, with full resource waterfalls and page performance load times from the browser timing and navigation APIs.
AppDynamics has a 15-day trial, and when you’re ready to commit pricing, it starts at $3300/ year which is by far the most expensive offer in this list.
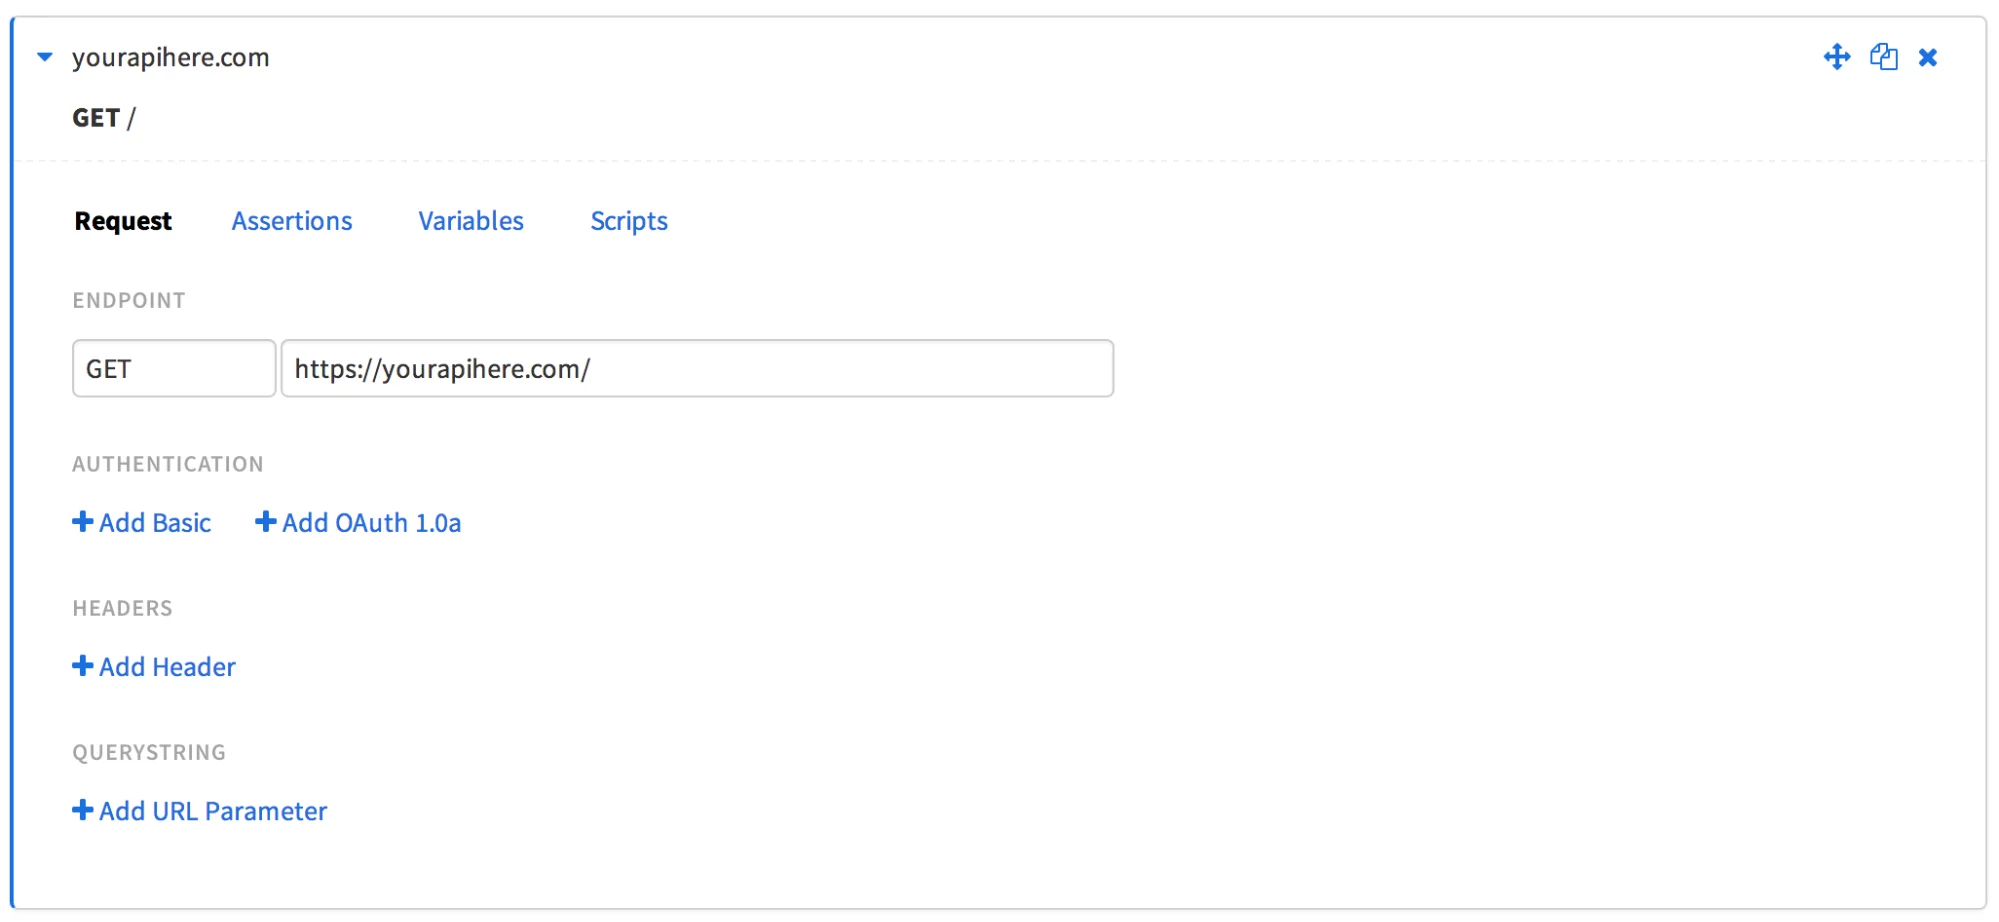
7. Checkly
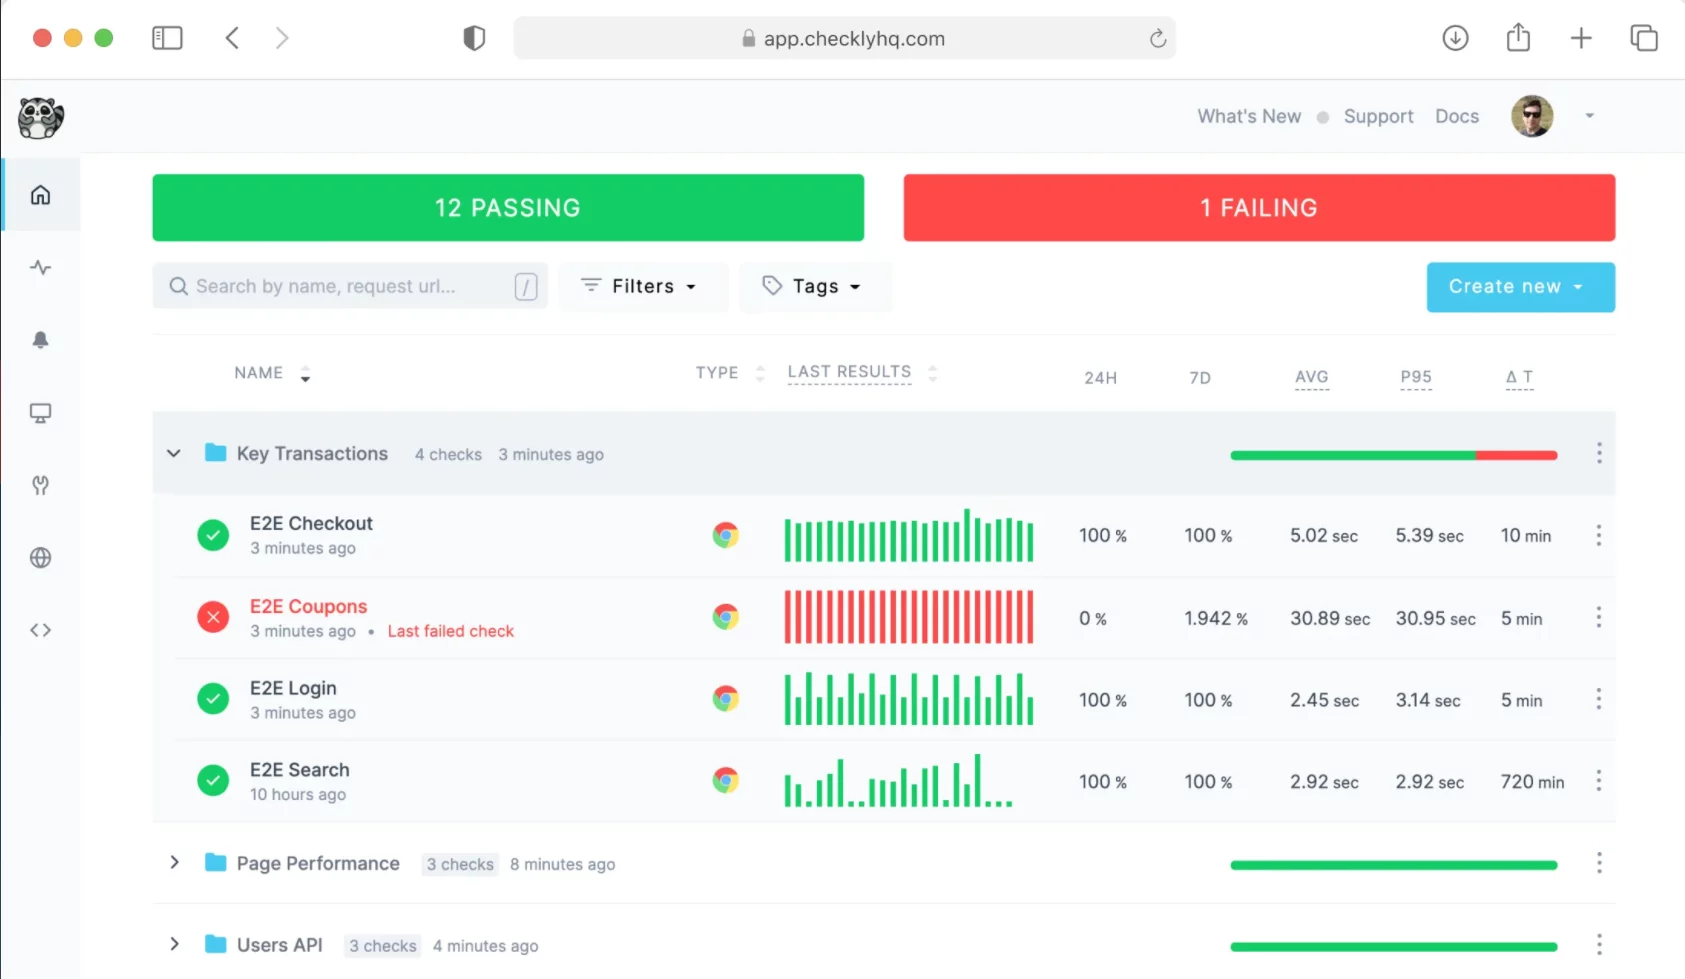
While still being considered a new player to the market, Checkly provides the tools that support the building of modern systems with a focus on JavaScript-based tech stacks. Among the features Checkly provides, one of their more popular ones is the API monitors that run monitors to check the correctness and performance of your API’s.
Checkly records the response for your requests, checks the payload, response codes, headers, and authentication. It allows you to run your monitors from 20 different locations globally, which is less than what we usually get with the other vendors in this list.
Every time Checkly runs into an error or your API performance dips, you’ll get an error containing the right information you need in order to debug the issue. You can choose from a number of different alerting mediums from Slack, SMS, Email, PagerDuty, and more.
Pricing is relatively simple as you are given two options. A Free plan that gets you 50K API checks/mo and a pay-as-you-go plan that costs $1.20 for every 20K API checks. Every plan starts with a free 14-day trial.
8. API Fortress
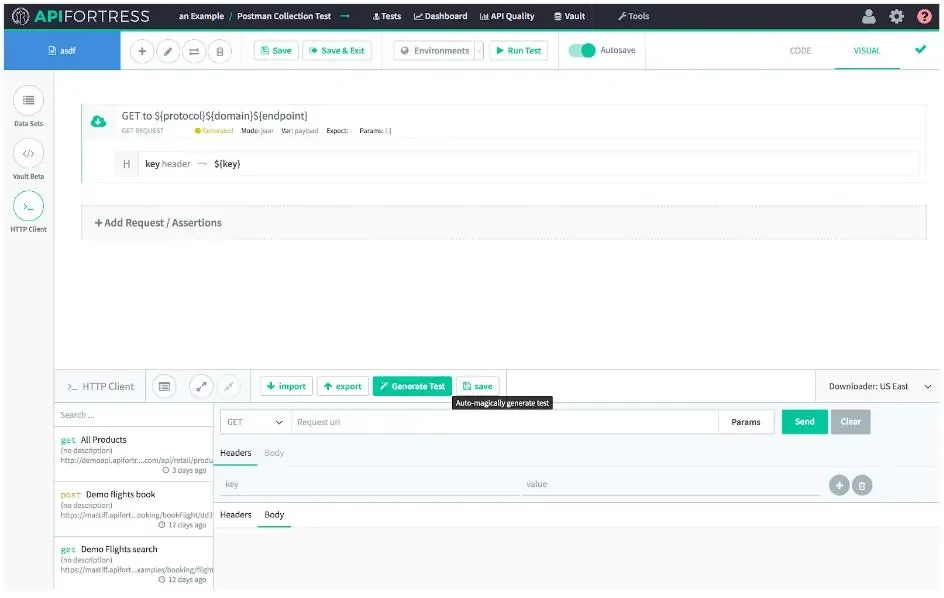
API Fortress is a bit of a combo as it provides both REST API and an in-depth monitoring solution. It has a beautiful interface that allows you to quickly test payloads, subsets of API traffic, and many more. Using both services will give an extra layer of confidence when it comes to preventing downtimes and other issues.
It will allow you to check data in real-time and share time-sensitive and critical information with your entire team while keeping a history of data for service level agreements compliance.
API Fortress can be used as a SaaS solution or installed on-premise and hosted on a Linux machine. It has a 30 days trial that you can use to test their features, or you get the cloud-based, scalable solution that starts at $1500/year for a single user license.
9. Runscope
Runscope is a no thrills, API monitoring solution that works by preventing slow or broken APIs from affecting your apps or web services. It will schedule tests that will run from any of the 16 locations worldwide and identify any issues within your system and send an alert immediately.
It has four simple pricing plans starting at $79 and features integrations with Slack, DataDog, Pagerduty, and many more. You can schedule up to 1-minute tests and up to 250000 requests. For the Small package, you can invite up to 5 team members.
Before you have to agree on a plan, you can choose to test all of Runscope features for 14 days without the need of ever having to add a credit card to your account.
10. Speedcurve
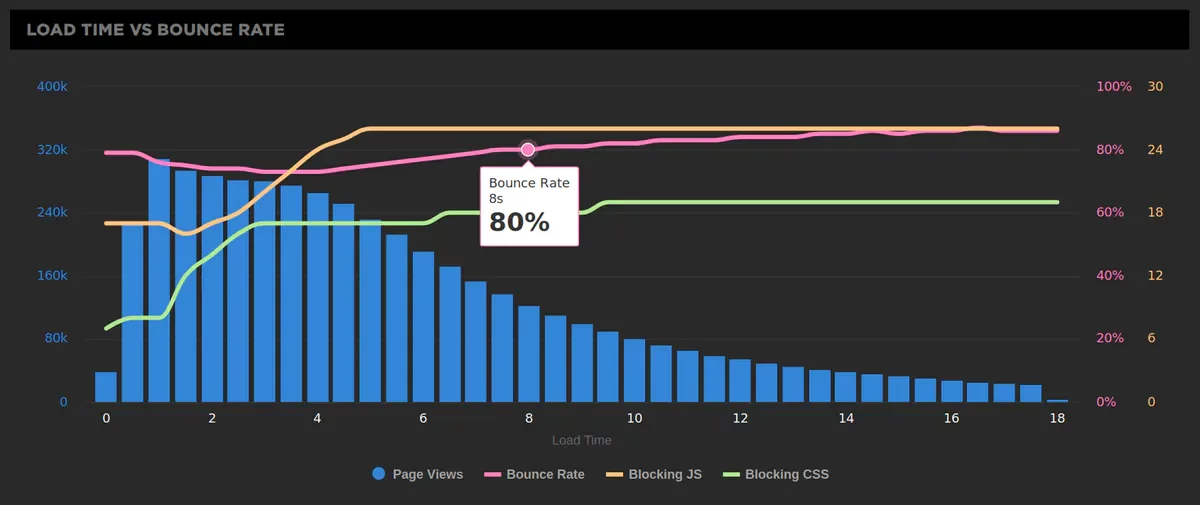
Unlike some of the other tools I’ve discussed in this article, Speedcurve focuses on API monitoring and RUM monitoring. It will help you measure when your most important content renders, correlate web performance with user experience, and you can even benchmark your competitors.
Speedcurve will provide information on your ads’ effects and third parties API on your website’s performance. It enables you to compare synthetic and real user monitoring data allowing you to better understand and debug web performance at a page level.
Both their services cost a whopping $18,000 a year, but they also offer a few alternatives for both Synthetic and Real User monitoring and a Pay-as-you-Go plan that will give you granular control over your bill. Before picking any of their services, you can use their free trial for 30 days.
11. UptimeRobot
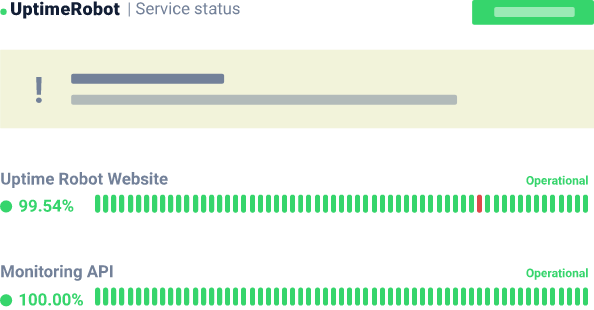
UptimeRobot is a simple API monitoring tool that works great, especially for small businesses. It provides website monitoring, SSL certificate monitoring, and cron job monitoring. UptimeRobot features a custom HTTP request monitoring system that allows you to check on your third-party APIs and make sure they all work as they are supposed to.
UptimeRobot has three plans, a free plan that allows you to run 5-minute interval checks on 50 monitors, a Pro plan that’s customizable based on your needs, and features SMS and voice alerts. A final third plan for Enterprise provides a custom number of monitors and SMS alerts with high priority support.
UptimeRobot’s plans start at $5 per month and goes all the way up to $828/month, the main difference being the number of monitors and alerts you get. They also have a free tier that will allow you to monitor 50 APIs at 5 minute intervals.
What Is The Best API Monitoring Tool for You?
With that, we end our list with the top API monitoring tools and services. We included options for everyone, from DevOps to engineers, product managers, or business owners, whether they need a basic service or have more complex needs. You can learn how to choose the right one for you from our guide about API monitoring.
Whatever your case, Sematext Synthetics can definitely help. Try it out yourself! There’s a free 14-day trial available for you to test-drive it.
Another tip from our team is to look beyond APIs and add synthetic monitoring and real user monitoring to your website monitoring strategy. We explained the benefits of using them together in our article about RUM vs. synthetic monitoring. We compiled a list with the top website monitoring tools that feature the best of both worlds to help you get started in your journey to lightning-quick performance.
Recommend
About Joyk
Aggregate valuable and interesting links.
Joyk means Joy of geeK