

The Application Hierarchy of Needs for SREs and IT Operators
source link: https://developer.ibm.com/blogs/application-hierarchy-of-needs-for-sres-and-it-operations/
Go to the source link to view the article. You can view the picture content, updated content and better typesetting reading experience. If the link is broken, please click the button below to view the snapshot at that time.

Blog Post
The Application Hierarchy of Needs for SREs and IT Operators
Combine IBM Observability by Instana APM and Cloud Pak for Watson AIOps to detect, alert, and manage incidents that affect SLOs and SLIs
Maslow’s “Hierarchy of Needs” was used to represent the needs and behavioral motivation drivers for humans. This pyramid represented a series of basic psychological and self-fulfillment needs.
Maslow’s hierarchy of needs has been adapted and adopted to represent the needs and motivations in other domains, including the needs of applications and services being managed by SREs and IT Operations teams.
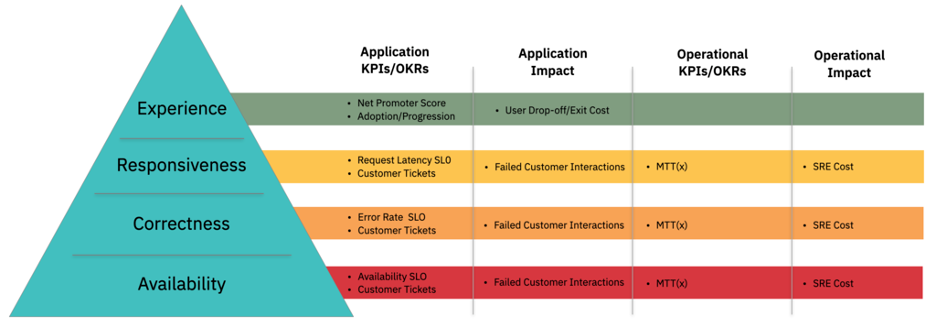
The Application Hierarchy of Needs (shown in the previous figure) is represented with four layers of need:
- User Experience
- Responsiveness
- Correctness
- Availability
The most basic and fundamental need for an application or service is availability and is represented as the base of the pyramid. Put simply, if an application is not available, it cannot process requests and therefore cannot deliver the function and value for which it has been deployed.
Once an application has availability, the next layer is correctness. This covers the correct, and error free running and execution of the application’s functions. If an application is available but does not have correctness and is generating errors when invoked, then it cannot adequately deliver its intended value.
Further, once an application is available and running correctly, the next need is responsiveness. This covers an application having sufficient performance and responsiveness such that the correct function that it provides can be used. If an application’s responsiveness is not sufficient, then the function that it provides becomes less usable or in the worst cases, unusable.
Finally, once an application is available, running correctly and providing sufficient performance, the last need is user experience. This covers the quality of the usability and accessibility for the function provided. If the application is available, correct, and responsive, but the function is difficult to use, then some or all of the features may not be able to deliver all of the intended value.
Measuring application needs
As each of the four layers are needed to deliver on the full value of an application, Key Performance Indicators (KPIs) or Objectives and Key Results (OKRs) measurements should be defined that represent the ability to meet those needs.
The measurements and goals for availability, correctness, and responsiveness are typically done in a common manner through the declaration and tracking of Service Level Objectives (SLOs) using Service Level Indicators (SLIs).
SLOs are specified as the goal that the application should achieve, usually specified as a percentage of succeeding versus failing to meet the objective. For example, an SLO for availability of 99.99% represents the ability to function 99.99% of the time. In a 24-hour time period, that means the application must be available for 23 hours, 59 minutes, and 51.34 seconds, which equates to having no more than 8.66 seconds of downtime. That allowable period of downtime is referred to as the error budget, which is essentially the amount of time that the application can miss its target.
Similarly, an SLO for application performance might be for 99% of requests to complete within 200ms. If there are 10,000 requests in a 24-hour time period, the error budget would be 100 requests that are allowed to be slower than 200ms.
SLIs are then used as the specific measures for the SLOs and should reflect the ability of the application to perform its function in the required manner. In the case of an application or service that exposes a REST API, the SLI for availability might be that the REST API is reachable and able to respond.
The measurements and goals for experience are generally handled separately since the usability of a function is more subjective and requires user input and feedback. There are two approaches to setting goals and measuring user experience:
- The Net Promoter Score (NPS) market research metric. NPS provides a single question survey asking respondents to rate the likelihood as a value between 0 (would not recommend) to 10 (would recommend) a company, product, or a service to other people. This can be used to generate an overall NPS score for the application, which acts as an indicator of success and satisfaction with the function used, and likelihood of using the function again.
- User journeys and adoption funnels through the provided functions, which can be used to determine whether users are achieving successful outcomes. Where it can be applied, this provides a far more quantitative metric and can be used to identify specific areas of problems with the experience.
Across all layers of the hierarchy, there are additional measures of success and performance, including the number and severity of user reported tickets, user journey progression, and so on.
Assessing impact of application failures
Error budgets are a simplistic approach that, in many cases, do not adequately indicate real business or user impact. In contrast, the Failed Customer Interaction (FCI) metric provides a more direct, quantifiable measurement of business value impact when applications are unavailable, unresponsive, or returning errors.
In its most basic form, FCI can be represented as a simple number of failed requests. Where additional request data is available, that representation can be extended with customer information and business impact of failed interactions. For example, failed requests can be grouped based on origination source (web or mobile application) including geo-location information. Failed requests can also be grouped and quantified by the interaction itself, such as the value of goods being purchased from a shopping site.
Measuring the impact of inadequate user experience is challenging. One way to represent the impact is to use progression funnels. These represent application interaction as a number of steps leading to the desired outcome, and measure the progression of the interaction from each step to the next. Interactions failing to progress from one step to the next can be measured as drop-offs that represent interactions that fail to reach the full desired outcome.
SRE and ITOps measurements
In addition to the goals and impact measures for the needs of the application itself, there are goals and impact measures for the SREs and ITOps teams who are managing those applications.
The primary set of goals and measurements for these teams who are managing applications are usually the time and effort that are required to resolve incidents affecting the application’s needs. Time is often represented as a timeline of milestones of the management of an incident:
- Mean Time to Detect
- Mean Time to Identify
- Mean Time to Repair
- Mean Time to Resolve
These represent the time to detect that an incident is occurring, identify the cause of the incident, repair the application so that service is restored, and then resolve the underlying issue in order to ensure that the same problem will not occur again.
Optimizing and reducing these times have two effects. Firstly, it reduces the duration of incidents affecting an application, thereby reducing error budget spend and FCI impact cost. Secondly, it reduces the effort expended by the SRE team to investigate and resolve the incident, thereby reducing the cost of supporting the application.
Improving application needs and reducing impact cost
The key to improving an application’s needs and reducing impact and operational costs is to first be able to measure and track the goals and costs, both for the application and the SRE team.
This starts with observability and the ability to collect comprehensive data on the availability, error rate, and performance of an application, including all IT infrastructure and service dependencies. This comprehensive data set can then be used to create consistent SLOs and SLIs for the application.
Then, you need to combine these goals with automated operations capabilities to detect fault conditions and incidents, isolate and identify the root cause component, and then provide automation to rapidly restore service and carry out incident management.
The combination of IBM Observability by Instana APM and IBM Cloud Pak for Watson AIOPs provides this end-to-end set of capabilities. Instana provides a rich and advanced set of capabilities for setting SLOs and SLIs and detecting and alerting on incidents that affect those goals. Cloud Pak for Watson AIOps enables the management of those events and assisting SREs and ITOps with AI and automation to resolve those incidents and minimize the time to repair and resolve.
Instana and Cloud Pak for Watson AIOps helps SREs and ITOps teams satisfy most, if not all, of the Application Hierarchy of Needs.
Learn more about observability, insights, and automation or more about Instana and Cloud Pak for Watson AIOps on IBM Developer.
Recommend
About Joyk
Aggregate valuable and interesting links.
Joyk means Joy of geeK