

Comparing Graviton (ARM) Performance to Intel and AMD for MySQL (Part 3)
source link: https://www.percona.com/blog/comparing-graviton-arm-performance-to-intel-and-amd-for-mysql-part-3/
Go to the source link to view the article. You can view the picture content, updated content and better typesetting reading experience. If the link is broken, please click the button below to view the snapshot at that time.

 Recently we published the first part (m5, m5a, m6g) and the second part (C5, C5a, C6g) of research regarding comparing Graviton ARM with AMD and Intel CPU on AWS. We selected general-purpose EC2 instances with the same configurations (amount of vCPU in the first part). In the second part, we compared compute-optimized EC2 instances with the same conditions. The main goal was to see the trend and make a general comparison of CPU types on the AWS platform only for MySQL. We didn’t set the goal to compare the performance of different CPU types. Our expertise is in MySQL performance tuning. We share research “as is” with all scripts, and anyone interested could rerun and reproduce it.
All scripts, raw logs and additional plots are available on GitHub:
(arm_cpu_comparison_m5, csv_file_with_all_data_m5,
arm_cpu_comparison_c5, csv_file_with_all_data_c5,
arm_cpu_comparison_m6, csv_file_with_all_data_m6).
We were happy to see the reactions from our Percona Blog readers to our research. And we are open to any feedback. If anyone has any ideas on updating our methodology, we would be happy to correct it.
This post is a continuation of research based on our interest in general-purpose EC2 (and, of course, because we saw that our audience wanted to see it). The main inspiration for this research was the feedback of our readers that we compared different generations of instances, especially old AMD instances (m5a.*), and compared it with the latest Graviton instances (m6g.*). Additionally, we also decided to use the latest Intels instances (m6i.*) too.
Today, we will talk about (AWS) the latest general-purpose EC2: M6i, M6a, M6g (complete list in appendix).
Short Conclusion:
- In most cases for m6i, m6g, and m6a instances, Intel shows better performance in throughput for MySQL read transactions. However, AMD instances are pretty close to Intel’s results.
- Sometimes Intel could show a significant advantage — more than almost 200k rps (almost 45% better) than Graviton. However, AMD’s gap wasn’t as significant as in previous results.
Unfortunately, we compared Graviton with others. So we didn’t concentrate on comparing AMD with Intel. - If we could say in a few words: m6i instances (with Intel) are better in their class than other m6a, m6g instances (in performance for MySql). And this advantage starts from 5%-10% and could be up to 45% compared with other CPUs.
- But Gravitons instances are still cheaper
Details, or How We Got Our Short Conclusion:
Disclaimer:
- Tests were run on M6i.* (Intel) , M6a.* (AMD), M6g.*(Graviton) EC2 instances in the US-EAST-1 region. (List of EC2 see in the appendix). It was selected using only the same class of instances without additional upgrades. The main goal is to take the same instances with only differences in CPU types and identify their performance for MySQL.
- Monitoring was done with Percona Monitoring and Management (PMM).
- OS: Ubuntu 20.04 LTS
- Load tool (sysbench) and target DB (MySQL) installed on the same EC2 instance.
- Oracle MySQL Community Server — 8.0.26-0 — installed from official packages (it was installed from Ubuntu repositories).
- Load tool: sysbench — 1.0.18
- innodb_buffer_pool_size=80% of available RAM
- Test duration is five minutes for each thread and then 90 seconds cool down before the next iteration.
- Tests were run four times independently (to smooth outliers / to have more reproducible results). Then results were averaged for graphs. Also, graphs show min and max values that were during the test, which shows the range of variance.
- We are going to use the “high-concurrency” scenario definition for scenarios when the number of threads would be bigger than the number of vCPU. And “low-concurrent” scenario definition with scenarios where the number of threads would be less or equal to a number of vCPU on EC2.
- We are comparing MySQL behavior on the same class of EC2, not CPU performance.
- We got some feedback regarding our methodology, and we would update it in the next iteration, with a different configuration, but for this particular research we leave previous to have possibility compare “apples to apples”.
- The post is not sponsored by any external company. It was produced using only Percona resources. We do not control what AWS uses as CPU in their instances, we only operate with what they offer.
Test Case:
Prerequisite:
To use only CPU (without disk and network) we decided to use only read queries from memory. To do this we did the following actions.
1. Create DB with 10 tables with 10 000 000 rows each table
2. Load all data to LOAD_buffer
Test:
3. Run in a loop for same scenario but different concurrency THREAD (1,2,4,8,16,32,64,128) on each EC2
Results:
Result reviewing was split into four parts:
- For “small” EC2 with 2, 4, and 8 vCPU
- For “medium” EC2 with 16 and 32 vCPU
- For “large” EC2 with 48 and 64 vCPU
- For all scenarios to see the overall picture.
There would be four graphs for each test:
- Throughput (queries per second) that EC2 could perform for each scenario (number of threads)
- Latency 95 percentile that EC2 could perform for each scenario, (number of threads)
- Relative comparing Graviton and Intel, Graviton, and AMD
- Absolute comparing Graviton and Intel, Graviton and AMD
Validation that all load goes to the CPU, not to DISK I/O or network, was done also using PMM (Percona Monitoring and Management).
pic 0.1. OS monitoring during all test stages
Result for EC2 with 2, 4, and 8 vCPU:
Plot 1.1. Throughput (queries per second) for EC2 with 2, 4 and 8 vCPU for scenarios with 1,2,4,8,16,32,64,128 threads
Plot 1.2. Latencies (95 percentile) during the test for EC2 with 2, 4 and 8 vCPU for scenarios with 1,2,4,8,16,32,64,128 threads

Plot 1.3.1 Percentage comparison Graviton and Intel CPU in throughput (queries per second) for EC2 with 2, 4 and 8 vCPU for scenarios with 1,2,4,8,16,32,64,128 threads

Plot 1.3.2 Percentage comparison Graviton and AMD CPU in throughput (queries per second) for EC2 with 2, 4 and 8 vCPU for scenarios with 1,2,4,8,16,32,64,128 threads

Plot 1.4.1. Numbers comparison Graviton and Intel CPU in throughput (queries per second) for EC2 with 2, 4 and 8 vCPU for scenarios with 1,2,4,8,16,32,64,128 threads
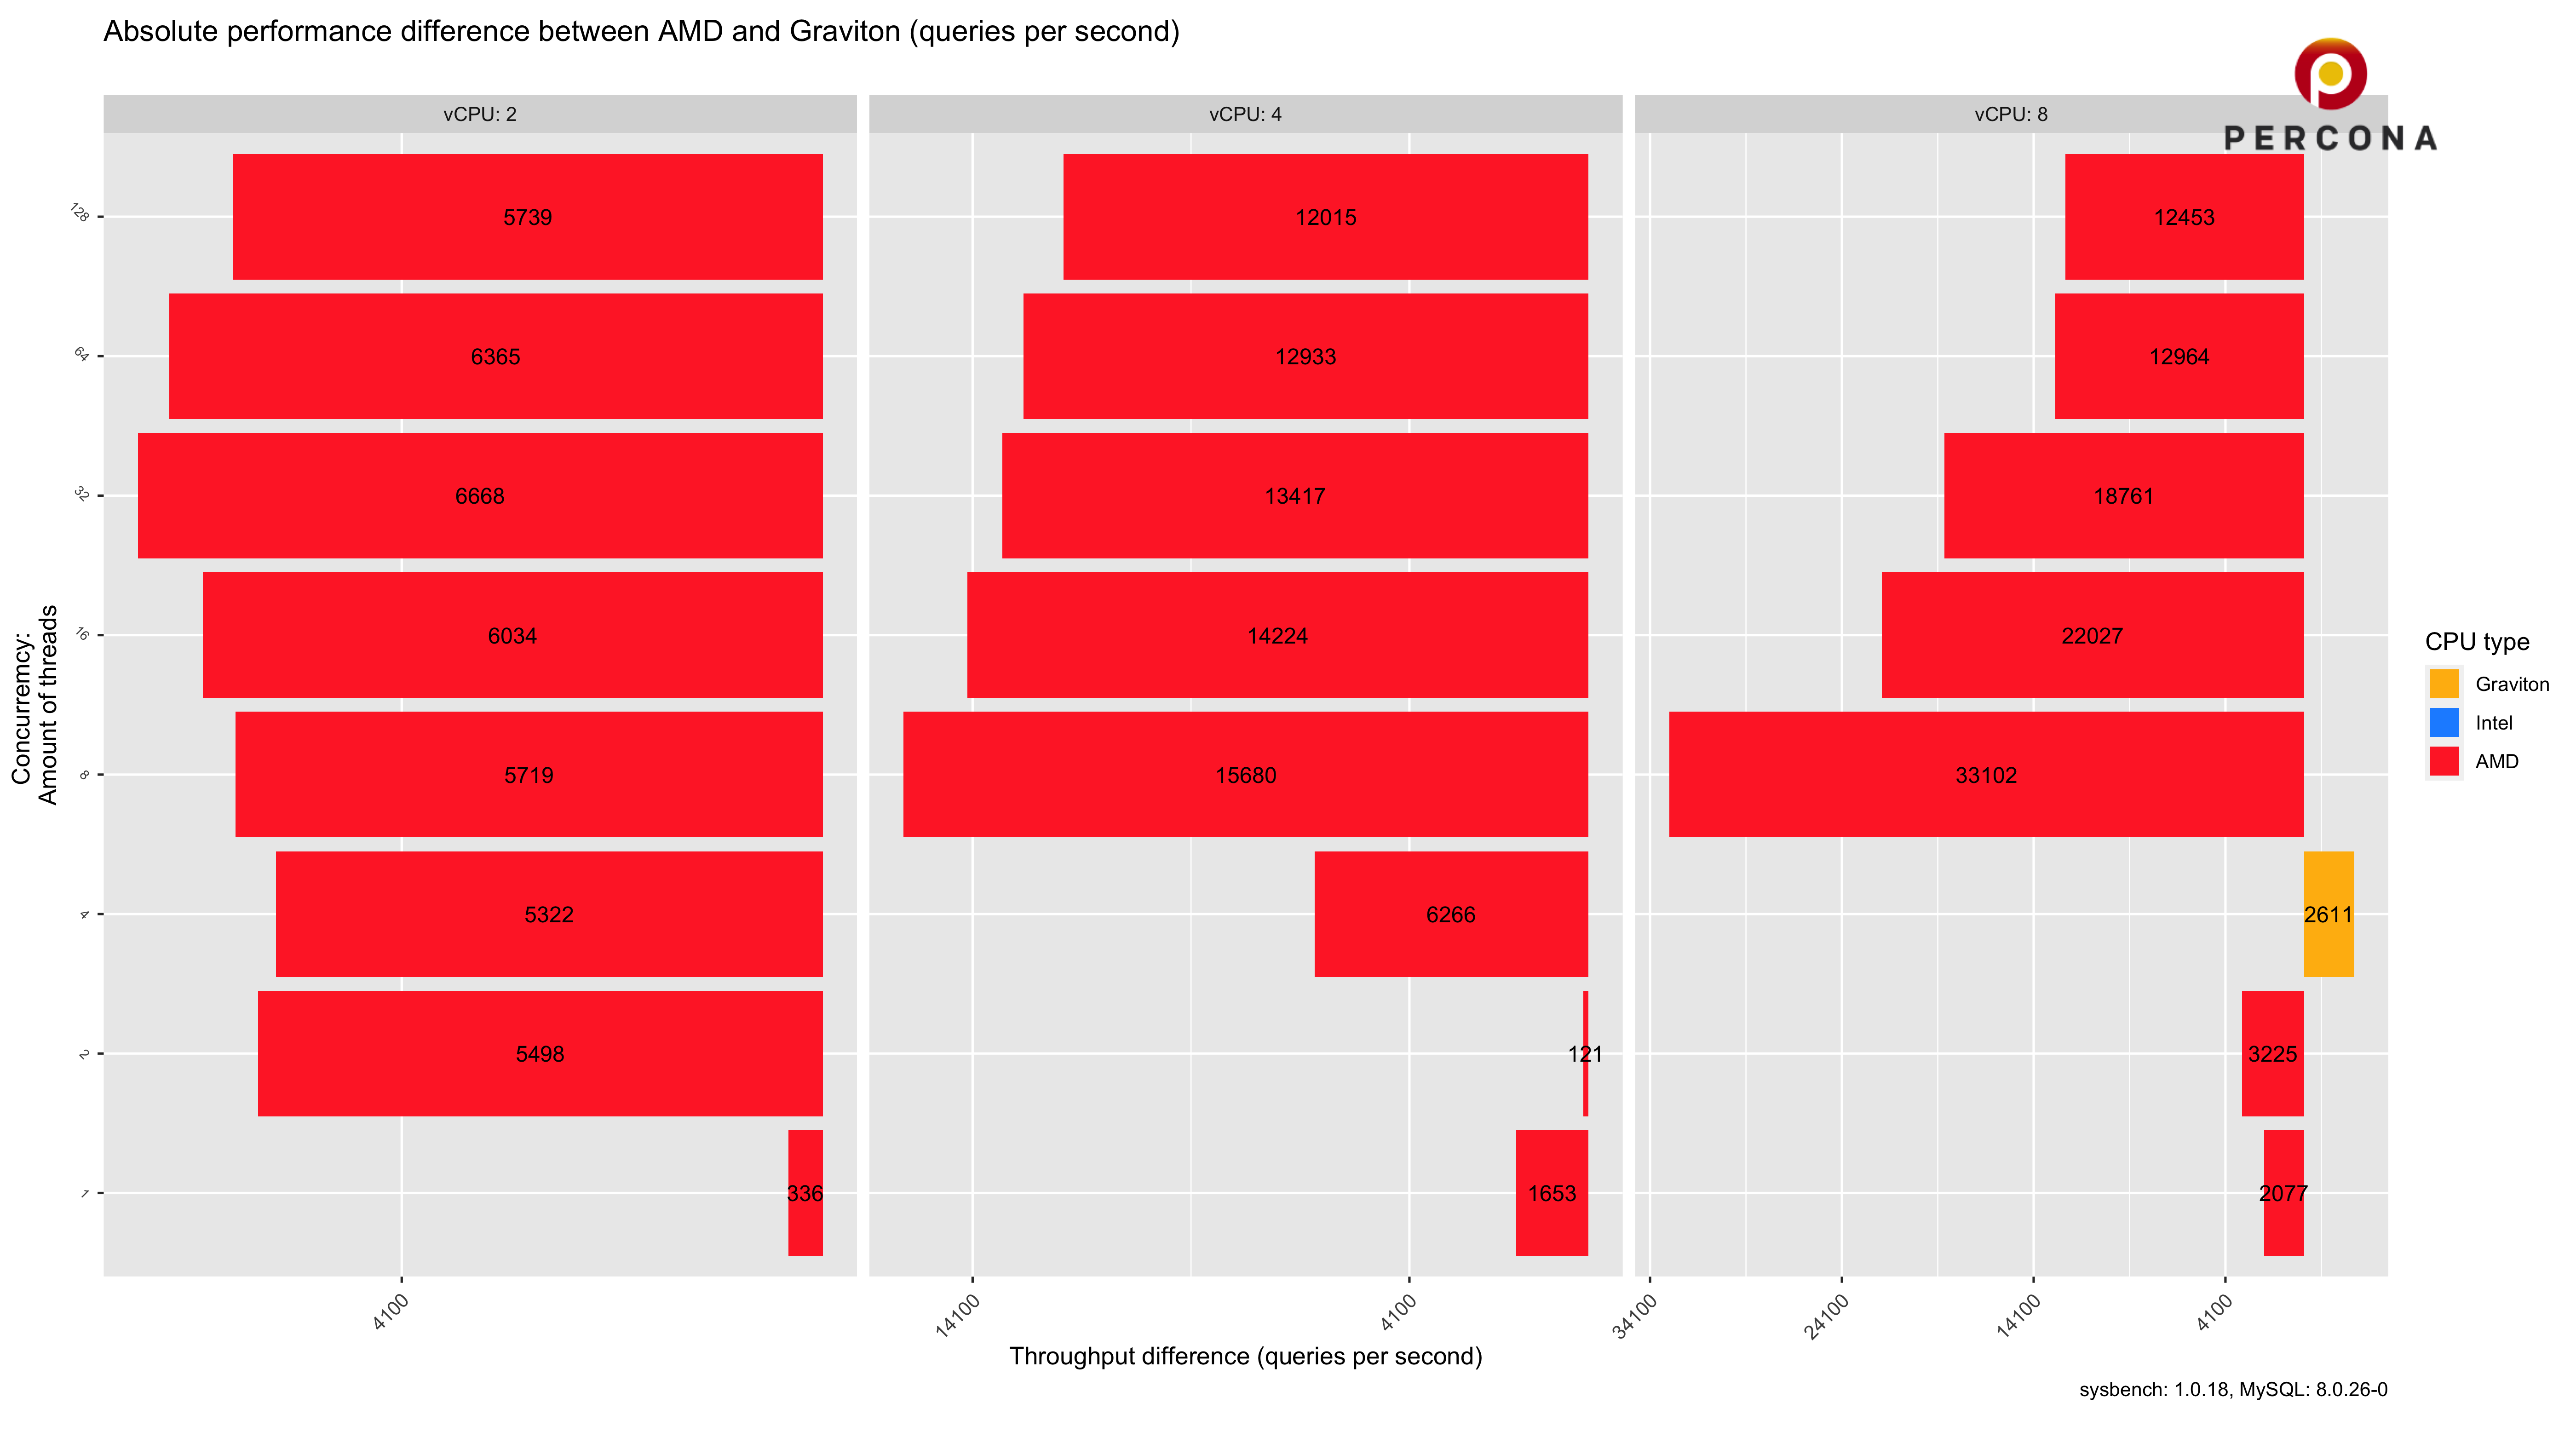
Plot 1.4.2. Numbers comparison Graviton and Intel CPU in throughput (queries per second) for EC2 with 2, 4 and 8 vCPU for scenarios with 1,2,4,8,16,32,64,128 threads
OVERVIEW:
- Based on plot 1.1. We could say that EC2 with Intel hasn’t an absolute advantage compared with Graviton and AMD.
- Especially Intel and AMD, showing an advantage a little bit over – 20% over Graviton.
- In numbers, it is over five thousand and more requests per second.
- AMD showed better results for two vCPU instances.
- And it looks like in M6 class of Gravitons CPUs show the worst result compared with others.
Result for EC2 with 16 and 32 vCPU:

Plot 2.1. Throughput (queries per second) for EC2 with 16 and 32 vCPU for scenarios with 1,2,4,8,16,32,64,128 threads

Plot 2.2. Latencies (95 percentile) during the test for EC2 with 16 and 32 vCPU for scenarios with 1,2 4,8,16,32,64,128 threads

Plot 2.3.1 Percentage comparison Graviton and Intel CPU in throughput (queries per second) for EC2 with 16 and 32 vCPU for scenarios with 1,2,4,8,16,32,64,128 threads

Plot 2.3.2 Percentage comparison Graviton and AMD CPU in throughput (queries per second) for EC2 with 16 and 32 vCPU for scenarios with 1,2,4,8,16,32,64,128 threads

Plot 2.4.1. Numbers comparison Graviton and Intel CPU in throughput (queries per second) for EC2 with 16 and 32 vCPU for scenarios with 1,2,4,8,16,32,64,128 threads

Plot 2.4.2. Numbers comparison Graviton and AMD CPU in throughput (queries per second) for EC2 with 16 and 32 vCPU for scenarios with 1,2,4,8,16,32,64,128 threads
OVERVIEW:
- Plot 2.1 shows that Intel vCPU is more performance efficient. AMD is the second, and Graviton is the third.
- According to plots 2.3.1 and 2.3.2, Intel is better than Graviton up to 30 % and AMD is better than Graviton up to 20%. Graviton has some exceptional performance advantage over AMD in some scenarios. But with this configuration and this instance classes, it is an exception according to the plot 2.3.2 scenarios for 8 and 16 concurrent threads.
- In real numbers, Intel could execute up to 140 k read transactions more than Graviton CPUs, and AMD could read more than 70 k read transactions than Graviton. (plot 2.1. , plot 2.4.1.)
- In most cases, AMD and Intel are better than Graviton EC2 instances (plot 2.1, plot 2.3.2, plot 2.4.2).
Result for EC2 with 48 and 64 vCPU:

Plot 3.1. Throughput (queries per second) for EC2 with 48 and 64 vCPU for scenarios with 1,2,4,8,16,32,64,128 threads

Plot 3.2. Latencies (95 percentile) during the test for EC2 with 48 and 64 vCPU for scenarios with 1,2 4,8,16,32,64,128 threads

Plot 3.3.1 Percentage comparison Graviton and Intel CPU in throughput (queries per second) for EC2 with 48 and 64 vCPU for scenarios with 1,2,4,8,16,32,64,128 threads

Plot 3.3.2 Percentage comparison Graviton and AMD CPU in throughput (queries per second) for EC2 with 48 and 64 vCPU for scenarios with 1,2,4,8,16,32,64,128 threads

Plot 3.4.1. Numbers comparison Graviton and Intel CPU in throughput (queries per second) for EC2 with 48 and 64 vCPU for scenarios with 1,2,4,8,16,32,64,128 threads

Plot 3.4.2. Numbers comparison Graviton and AMD CPU in throughput (queries per second) for EC2 with 48 and 64 vCPU for scenarios with 1,2,4,8,16,32,64,128 threads
OVERVIEW:
- For “Large” instances, Intel is still better than other vCPU. AMD was still in second place, except when Graviton stole some cases. (plot 3.1.)
- According to plot 3.3.1. Intel showed an advantage over Graviton up to 45%. On the other hand, AMD showed an advantage over Graviton up to 20% in the same case.
- There were two cases when Graviton showed some better results, but it is an exception.
- In real numbers: Intel could generate over 150k-200k read transactions more than Graviton. And AMD could execute more than 70k – 130k read transactions than Graviton.
Full Result Overview:

Plot 4.1.1. Throughput (queries per second) – bar plot for EC2 with 2, 4, 8, 16, 32, 48 and 64 vCPU for scenarios with 1,2,4,8,16,32,64,128 threads

Plot 4.1.2. Throughput (queries per second) – line plot for EC2 with 2, 4, 8, 16, 32, 48 and 64 vCPU for scenarios with 1,2,4,8,16,32,64,128 threads

Plot 4.2.1. Latencies (95 percentile) during the test – bar plot for EC2 with 2, 4, 8, 16, 32, 48 and 64 vCPU for scenarios with 1,2,4,8,16,32,64,128 threads

Plot 4.2.2. Latencies (95 percentile) during the test – line plot for EC2 with 2, 4, 8, 16, 32, 48 and 64 vCPU for scenarios with 1,2,4,8,16,32,64,128 threads

Plot 4.3.1 Percentage comparison Graviton and Intel CPU in throughput (queries per second) for EC2 with 2, 4, 8, 16, 32, 48 and 64 vCPU for scenarios with 1,2,4,8,16,32,64,128 threads

Plot 4.3.2 Percentage comparison Graviton and AMD CPU in throughput (queries per second) for EC2 with 2, 4, 8, 16, 32, 48 and 64 vCPU for scenarios with 1,2,4,8,16,32,64,128 threads

Plot 4.4.1. Numbers comparison Graviton and Intel CPU in throughput (queries per second) for EC2 with 2, 4, 8, 16, 32, 48 and 64 vCPU for scenarios with 1,2,4,8,16,32,64,128 threads

Plot 4.4.2. Numbers comparison Graviton and AMD CPU in throughput (queries per second) for EC2 with 2, 4, 8, 16, 32, 48 and 64 vCPU for scenarios with 1,2,4,8,16,32,64,128 threads

Plot 4.5.1. Percentage comparison INTEL and AMD CPU in throughput (queries per second) for EC2 with 2, 4, 8, 16, 32, 48 and 64 vCPU for scenarios with 1,2,4,8,16,32,64,128 threads

Plot 4.5.2. Numbers comparison INTEL and AMD CPU in throughput (queries per second) for EC2 with 2, 4, 8, 16, 32, 48 and 64 vCPU for scenarios with 1,2,4,8,16,32,64,128 threads
Final Thoughts
- We compare general-purpose EC2 (m6i, m6a, m6g) instances from the AWS platform and their behavior for MySQL.
- In these competitions, Graviton instances (m6g) do not provide any competitive results for MySQL.
- There was some strange behavior. AMD and Intel showed their best performance when loaded (in the number of threads) are equal numbers of vCPU. According to plot 4.1.2. We could see some jump in performance when the load becomes the same as the amount of vCPU. This point was hard to see on the bar chart. But this is very interesting. However, Graviton worked more slightly without any “jumps”, and that’s why it showed exceptionally better results in some scenarios with AMD.
- Last point. Everyone wants to see an AMD vs Intel comparison. Plot 4.5.1 and 4.5.2. The result – Intel is better in most cases. And AMD was better only in one case with 2 vCPU. So the advantage of Intel compared with AMD could rise up to 96% for “large instances” (in some cases). It is unbelievable. But in most cases, this advantage is that Intel could run in 30% more MySql read transactions than AMD.
- It is still an open question regarding the economic efficiency of all this EC2. We would research this topic and answer this question a little bit later.
APPENDIX:
List of EC2 used in research:
CPU type Cpu info:
Model name
EC2 Memory GB Amount vCPU EC2 price per hour (USD)
AMD AMD EPYC 7R13 Processor 2650 MHz m6a.large 8 2 $0.0864
AMD m6a.xlarge 16 4 $0.1728
AMD m6a.2xlarge 32 8 $0.3456
AMD m6a.4xlarge 64 16 $0.6912
AMD m6a.8xlarge 128 32 $1.3824
AMD m6a.12xlarge 192 48 $2.0736
AMD m6a.16xlarge 256 64 $2.7648
Graviton ARMv8 AWS Graviton2 2500 MHz m6g.large 8 2 $0.077
Graviton m6g.xlarge 16 4 $0.154
Graviton m6g.2xlarge 32 8 $0.308
Graviton m6g.4xlarge 64 16 $0.616
Graviton m6g.8xlarge 128 32 $1.232
Graviton m6g.12xlarge 192 48 $1.848
Graviton m6g.16xlarge 256 64 $2.464
Intel Intel(R) Xeon(R) Platinum 8375C CPU @ 2.90GHz m6i.large 8 2 $0.096000
Intel m6i.xlarge 16 4 $0.192000
Intel m6i.2xlarge 32 8 $0.384000
Intel m6i.4xlarge 64 16 $0.768000
Intel m6i.8xlarge 128 32 $1.536000
Intel m6i.12xlarge 192 48 $2.304000
Intel m6i.16xlarge 256 64 $3.072000
my.cnf:
Recommend
About Joyk
Aggregate valuable and interesting links.
Joyk means Joy of geeK