

How Correlated are the Web 2 and Web 3 Software Markets?
source link: https://tomtunguz.com/software_crypto_correlation/
Go to the source link to view the article. You can view the picture content, updated content and better typesetting reading experience. If the link is broken, please click the button below to view the snapshot at that time.

How Correlated are the Web 2 and Web 3 Software Markets?
Posted on 2022, Jan 13
2 mins read
In the last few weeks, public software company multiples have halved. As have cryptocoins. Solana and Etherum followed Snowflake and Elastic downwards. So much for the Santa Claus rally. Both declines seem to have been catalyzed by the Fed’s intention to hike the Fed Funds rate three to four times in 2022.
Beyond the most recent cycle, how often do the web2 and web3 software markets move in synchrony? After all, Web3 is a future incarnation of software and infrastructure. Like high growth startups, cryptocoins are considered risk assets by the market. Is historical data compelling enough to hypothesize that investors' rotation out of high-growth software should be mirrored in crypto?
I’ve indexed the performance of four assets over the last five years: public software companies (CLD), Bitcoin (BTC), Ethereum (ETH), and the 10 Year Treasury yield (TNX).
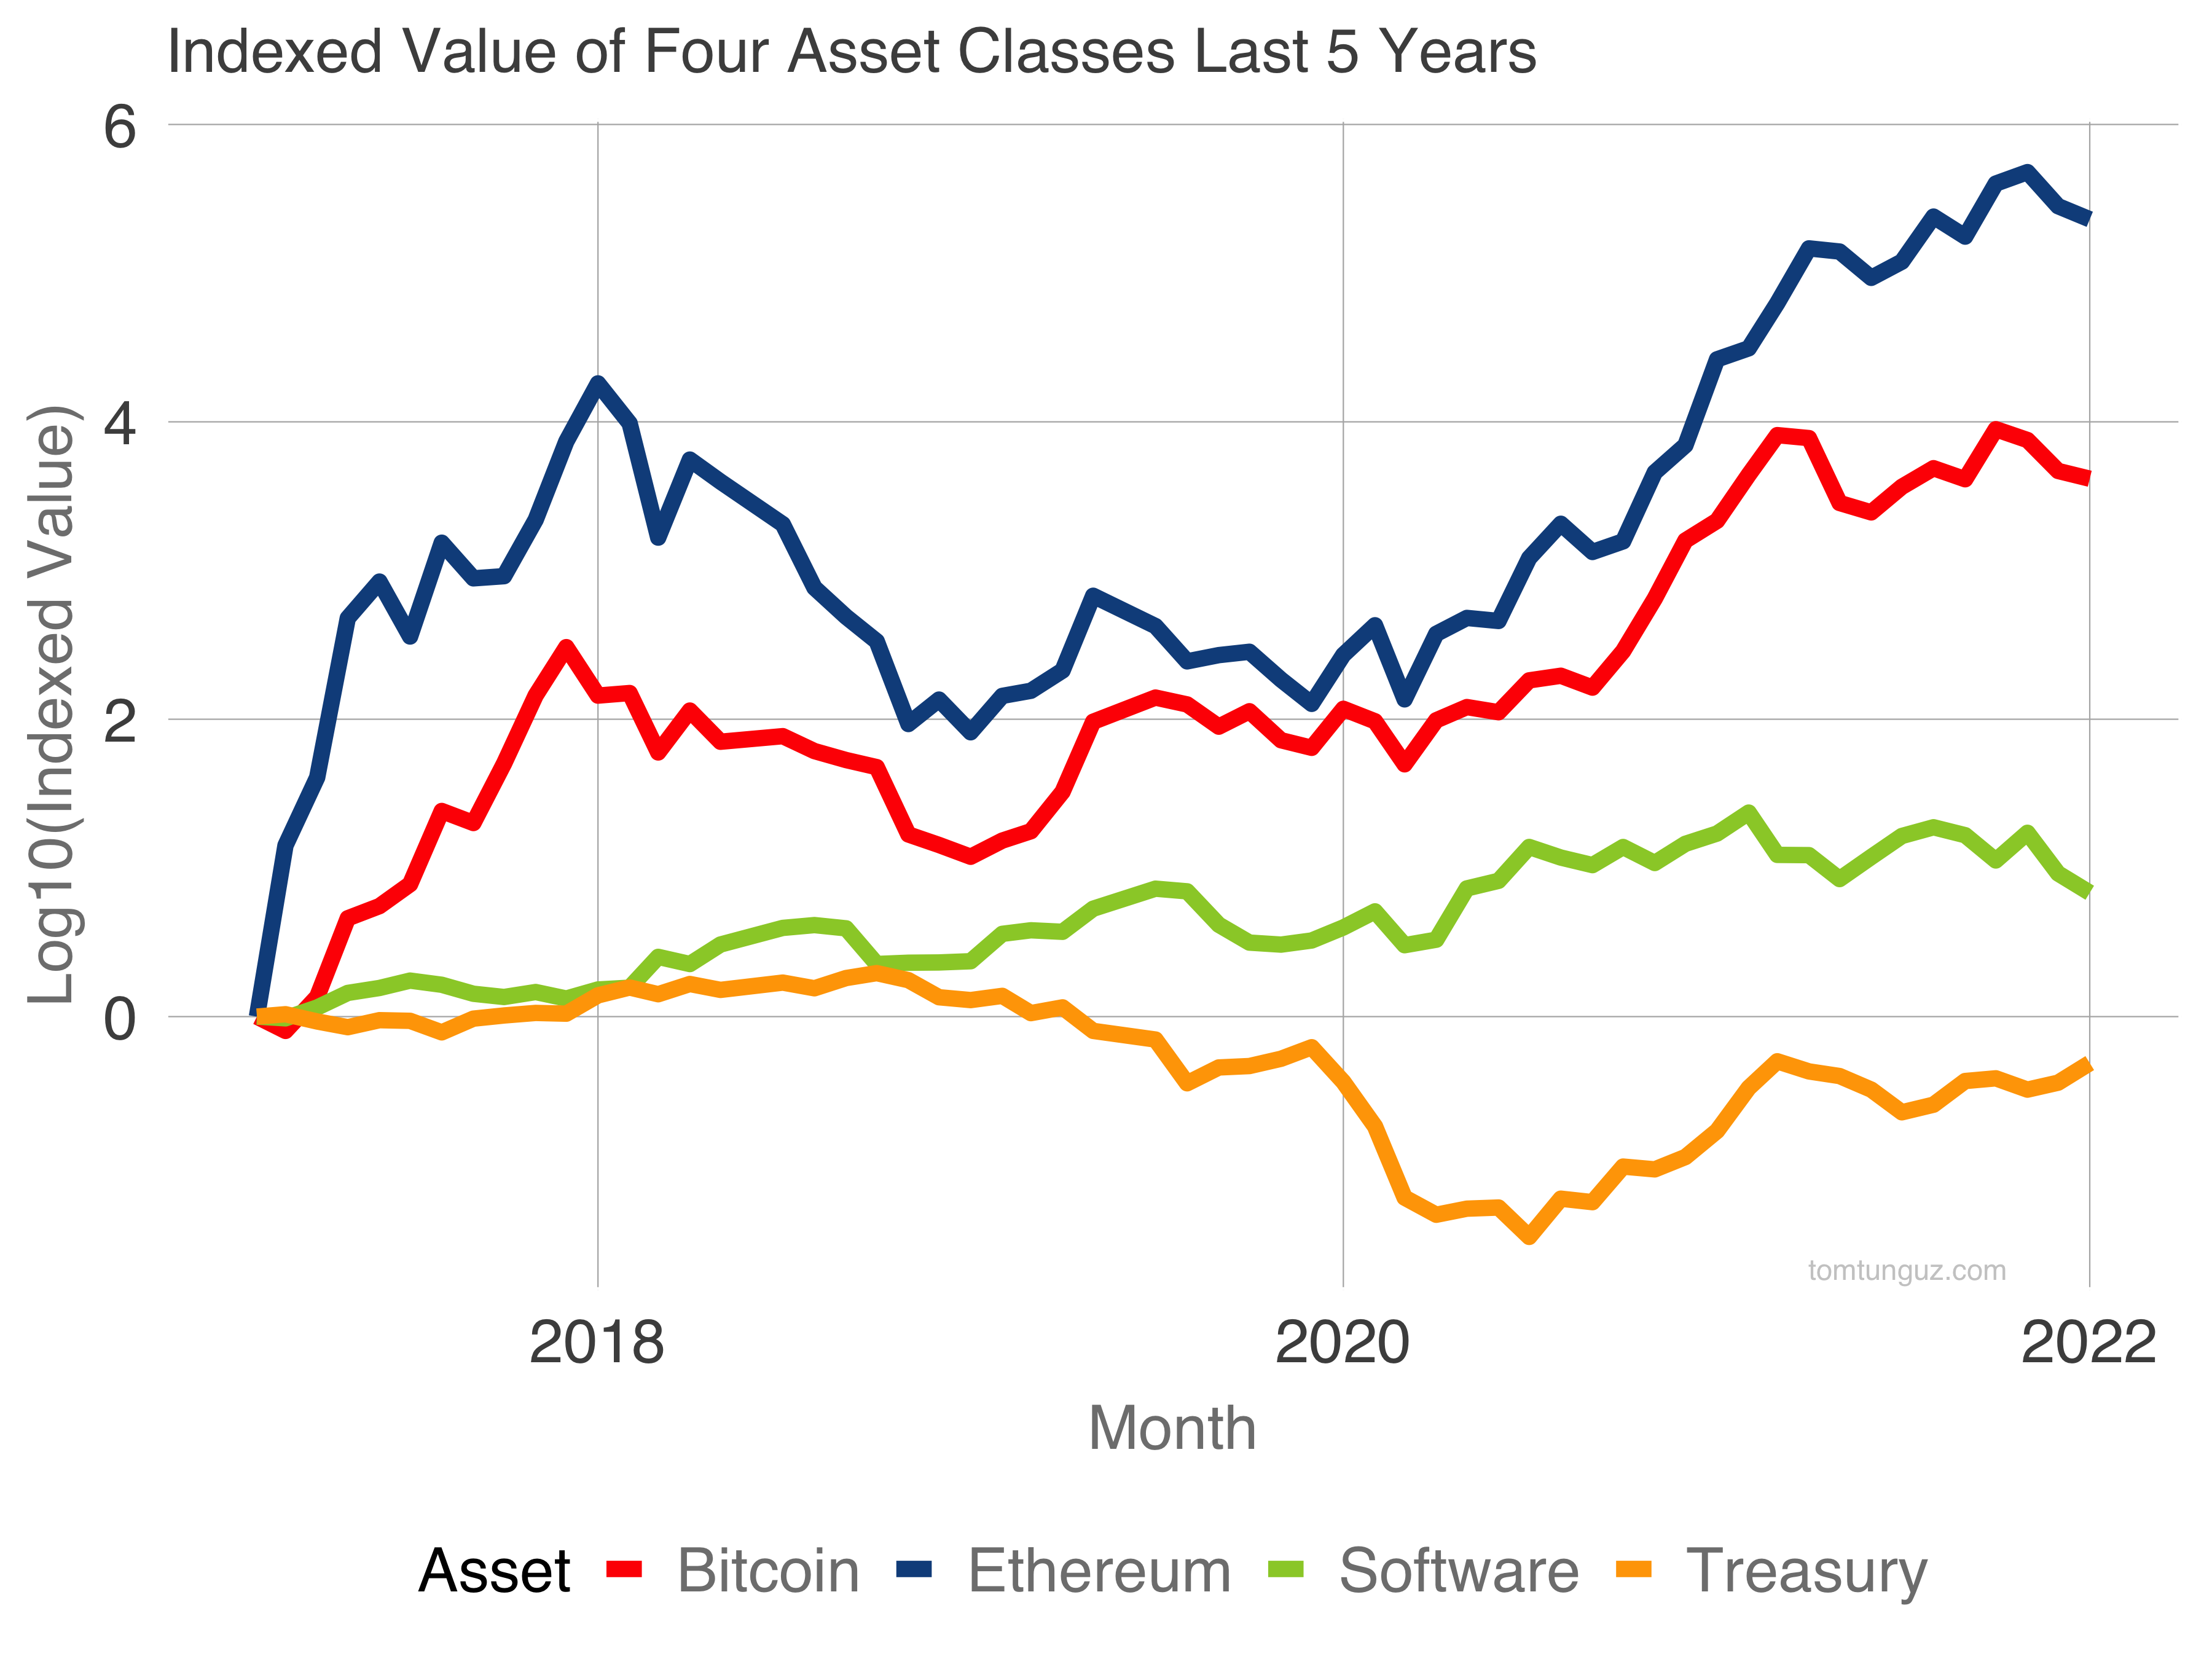
BTC, ETH and Software have all increased over the last five years (notice the y-axis is log10 scale). The cryptocoins appreciated much more than software. Meanwhile, the yield on the 10 year Treasury declined.
Over that period, the correlations between these assets are tight.
Factor Correlation with Software
BTC 0.76
ETH 0.61
TNX -0.67
BTC and ETH chart a 0.76 and 0.61 correlation with software suggesting the markets do move in parallel. In contrast, the 10 Year Treasury yield negatively correlates at -0.67 implying software market value tends to increase with lower rates.
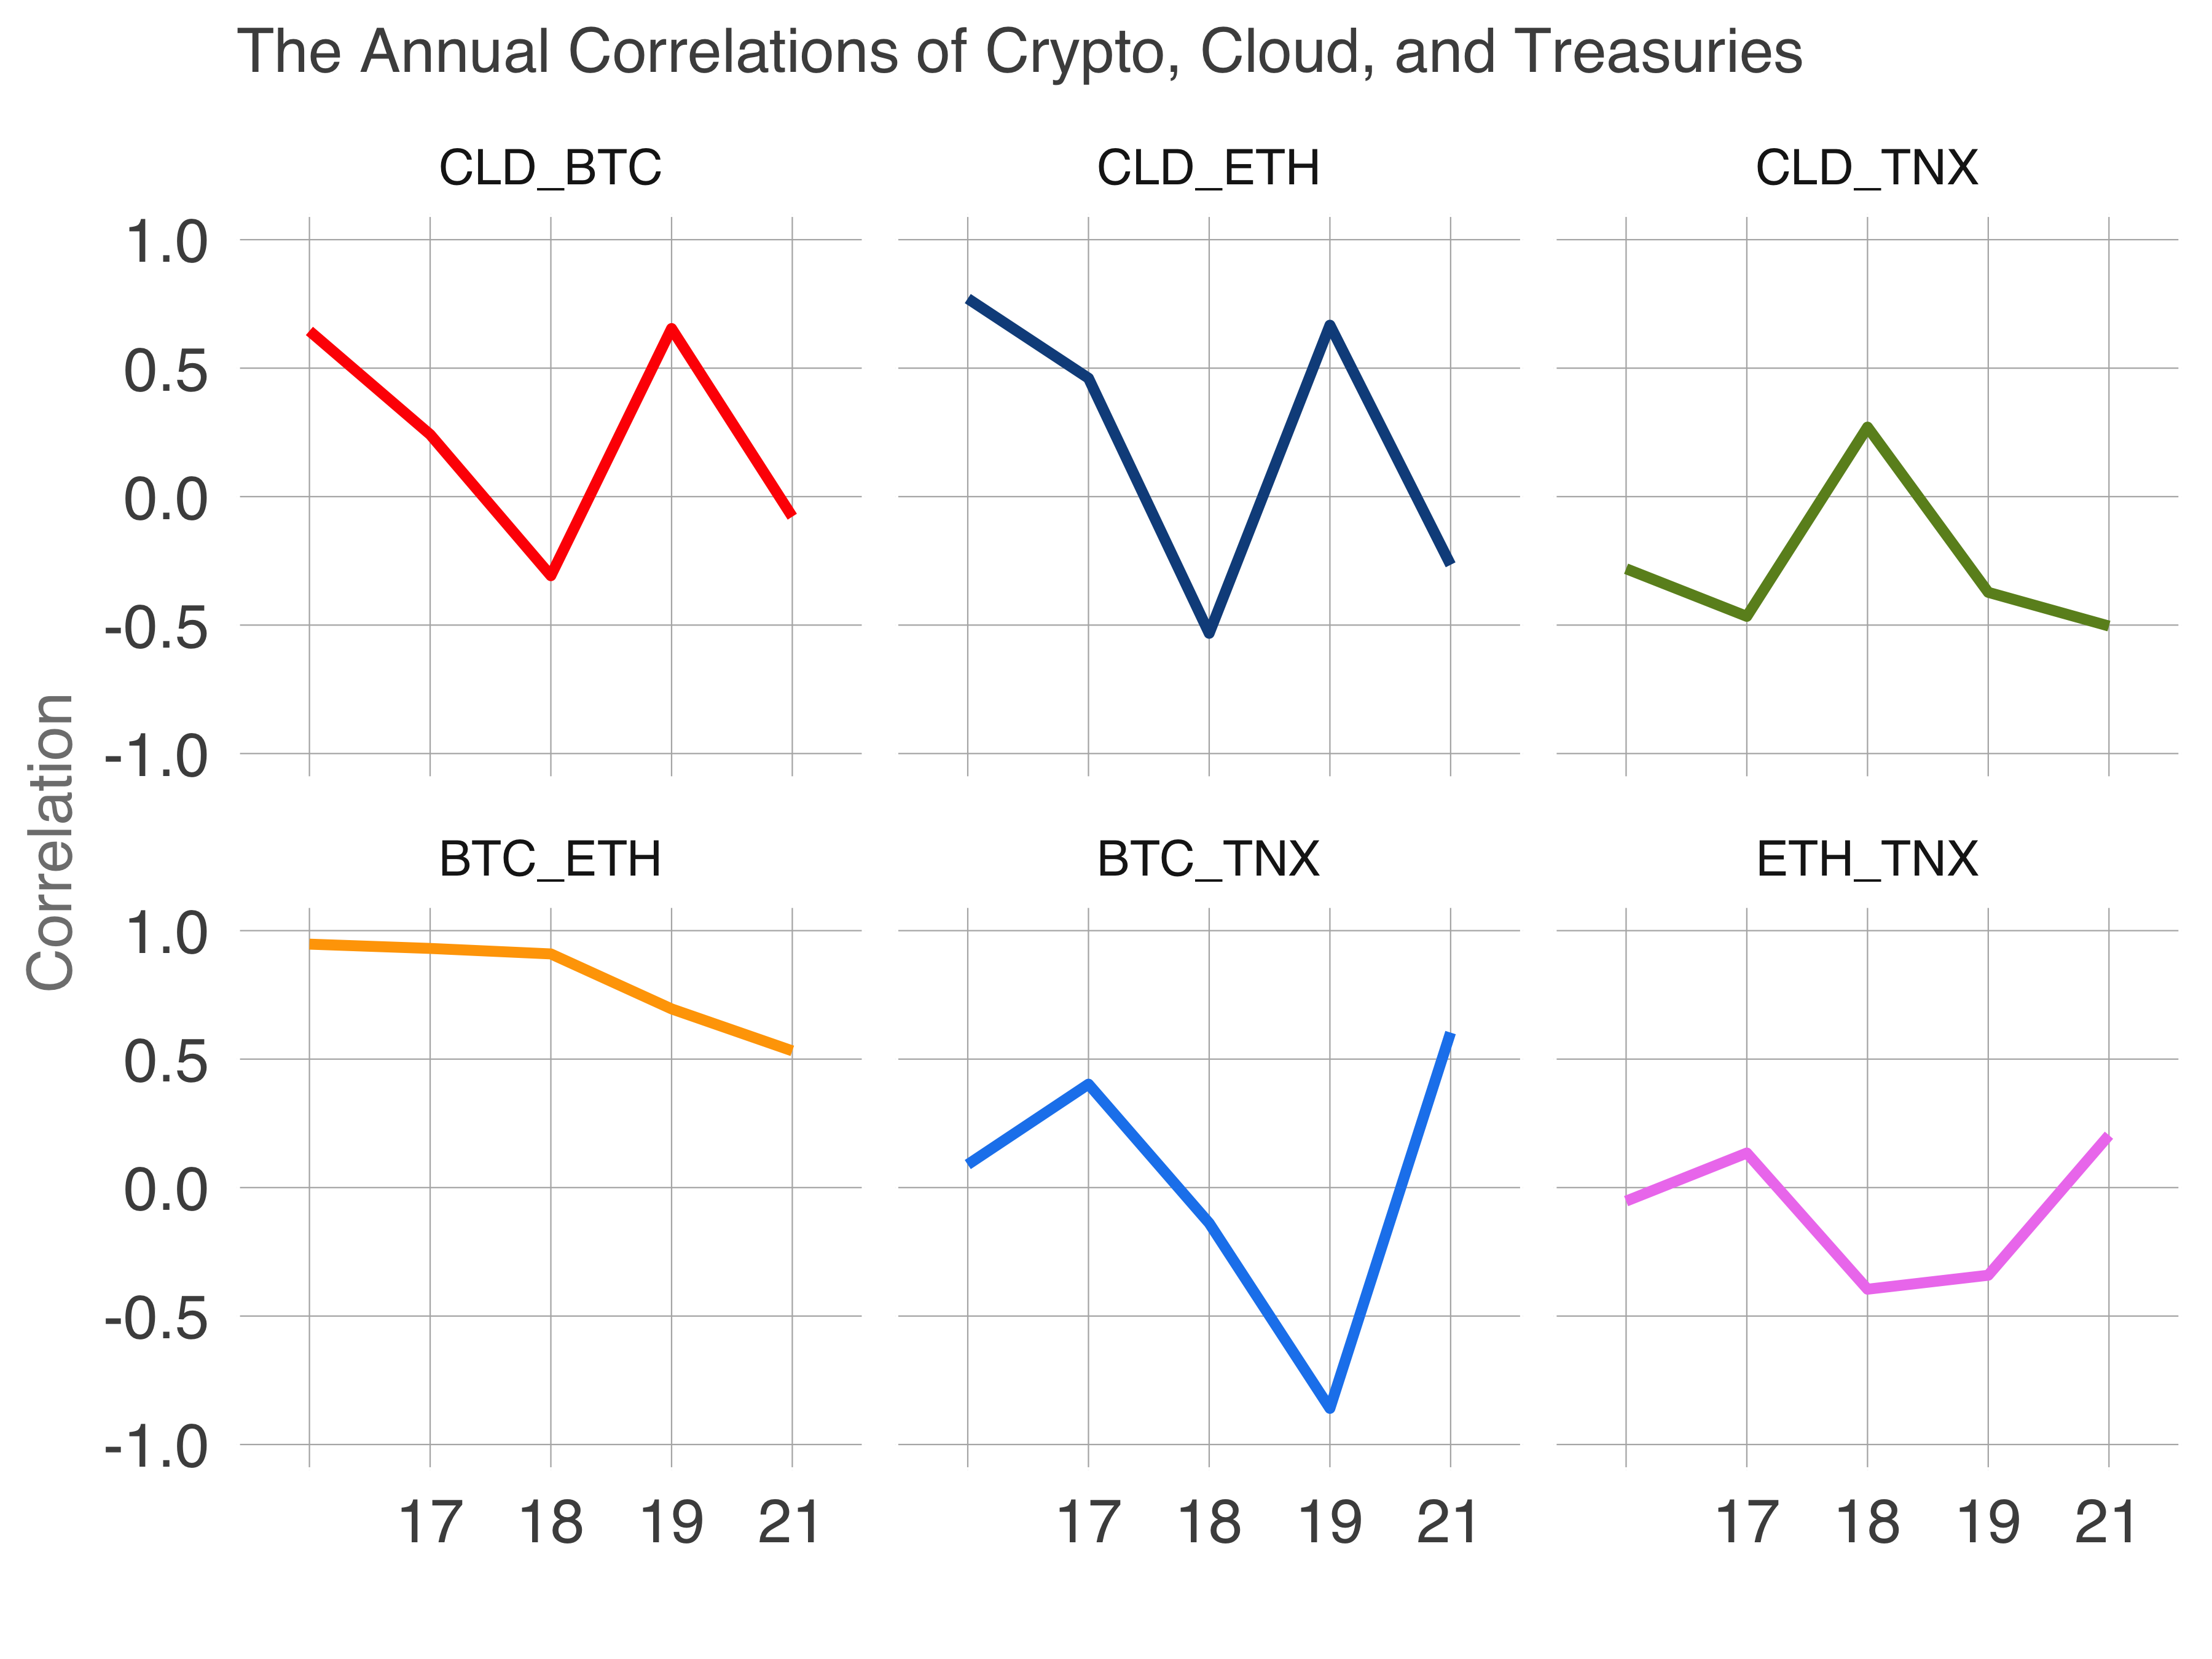
Plotting the pairwise correlations by year uncovers a few trends not apparent in the five year analysis.
- CLD has a volatile relationship with BTC and ETH, the correlation hopping from one foot of 0.6 to to the other at -0.3 and back again.
- CLD correlates negatively to the 10 year yield at around 0.5. Economics students would argue the discounted cash flow model predicts this behavior. Companies with profits in future years should be less valuable during times of higher interest rates.
- BTC and ETC moved more or less in synchrony from 2016 to 2018. Three years ago, they went their separate ways. Price movements diverged and the gap has widened over time, suggesting investors view them differently; perhaps one as a store of value and the other a utility token.
Over longer epochs, the web2 and web3 markets seem to move in parallel. But the data makes plain that investors don’t view these two asset classes interchangeably. Some years, crypto moves with software. Others, cryptocoins move the opposite way.
Both web2 and web3 software are risk assets but each market marches to its own beat.
Recommend
About Joyk
Aggregate valuable and interesting links.
Joyk means Joy of geeK