
7

【OpenCV3】直方图、频域
source link: https://www.guofei.site/2020/06/06/cv3.html
Go to the source link to view the article. You can view the picture content, updated content and better typesetting reading experience. If the link is broken, please click the button below to view the snapshot at that time.

版权声明:本文作者是郭飞。转载随意,但需要标明原文链接,并通知本人
原文链接:https://www.guofei.site/2020/06/06/cv3.html
直方图
画出直方图
o = cv2.imread("a2.jpeg")
plt.hist(o.ravel(), 256)
plt.show()
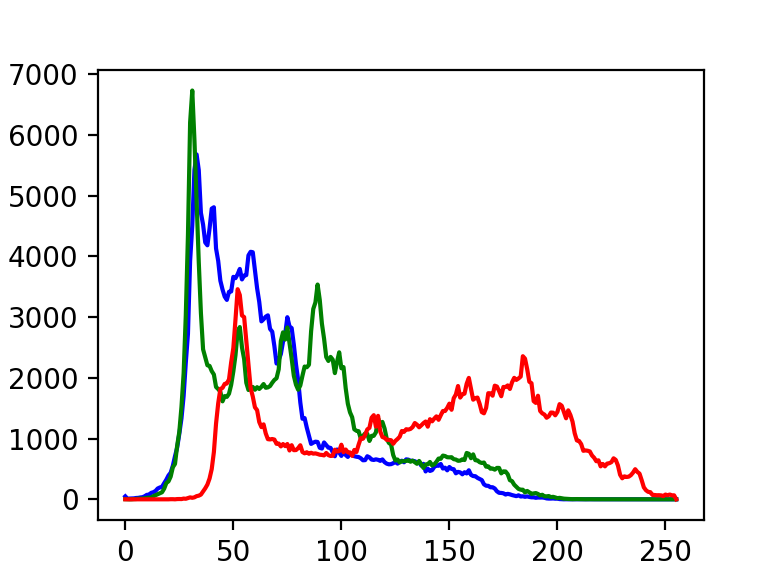
或者用cv2自带的工具画图
histb = cv2.calcHist([o], [0], None, [256], [0, 255])
histg = cv2.calcHist([o], [1], None, [256], [0, 255])
histr = cv2.calcHist([o], [2], None, [256], [0, 255])
plt.plot(histb, color='b')
plt.plot(histg, color='g')
plt.plot(histr, color='r')
plt.show()
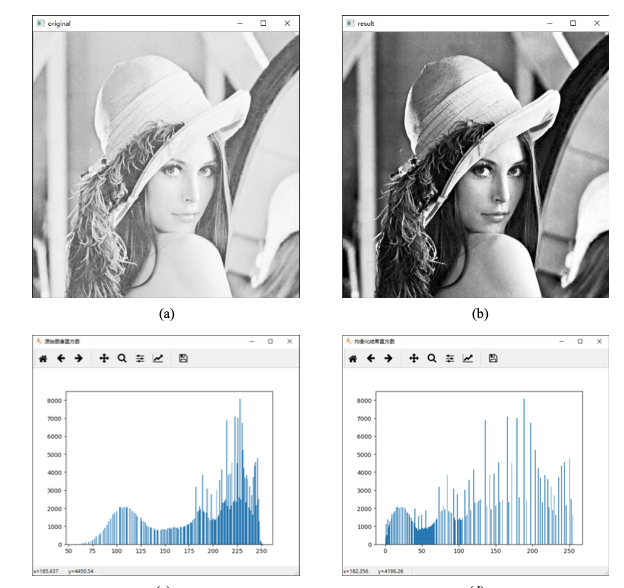
直方图均衡化
import cv2
import matplotlib.pyplot as plt

# -----------读取原始图像---------------
img = cv2.imread('a2.jpeg', cv2.IMREAD_GRAYSCALE)
# -----------直方图均衡化处理---------------
equ = cv2.equalizeHist(img)
# -----------显示均衡化前后的图像---------------
cv2.imshow("original", img)
cv2.imshow("result", equ)
# -----------显示均衡化前后的直方图---------------
plt.figure("原始图像直方图")  # 构建窗口
plt.hist(img.ravel(), 256)
plt.figure("均衡化结果直方图")
# 构建新窗口
plt.hist(equ.ravel(), 256)
# ----------等待释放窗口---------------------
cv2.waitKey()
cv2.destroyAllWindows()
傅立叶变换
numpy 实现
返回值 = np.fft.fft2(原始图像)

# 零频率分量位于频域图像的左上角

# 为了便于观察,通常会使用numpy.fft.fftshift()函数将零频率成分 移动到频域图像的中心位置

# 对图像进行傅里叶变换后,得到的是一个复数数组。为了显示为图像,需要将它们的值调 整到[0, 255]的灰度空间内,使用的公式为:
# 像素新值=20*np.log(np.abs(频谱值))
import cv2
import numpy as np
import matplotlib.pyplot as plt
img = cv2.imread('image\\lena.bmp',0)
f = np.fft.fft2(img)
fshift = np.fft.fftshift(f)
magnitude_spectrum = 20*np.log(np.abs(fshift))
plt.subplot(121)
plt.imshow(img, cmap = 'gray')
您的支持将鼓励我继续创作!
Recommend
About Joyk
Aggregate valuable and interesting links.
Joyk means Joy of geeK