

日志打印导致接口响应率下跌分析
source link: https://wakzz.cn/2021/12/16/java/%E6%97%A5%E5%BF%97%E6%89%93%E5%8D%B0%E5%AF%BC%E8%87%B4%E6%8E%A5%E5%8F%A3%E5%93%8D%E5%BA%94%E7%8E%87%E4%B8%8B%E8%B7%8C%E5%88%86%E6%9E%90/
Go to the source link to view the article. You can view the picture content, updated content and better typesetting reading experience. If the link is broken, please click the button below to view the snapshot at that time.

日志打印导致接口响应率下跌分析
先前在开发环境对一台测试节点进行压测时,由于参数配置错误导致请求没有业务处理直接报错。随即停止压测后登录测试机器排查日志,以外发现虽然已经没有请求到该节点,但应用依然在打印错误日志,并且看日志时间是在打印几分钟前请求的日志。
当时第一反应是异步打印的日志出现堆积,于是查看了该应用所在节点的物理资源,发现CPU已经满荷载,以及JVM触发了多次Full GC和OOM。
最近同事遇到类似的问题,虽然现象有所区别,他们系统的现象是CPU使用率始终在24%,业务接口响应耗时变长,但本质上和我原先在开发环境遇到的问题一直,都是异步打印日志堆积导致的问题。
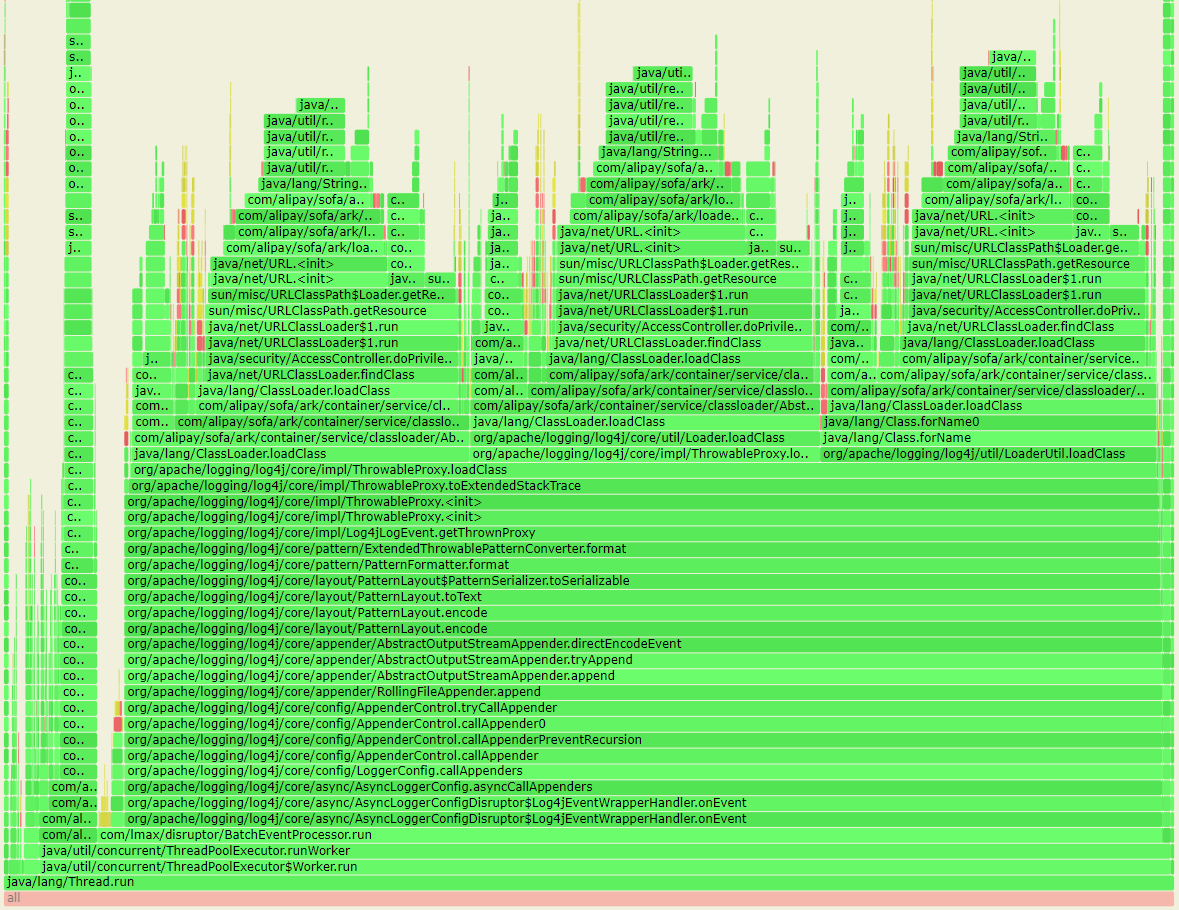
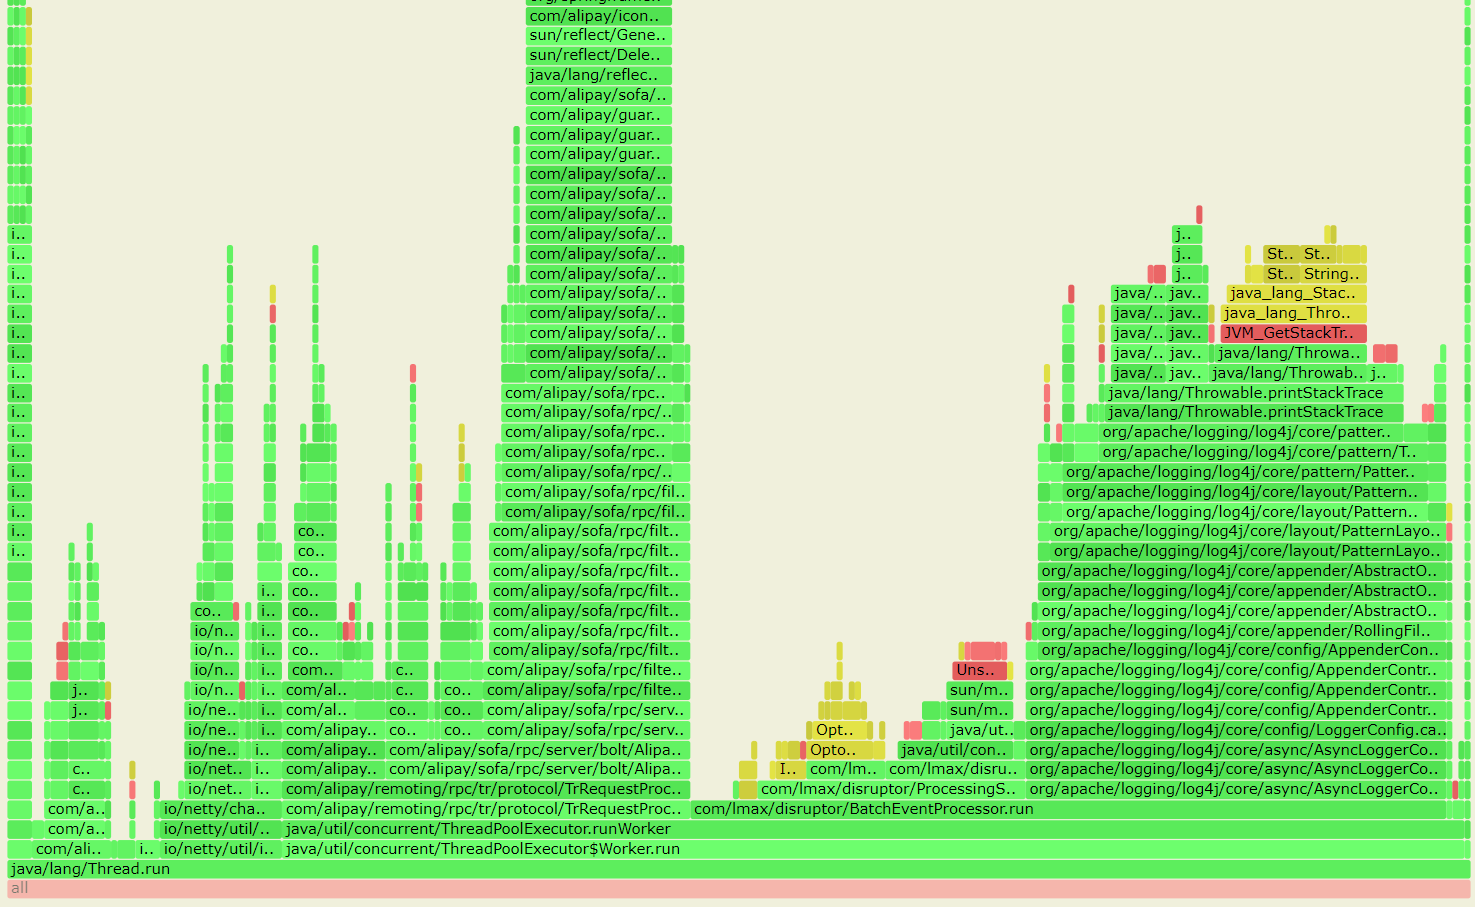
线下节点重启后,以50TPS的速率故意发起错误请求的压测,果然稳定复现CPU满载的问题,因此盲猜是因为CPU满载导致异步日志打印速率慢,生产速度高于消费速度而出现日志堆积的情况,最终内存耗尽触发Full GC和OOM。通过arthas打印CPU火焰图后,发现CPU资源的消耗主要分布在日志异步打印时Class类加载方面,火焰图如下:
我们复现的应用是SofaArk应用,SofaArk设计了多个类加载器,因此这里首先要聊一聊SofaArk的类加载机制:SofaArk中有两种类加载器:PluginClassLoader和BizClassLoader。SofaArk为了提供模块瘦身的能力,提前将大量的常用依赖jar包已经加载到SofaArk中,开发者就不需要再将这些依赖包再打包到运行jar包中,从而显著降低了运行包的体积。
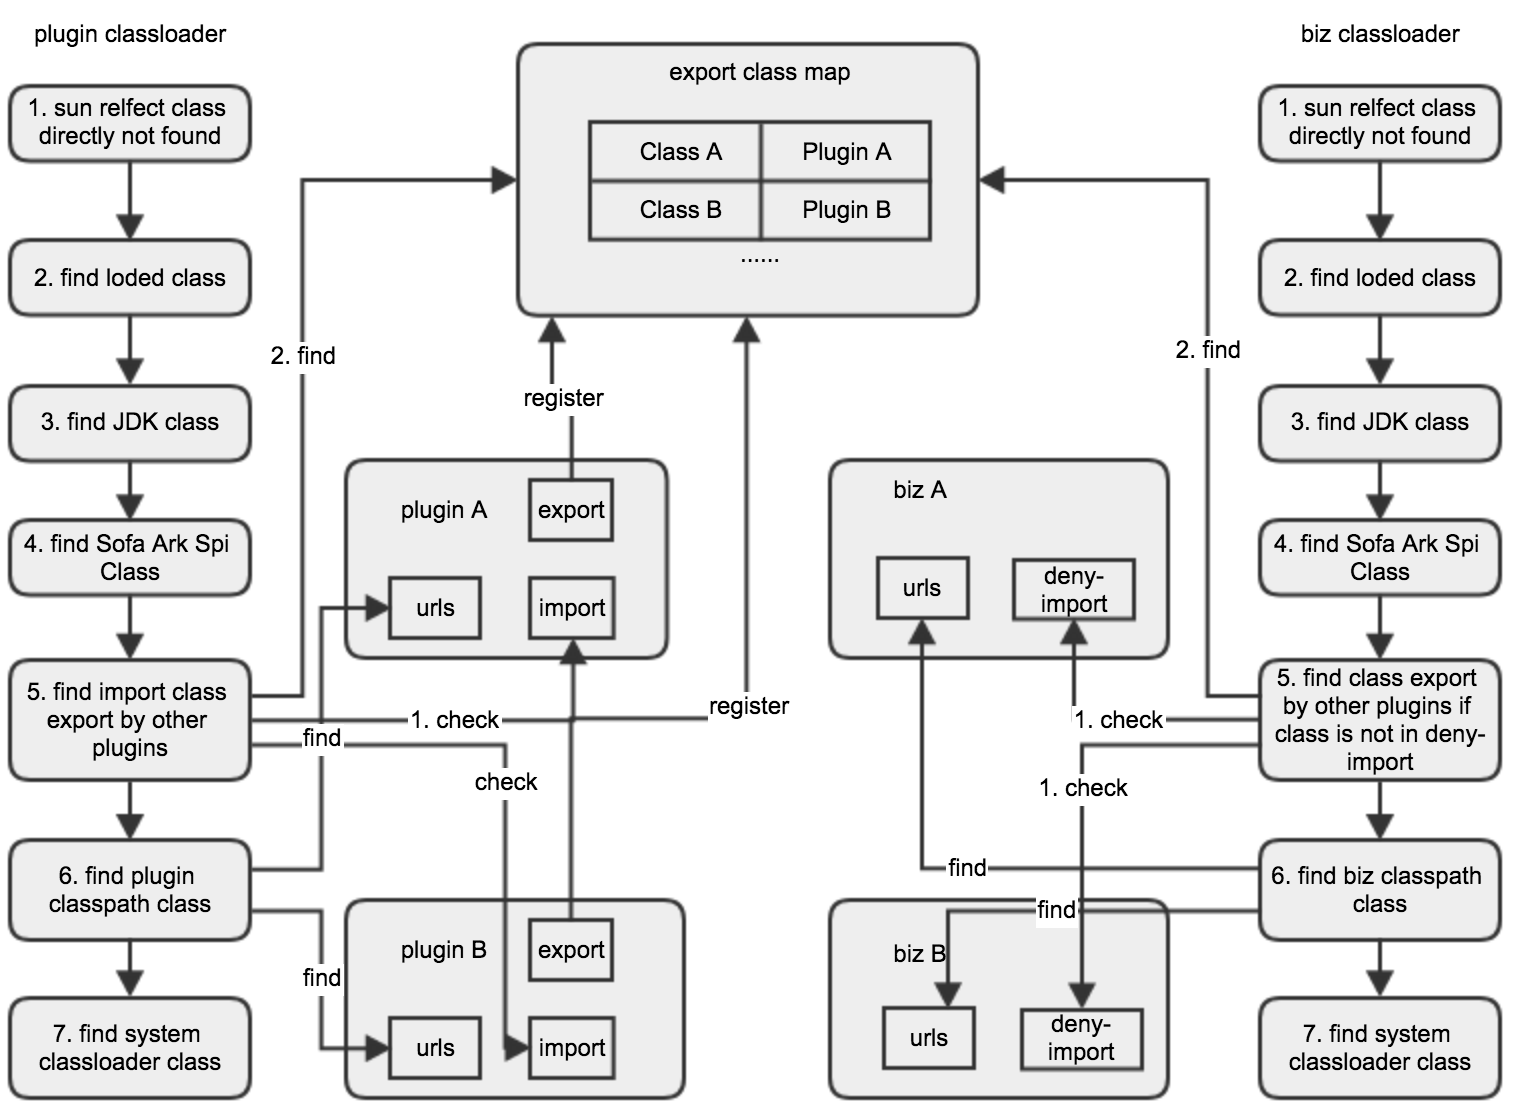
当前设计PluginClassLoader除了会加载SofaArk相关的类,还会加载plugin管控的依赖的类,但不会加载也无法加载业务代码的类和非plugin管控的类。而BizClassLoader则加载以下类:
- 业务代码的类
- 业务代码中引用的非plugin管控的依赖的类
- 业务代码中通过配置排除plugin管控的类
日志打印流程
通过火焰图可见日志打印消耗了绝大多数CPU资源,因此同样需要理解日志打印的流程。当业务代码中打印异常栈时,就会触发如下的流程。由于log4j的包是通过plugin管控的依赖,因此log4j的类加载器并不是BizClassLoader而是PluginClassLoader。由于项目配置了日志格式为异常栈需要打印jar包名称和版本号,因此当log4j打印异常栈时会通过log4j的类加载器即PluginClassLoader尝试加载每行异常栈的类,用于获取其所在的jar包名称和版本号。
但由于SofaArk的类加载器的实现,PluginClassLoader只会加载plugin管控的依赖的类,因此如下以内容平台的一次异常栈举例,业务代码的异常栈(包路径为com.wakzz.service.*)和引入的未被plugin管控的依赖永远尝试加载失败。因此异常栈通过PluginClassLoader尝试获取其所在jar时,始终是先查询已加载类失败,再尝试加载类失败。
java.lang.RuntimeException: null
	at com.wakzz.service.ContentManageFacadeImpl.queryByIds(ContentManageFacadeImpl.java:105) ~[?:?]
	at org.springframework.cglib.proxy.MethodProxy.invoke(MethodProxy.java:218) ~[spring-core-5.1.14.RELEASE.jar!/:5.1.14.RELEASE]
	at org.springframework.aop.framework.CglibAopProxy$CglibMethodInvocation.invokeJoinpoint(CglibAopProxy.java:750) ~[spring-aop-5.1.14.RELEASE.jar!/:5.1.14.RELEASE]
	at org.springframework.aop.framework.ReflectiveMethodInvocation.proceed(ReflectiveMethodInvocation.java:163) ~[spring-aop-5.1.14.RELEASE.jar!/:5.1.14.RELEASE]
	at com.alicp.jetcache.anno.aop.JetCacheInterceptor.invoke(JetCacheInterceptor.java:42) ~[?:?]
	at org.springframework.aop.framework.ReflectiveMethodInvocation.proceed(ReflectiveMethodInvocation.java:186) ~[spring-aop-5.1.14.RELEASE.jar!/:5.1.14.RELEASE]
	at com.alicp.jetcache.anno.aop.JetCacheInterceptor.invoke(JetCacheInterceptor.java:42) ~[?:?]
	at org.springframework.aop.framework.ReflectiveMethodInvocation.proceed(ReflectiveMethodInvocation.java:186) ~[spring-aop-5.1.14.RELEASE.jar!/:5.1.14.RELEASE]
	at org.springframework.aop.aspectj.MethodInvocationProceedingJoinPoint.proceed(MethodInvocationProceedingJoinPoint.java:88) ~[spring-aop-5.1.14.RELEASE.jar!/:5.1.14.RELEASE]
	at sun.reflect.GeneratedMethodAccessor180.invoke(Unknown Source) ~[?:?]
	at sun.reflect.DelegatingMethodAccessorImpl.invoke(DelegatingMethodAccessorImpl.java:43) ~[?:1.8.0_232]
	at java.lang.reflect.Method.invoke(Method.java:498) ~[?:1.8.0_232]
	at org.springframework.aop.aspectj.AbstractAspectJAdvice.invokeAdviceMethodWithGivenArgs(AbstractAspectJAdvice.java:644) ~[spring-aop-5.1.14.RELEASE.jar!/:5.1.14.RELEASE]
	at org.springframework.aop.aspectj.AbstractAspectJAdvice.invokeAdviceMethod(AbstractAspectJAdvice.java:633) ~[spring-aop-5.1.14.RELEASE.jar!/:5.1.14.RELEASE]
	at org.springframework.aop.aspectj.AspectJAroundAdvice.invoke(AspectJAroundAdvice.java:70) ~[spring-aop-5.1.14.RELEASE.jar!/:5.1.14.RELEASE]
	at org.springframework.aop.framework.ReflectiveMethodInvocation.proceed(ReflectiveMethodInvocation.java:186) ~[spring-aop-5.1.14.RELEASE.jar!/:5.1.14.RELEASE]
	at org.springframework.aop.interceptor.ExposeInvocationInterceptor.invoke(ExposeInvocationInterceptor.java:93) ~[spring-aop-5.1.14.RELEASE.jar!/:5.1.14.RELEASE]
	at org.springframework.aop.framework.ReflectiveMethodInvocation.proceed(ReflectiveMethodInvocation.java:186) ~[spring-aop-5.1.14.RELEASE.jar!/:5.1.14.RELEASE]
	at org.springframework.aop.framework.CglibAopProxy$DynamicAdvisedInterceptor.intercept(CglibAopProxy.java:689) ~[spring-aop-5.1.14.RELEASE.jar!/:5.1.14.RELEASE]
	at sun.reflect.GeneratedMethodAccessor179.invoke(Unknown Source) ~[?:?]
	at sun.reflect.DelegatingMethodAccessorImpl.invoke(DelegatingMethodAccessorImpl.java:43) ~[?:1.8.0_232]
	at java.lang.reflect.Method.invoke(Method.java:498) ~[?:1.8.0_232]
	at java.util.concurrent.ThreadPoolExecutor.runWorker(ThreadPoolExecutor.java:1149) [?:1.8.0_232]
	at java.util.concurrent.ThreadPoolExecutor$Worker.run(ThreadPoolExecutor.java:624) [?:1.8.0_232]
	at java.lang.Thread.run(Thread.java:858) [?:1.8.0_232]
更糟糕的是log4j会对加载失败的类尝试3次,核心代码见org.apache.logging.log4j.core.impl.ThrowableProxy#loadClass(java.lang.ClassLoader, java.lang.String),直接导致上述的类加载失败问题直接放大了3倍。
假设一次异常栈中有10个类不在PluginClassLoader管控范围内,那么一次log4j的异常栈打印就会触发30次类加载。在加上我们项目中日志文件非常多,一个异常栈打印通常会在多个日志中打印,如一个异常栈会在3个日志文件中打印,那么类加载失败问题再放大3倍,即一次log4j的异常栈打印就会触发90次类加载。那么只需要以10TPS的频率触发调用接口的异常,那么就导致了每秒近1000次的类加载。
// log4j会对加载失败的类尝试3次
private Class<?> loadClass(final ClassLoader lastLoader, final String className) {
    Class<?> clazz;
    // lastLoader为异常堆栈中上一个成功加载的Class类的类加载器
    // 始终为SofaArk的PluginClassLoader
    if (lastLoader != null) {
        try {
            clazz = lastLoader.loadClass(className);
            if (clazz != null) {
                return clazz;
            }
        } catch (final Throwable ignore) {
            // Ignore exception.
        }
    }
    try {
        // 实际使用Class.forName(className)
        // 通过LoaderUtil的classloader加载类,始终为SofaArk的PluginClassLoader
        clazz = LoaderUtil.loadClass(className);
    } catch (final ClassNotFoundException | NoClassDefFoundError e) {
        return loadClass(className);
    } catch (final SecurityException e) {
        return null;
    }
    return clazz;
}

private Class<?> loadClass(final String className) {
    try {
        // 使用ThrowableProxy的classloader加载类,始终为SofaArk的PluginClassLoader
        return Loader.loadClass(className, this.getClass().getClassLoader());
    } catch (final ClassNotFoundException | NoClassDefFoundError | SecurityException e) {
        return null;
    }
}
类加载耗时
分析完日志打印问题,接下来分析类加载问题,为何类加载会消耗这么多资源。截取类加载对CPU消耗采样的火焰图,可见大多数资源消耗在类加载器对类的查找上。另外火焰图中String.relpace方法会消耗近四分之一的CPU挺意外的,因此专门对这处逻辑的代码实现关注了一下,关键代码如下:
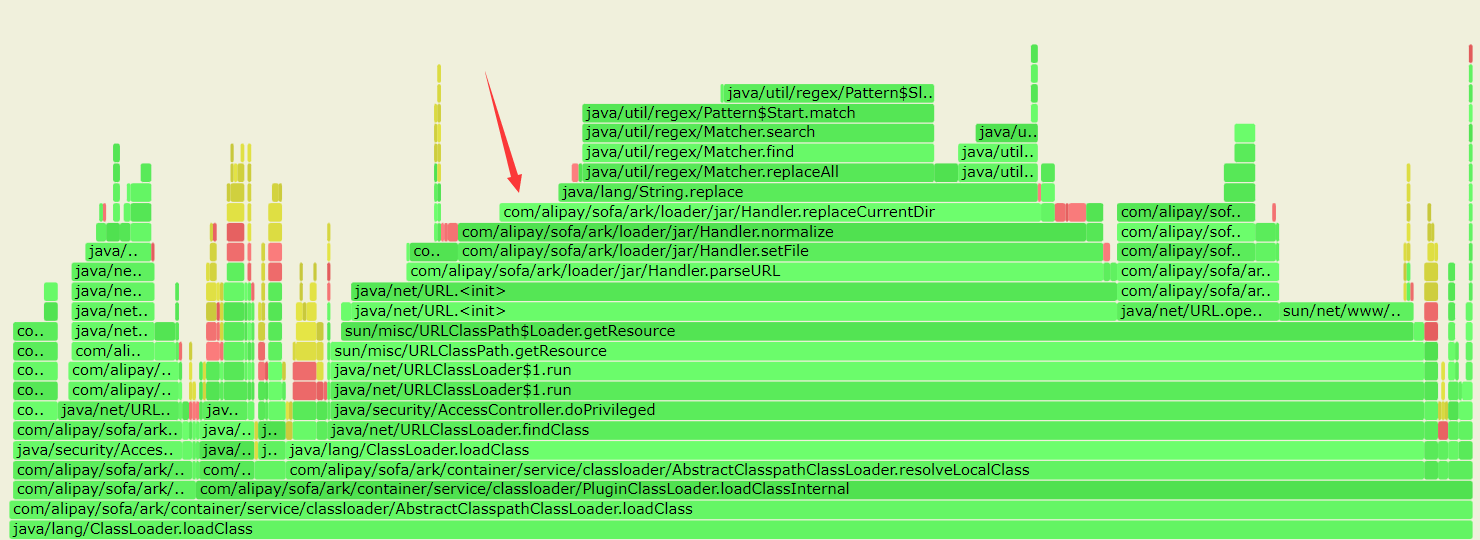
PluginClassLoader类加载器在查询类之前,会先通过全类名组装文件路径,其中replaceCurrentDir的逻辑则是将/./字符替换成/,仅此简单的逻辑,由于使用的是String.relpace,其底层使用的是正则,因此当调用频率高的场景下,会消耗相当可观的CPU资源。因此这里实际上建议通过类似于replaceParentDir方法的字段截取来实现,能有效降低CPU的资源消耗问题。
private String normalize(String file) {
    int afterLastSeparatorIndex = file.lastIndexOf(SEPARATOR) + SEPARATOR.length();
    String afterSeparator = file.substring(afterLastSeparatorIndex);
    afterSeparator = replaceParentDir(afterSeparator);
    afterSeparator = replaceCurrentDir(afterSeparator);
    return new StringBuilder(afterLastSeparatorIndex + afterSeparator.length())
        .append(file.substring(0, afterLastSeparatorIndex)).append(afterSeparator).toString();
}

private String replaceParentDir(String file) {
    int parentDirIndex;
    while ((parentDirIndex = file.indexOf("/../")) >= 0) {
        int precedingSlashIndex = file.lastIndexOf('/', parentDirIndex - 1);
        if (precedingSlashIndex >= 0) {
            file = file.substring(0, precedingSlashIndex) + file.substring(parentDirIndex + 3);
        } else {
            file = file.substring(parentDirIndex + 4);
        }
    }
    return file;
}

private String replaceCurrentDir(String file) {
    return file.replace("/./", "/");
}
主线程耗时
另一个问题,为何启用了日志异步打印,但业务线程依然被日志打印阻塞,从而影响到接口响应耗时?关键代码涉及到log4j异步日志打印时的降级逻辑。简单描述为异步打印日志时有个日志事件队列(默认长度2^18),业务代码的日志事件全部扔到该队列中,由异步线程消费并打印日志。但当日志事件的生产速度大于消费速度,导致该队列的日志时间堆积满后,就会触发降级逻辑,由原先的异步执行降级为通过业务线程同步打印日志。
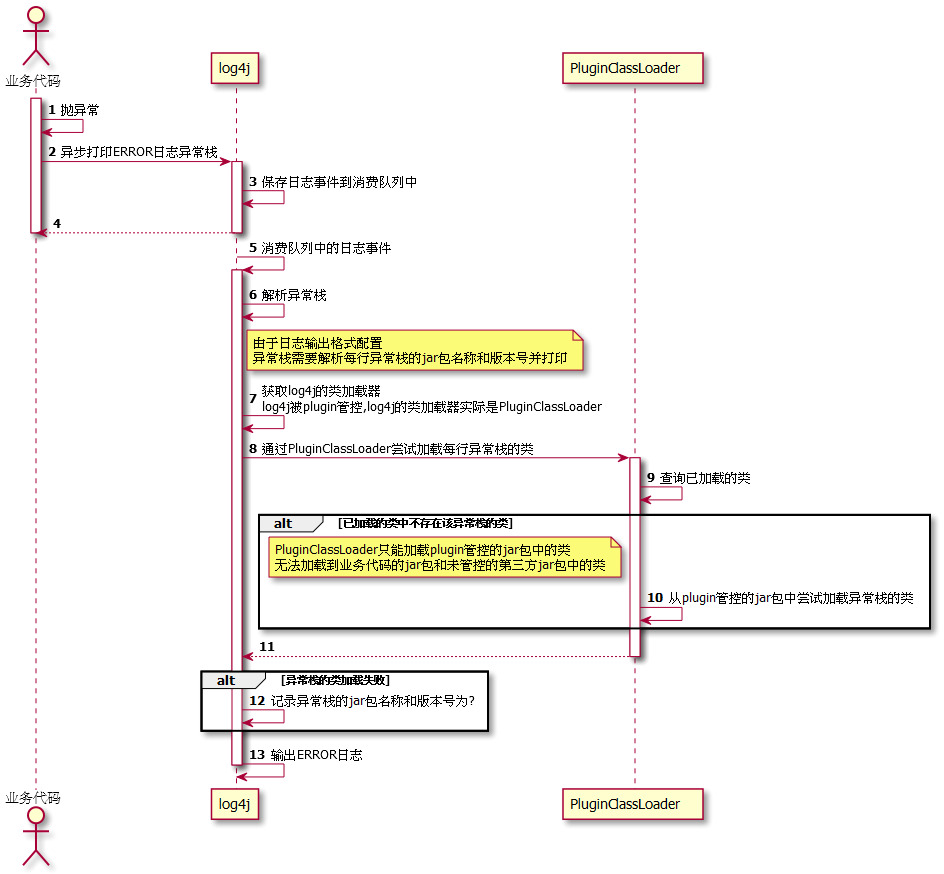
实现逻辑见com.lmax.disruptor.RingBuffer和org.apache.logging.log4j.core.async.AsyncLoggerConfig#callAppenders,与上述类加载问题合并后的具体流程如下图:
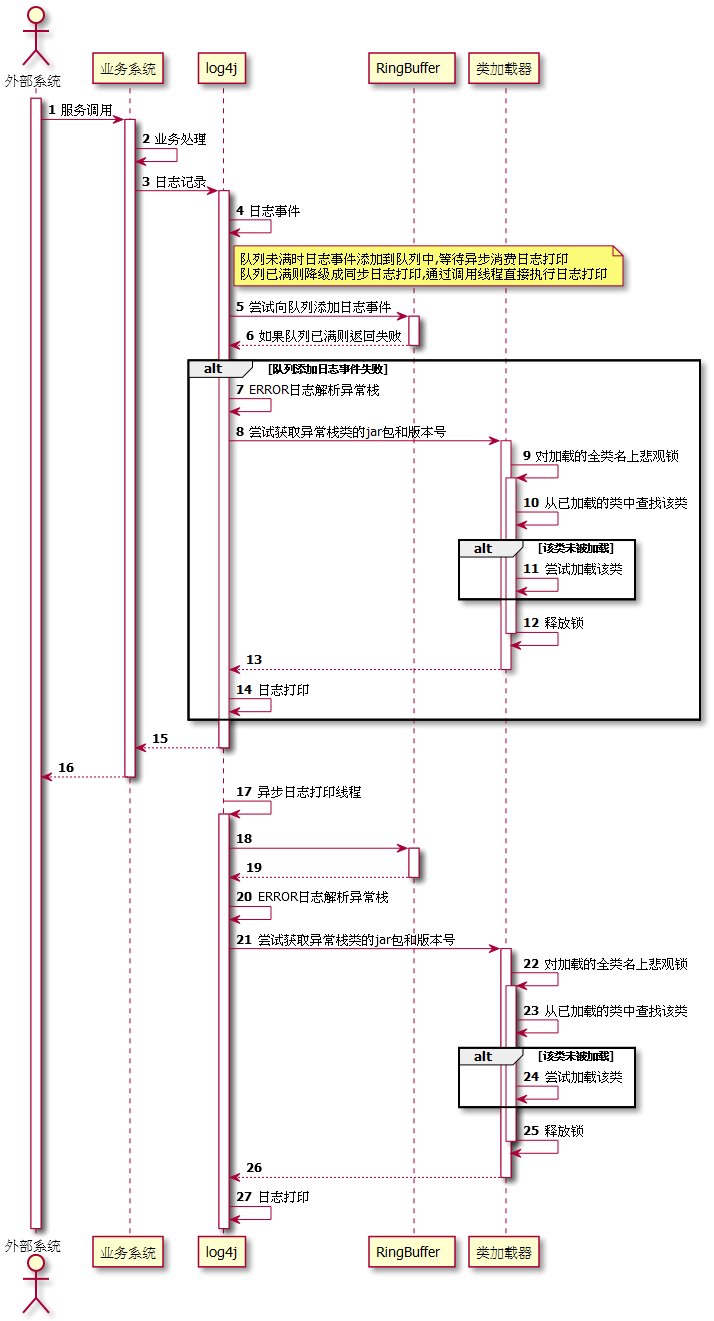
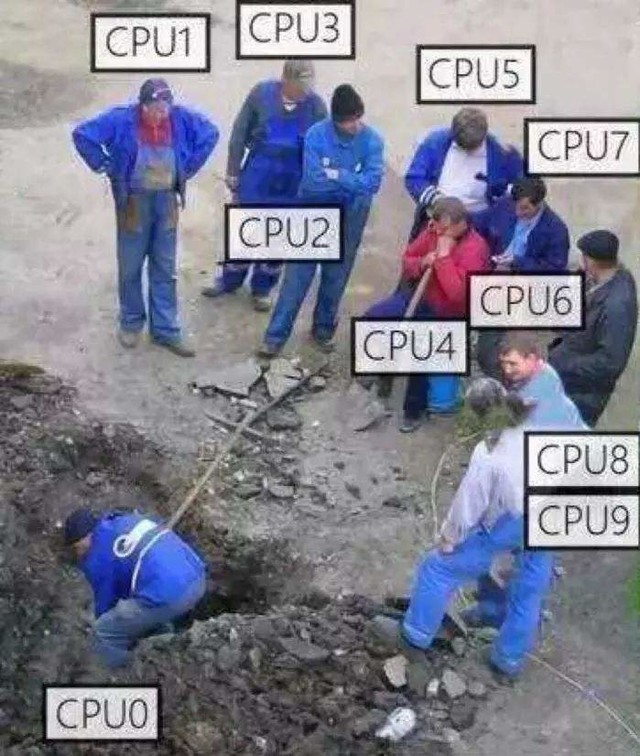
通过流程图可见,由于ERROR日志异常栈触发的类加载需要对全类名上悲观锁,且类加载过程对CPU资源消耗较多,因此实际场景下虽然log4j有4个异步日志消费线程,但每个类同时只有1个线程在执行加载逻辑,出现传说中的一核有难八核围观的现象。这个悲观锁导致日志消费瓶颈,进一步加剧了日志事件的堆积问题。
当异步队列堆积满后,触发日志打印降级,所有日志变成同步打印后,业务线程同步打印日志会在加载类时等待锁,从而增加了接口耗时,当锁等待超时则直接导致业务接口执行超时。
综上是因为大量的业务异常打印了非常多的异常栈日志,在加上项目中配置的异常日志格式为异常栈需要打印jar包名和版本号,导致异常堆栈日志打印时频繁执行无效的类加载过程,而通过CPU火焰图发现PluginClassLoader的resolveLocalClass方法对CPU资源消耗严重。
分析出问题引起的导火索是日志打印异常堆栈时输出jar包名称和版本号,因此盲猜涉及到了日志的输出格式。应用中使用的还是log4j作为日志输出工具,因此翻找log4j的日志格式文档。文档中详细记录了异常堆栈的三种输出格式:
ex|exception|throwable: 输出完整的异常堆栈,输出格式和Throwable.printStackTrace()相同rEx|rException|rThrowable: 异常堆栈从第一个引发的异常开始打印(实测也打印类所在目录的jar包名称)xEx|xException|xThrowable: 除了输出ex|exception|throwable的信息外,还输出类所在的包信息,例如类所在目录的jar包名称
然后查看应用的日志输出配置,发现部分日志的输出格式没有表明异常堆栈的输出格式,如下:
<PatternLayout pattern="%d %-5p %c{2} - %m%n" charset="UTF-8"/>
通过log4j源码org.apache.logging.log4j.core.pattern.PatternParser#parse(java.lang.String, boolean, boolean, boolean)可得,异常堆栈的默认输出格式为xEx|xException|xThrowable。即未配置异常输出格式时,默认会通过类加载获取异常堆栈中每个类的包名和版本号。
for (final PatternConverter converter : converters) {
    if (converter instanceof NanoTimePatternConverter) {
        // LOG4J2-1074 Switch to actual clock if nanosecond timestamps are required in config.
        // LOG4J2-1248 set config nanoclock
        if (config != null) {
            config.setNanoClock(new SystemNanoClock());
        }
    }
    LogEventPatternConverter pc;
    if (converter instanceof LogEventPatternConverter) {
        pc = (LogEventPatternConverter) converter;
        handlesThrowable |= pc.handlesThrowable();
    } else {
        pc = new LiteralPatternConverter(config, Strings.EMPTY, true);
    }

FormattingInfo field;
    if (fieldIter.hasNext()) {
        field = fieldIter.next();
    } else {
        field = FormattingInfo.getDefault();
    }
    list.add(new PatternFormatter(pc, field));
}
// 当未配置异常输出格式时,默认使用ExtendedThrowablePatternConverter(xEx|xException|xThrowable格式)
if (alwaysWriteExceptions && !handlesThrowable) {
    final LogEventPatternConverter pc = ExtendedThrowablePatternConverter.newInstance(config, null);
    list.add(new PatternFormatter(pc, FormattingInfo.getDefault()));
}
因此解决方案就很简单了,修改log4j的日志配置,强制指定每个日志文件的异常堆栈格式为ex|exception|throwable,修改如下:
<!-- 修改前 -->
<PatternLayout pattern="%d %-5p %c{2} - %m%n" charset="UTF-8"/>

<!-- 修改后 -->
<PatternLayout pattern="%d %-5p %c{2} - %m%n%throwable" charset="UTF-8"/>
修改后,再对应用以50TPS的频率进行压测,CPU资源满载的问题已经解决,其CPU火焰图输出如下:
Recommend
-
32
文 | 百川 on 资产管理 一、引言 Logback 是一个优秀的开源日志框架,我们很多项目都使用它来记录日志。实际使用时,通常仅需要一行语句即可记录相应的日志信息,如
-
19
日志中打印源码文件名和行号,是非常实用的功能,尤其是开发阶段的debug日志,可以快速通过日志找到对应的源码位置。 Go标准库中的 package log 也支持打印源码文件名和行号,打开方式是设置以下两个标志中的任意一...
-
5
天啦撸!打印日志竟然只晓得 Log4j? 2020/11/09 空了的时候,我都会在群里偷...
-
3
ARK基金创始人:马斯克和「ESG运动」是导致比特币下跌原因 • 2021-05-28 ARK基...
-
6
开发环境对一台测试节点进行压测时,由于参数配置错误导致请求没有业务处理直接报错。随即停止压测后登录测试机器排查日志,以外发现虽然已经没有请求到该节点,但应用依然在打印错误日志,并且看日志时间是在打印几分钟前请求的日志。 第一反应是异步打...
-
6
V2EX › Java 各位是怎么打印封装第三方 api 的出入参日志的呢 zhongpingjing · 1 天前 ·...
-
6
一看这个标题我想大家一定进来想“怼”我,你这不是小题大作吗?在 java 中打印日志不是一件非常简单的事情吗?在 java 中常用的日志级别为 DEBUG、INFO、WARN、ERROR 四个日志级别。通常开发环境开启 DEBUG,生产环境开启 INFO 级别,采用主流的日志采集工...
-
13
go的zap日志想打印traceid,应该怎么配置 - OSCHINA - 中文开源技术交流社区 开源问答...
-
3
科技股下跌导致投资者损失惨重 红杉资本也未能幸免 新浪科技讯 北京时间7月11日晚间消息,据报道,红杉资本以...
-
2
DirectStorage或导致显卡性能损失,能让RTX 4090性能下跌10%
About Joyk
Aggregate valuable and interesting links.
Joyk means Joy of geeK