

Prometheus基于bosun框架进行告警
source link: https://xigang.github.io/2019/05/11/bosun/
Go to the source link to view the article. You can view the picture content, updated content and better typesetting reading experience. If the link is broken, please click the button below to view the snapshot at that time.

使用Prometheus对容器服务监控数据的采集及存储,并采用alertmanager进行告警通知,但是随着业务的不断增长,业务对告警的需求十分强烈,基于Prometheus已规则文件的方式下发告警规则,并基于Alertmanager实现告警通知的方式,不算特别灵活。所以想通过其它的告警框架实现对容器的告警。
告警框架介绍
Alertmanager
Alertmanager与Prometheus是相互分离的两个组件。Prometheus根据下发的报警规则将警报发送给Alertmanager,然后Alertmanager将silencing、inhibition、aggregation等消息通过email、PaperDuty和HipChat发送通知给用户。
主要功能:
- 删除重复的告警数据
- 分组并将告警通过路由发送到正确的接收器(如email、PaperDuty和HipChat)
- 静默(silence)和告警抑制(inhibition)
- 支持高可用(HA)
Kapacitor
kapacitor是一个开源的数据处理框架,主要用于创建告警,运行ETL任务.
主要功能:
- 处理streaming和batch两种类型的数据
- 实时的从influxDB查询数据,并支持influxdbDB的所有方法
- 存储kapacitor处理之后的数据到InfluxDB
- 用户自定义函数
- 整合了多种channel,如: HipChat, OpsGenie, Alerta, Sensu, PagerDuty, Slack等
Bosun
bosun是一个新型的监控和告警系统,由Stack Exchange团队打造,使用golang编写,支持定义复杂的告警规则,支持OpenTSDB, Graphite, InfluxDB, Prometheus,ES等数据源。
主要功能:
- 使用Bosun灵活的表达式语言对实时数据进行准确的计算
- Bosun能够运行在任何支持Golang的平台(如: Windows, Mac, Linux等)
- 支持多维度的数据聚合,并且可以加入新的标签
- 使用Bosun模板语言来创建告警通知(如:graphs, tables, and contextual information)
- 支持查询 OpenTSDB, Graphite, Logstash-Elasticsearch,InfluxDB, Prometheus.
- 使用scollector收集Windows, Linux和一些应用的监控数据
告警框架对比
kapacitor bosun alertmanager
rule下发方式 HTTP API HTTP API FILE(TEXT)
表达式学习成本 HIGH LOW HIGH
silence(静默) NO YES YES
数据源(prometheus) YES YES YES
高可用(HA) 开源版(NO),企业级(YES) NO YES
分别对这三种不同类型的告警框架进行了对比,我们的需求是想要一个可以通过HTTP API的方式进行业务告警规则的下发,并且针对于业务自定义的告警,表达式的学习成本比较低的场景,最终选择了Bosun作为容器监控服务的告警框架。虽然Bosun当前不支持高可用(HA),可以通过双活的方式达到HA的目的。
整体告警结构如下图所示:
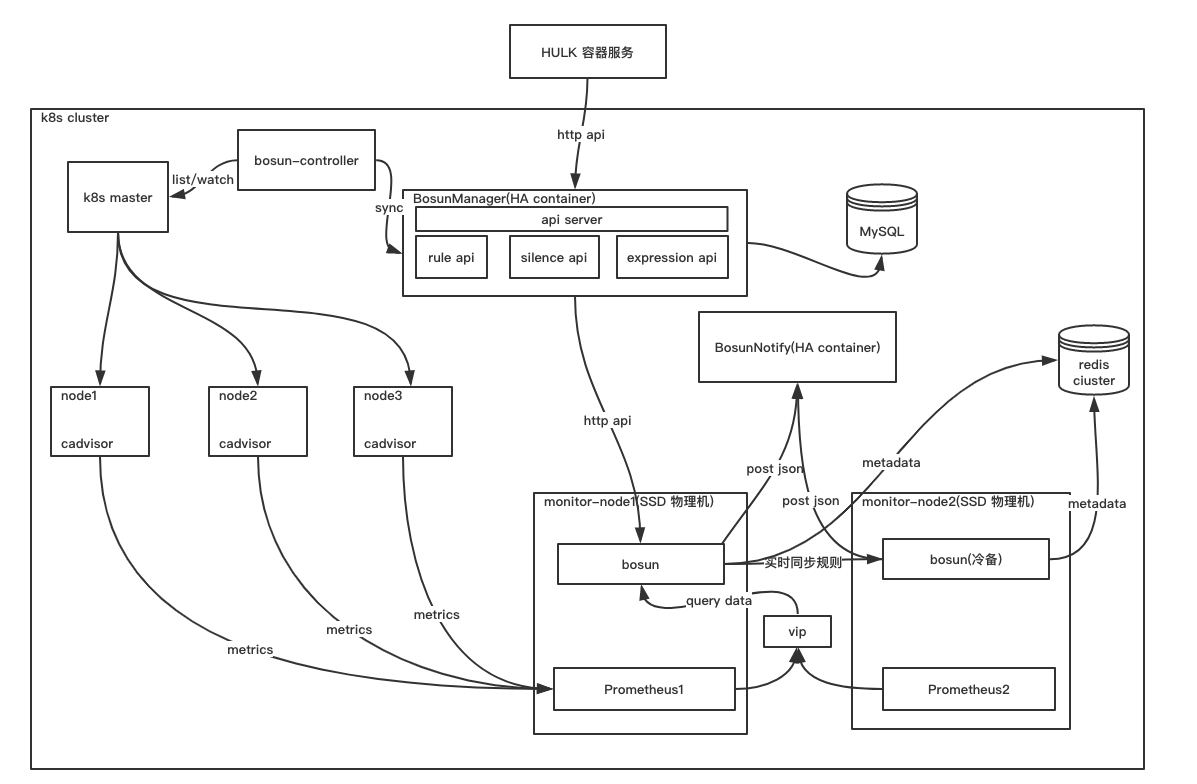
Bosun对接Prometheus进行告警
关于Boson的安装及使用,请查看官方文档:https://bosun.org/quickstart
Bosun安装完成之后,需要配置Bosun的配置文件(bosun.toml)来从Prometheus数据源去查询数据,并将告警的metadata数据保存到Redis中(如果没有设置redis则会默认将medadata数据保存到Ledis)。
bosun.toml文件内存如下:
RuleFilePath = "/data/bosun-rule/share/rule/rule.conf"
EnableSave  = true
HTTPListen = ":8080"
CheckFrequency = "2m"
TimeAndDate = [ 202, 75, 179, 136 ]
ShortURLKey = "aKey"

[DBConf]
	RedisHost = "xx.xx.xx.xx:6379"
	LedisDir = "ledis_data"
	LedisBindAddr = "127.0.0.1:9565"

[PromConf]
    [PromConf.default]
        URL = "http://xx.xx.xx.xx:9090"

[AuthConf]
	CookieSecret = "xxxxxx+A=="
   TokenSecret =  "xxxxxx="
	AuthDisabled=true
更多关于Bosun配置文件的设置,请查看https://bosun.org/system_configuration
配置完成之后,启动bosun即可。现在Bosun已经可以从Prometheus去的查询数据了。Bosun有了数据之后,接下来就是进行告警。Bosun和其它的告警框架机制一样,基于相应的表达式去查询相关的数据进行表达式计算,如果符合最终的期望值,就触发告警。
Bosun主要包含: 表达式(expression),模板(template), 规则(rule),通知(notification), 静默(silence)这几部分组成。各部分的详细介绍,可以查阅官方文档。
Bosun是如何进行表达式计算的?
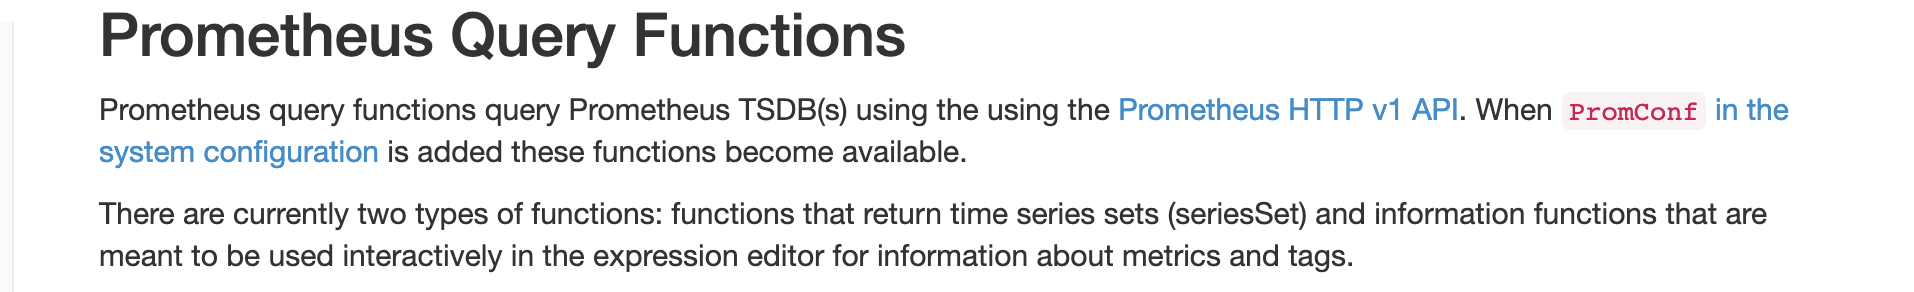
如上图描述:Bosun会以相应的PromeQL表达式去调用Promtheus对外暴露的HTTP API接口,并将返回的数据进行在处理,已达到告警的目的。
比如,想查一个服务实例是否存活,如下图所示:
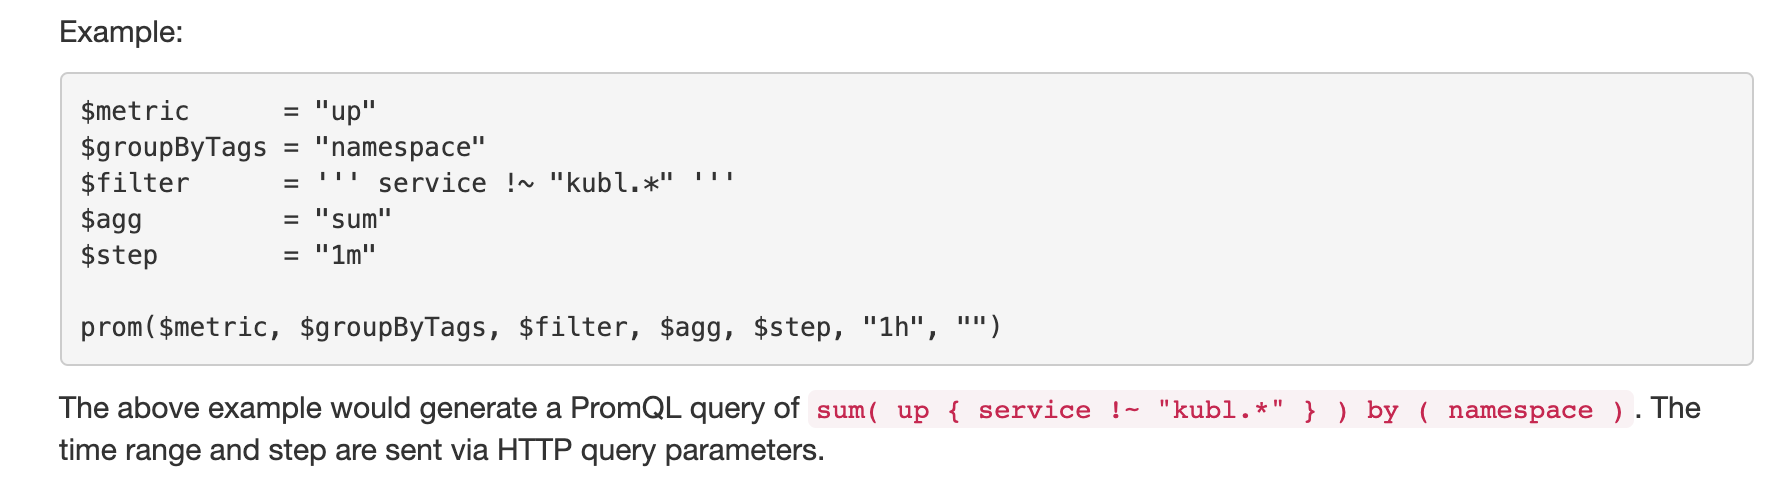
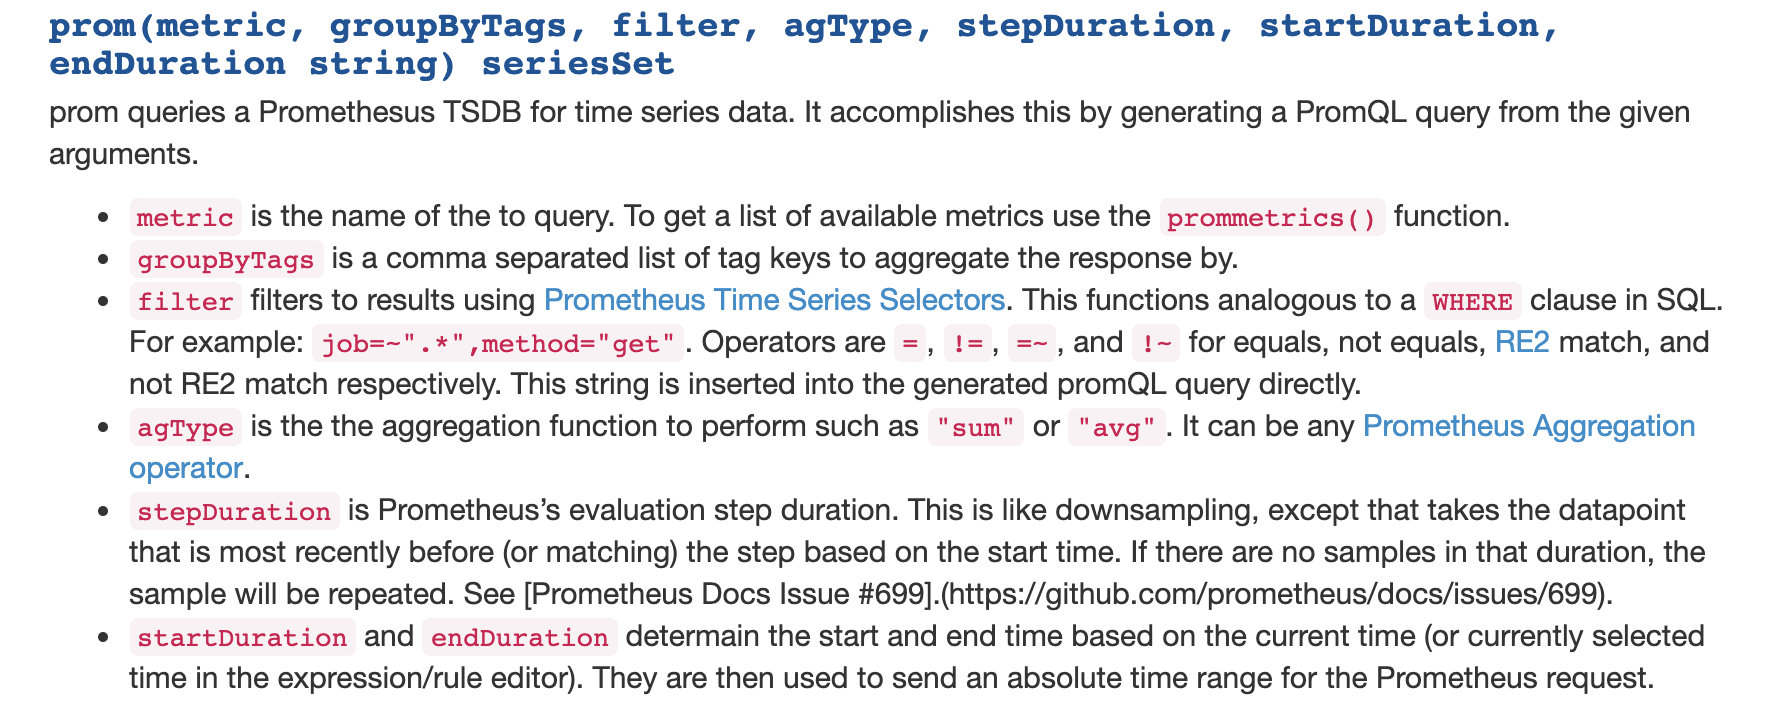
关于prom function各个参数解释:
Bosun基于表达式就可以设置告警规则:
alert container_mem_usage_high {
    $metrics      = "container_memory_usage_bytes"
    $groupByTags = "region,pod_name,contianer_name"
    $agg         = "sum"
    $step        = "15s"
    $filter    = ''' namespace="default", ,pod_name="nginx-deployment-test-6c54bd5869-p7s85",container_name!="POD", container_name=~"nginx" '''

$result1 = prom($metrics, $groupByTags, $filter, $agg, $step, "5m", "")

$critTriggerThreshold = 900000000
    crit = $result > $critTriggerThreshold
}
每一个告警规则会以alert关键字开始,后面是告警规则的名称(该例子告警规则名称是:container_mem_usage_high)。作用域里面是告警的表达式,当$result > $critTriggerThreshold 就会触发告警。
告警规则现在已经设置好了,但是告警内容最终是要通知用户的,那怎么通知用户?通知(notification)
当$result > $critTriggerThreshold计算表达式为True时,Bosun会有多种方式给用户发送消息,如Email, Slack, 自定义服务等。自定义模式更灵活,并且通常对接公司自己的消息推送服务,基本都使用这种方式,我们配置下并将告警消息发送给我们的自定义服务。下面定义一个名字为post的notification:
notification post{
    post = http://127.0.0.1:9999
    bodyTemplate = sendChannelBody
    contentType = application/json
}
然后在刚刚的告警规则中,引入post notification,这样当触发告警是就会post Bosun默认的消息给自自定义的服务。
alert container_mem_usage_high {
    $metrics      = "container_memory_usage_bytes"
    $groupByTags = "region,pod_name,contianer_name"
    $agg         = "sum"
    $step        = "15s"
    $filter    = ''' namespace="default", ,pod_name="nginx-deployment-test-6c54bd5869-p7s85",container_name!="POD", container_name=~"nginx" '''

$result1 = prom($metrics, $groupByTags, $filter, $agg, $step, "5m", "")

$critTriggerThreshold = 900000000
    crit = $result > $critTriggerThreshold

critNotification = post
}
Bosun基于告警规则触发告警并发送消息了,但是为了更优雅可以设置发送给post notification的消息内容,这就需要设置告警模板:
template inherit_template {
    subSubject = {}
    sendChannelBody = {
    "alert_name":"{{.Alert.Name}}",
    "start_time":"{{ .Start }}",
    "last_abnormal_time":"{{.LastAbnormalTime}}",
    "last_abnormal_status":"{{.LastAbnormalStatus}}",
    "warn_threshold": "{{.Alert.Vars.warnTriggerThreshold}}",
    "crit_threshold":"{{.Eval .Alert.Vars.critTriggerThreshold}}",
    "trigger_value":"{{.Eval .Alert.Vars.result}}",
    "warn_expression_result":"{{.Eval .Alert.Warn}}","
    "crit_expression_result":"{{.Eval .Alert.Crit}}",
    "current_status":"{{.CurrentStatus}}",
    "alert_metrics":"{{.Alert.Vars.alertMetrics}}"
    }
}
告警模板的定义是以template关键字开始,后面是定义模板的名称(如:inherit_template)。这样将定义的告警模板引入到告警规则里面,就可以当触发告警时,基于该模板进行渲染并发送给自定义的服务。告警规则变成如下形式:
alert container_mem_usage_high {
	template = inherit_template

$metrics      = "container_memory_usage_bytes"
    $groupByTags = "region,pod_name,contianer_name"
    $agg         = "sum"
    $step        = "15s"
    $filter    = ''' namespace="default", ,pod_name="nginx-deployment-test-6c54bd5869-p7s85",container_name!="POD", container_name=~"nginx" '''

$result1 = prom($metrics, $groupByTags, $filter, $agg, $step, "5m", "")

$critTriggerThreshold = 900000000
    crit = $result > $critTriggerThreshold

critNotification = post
}
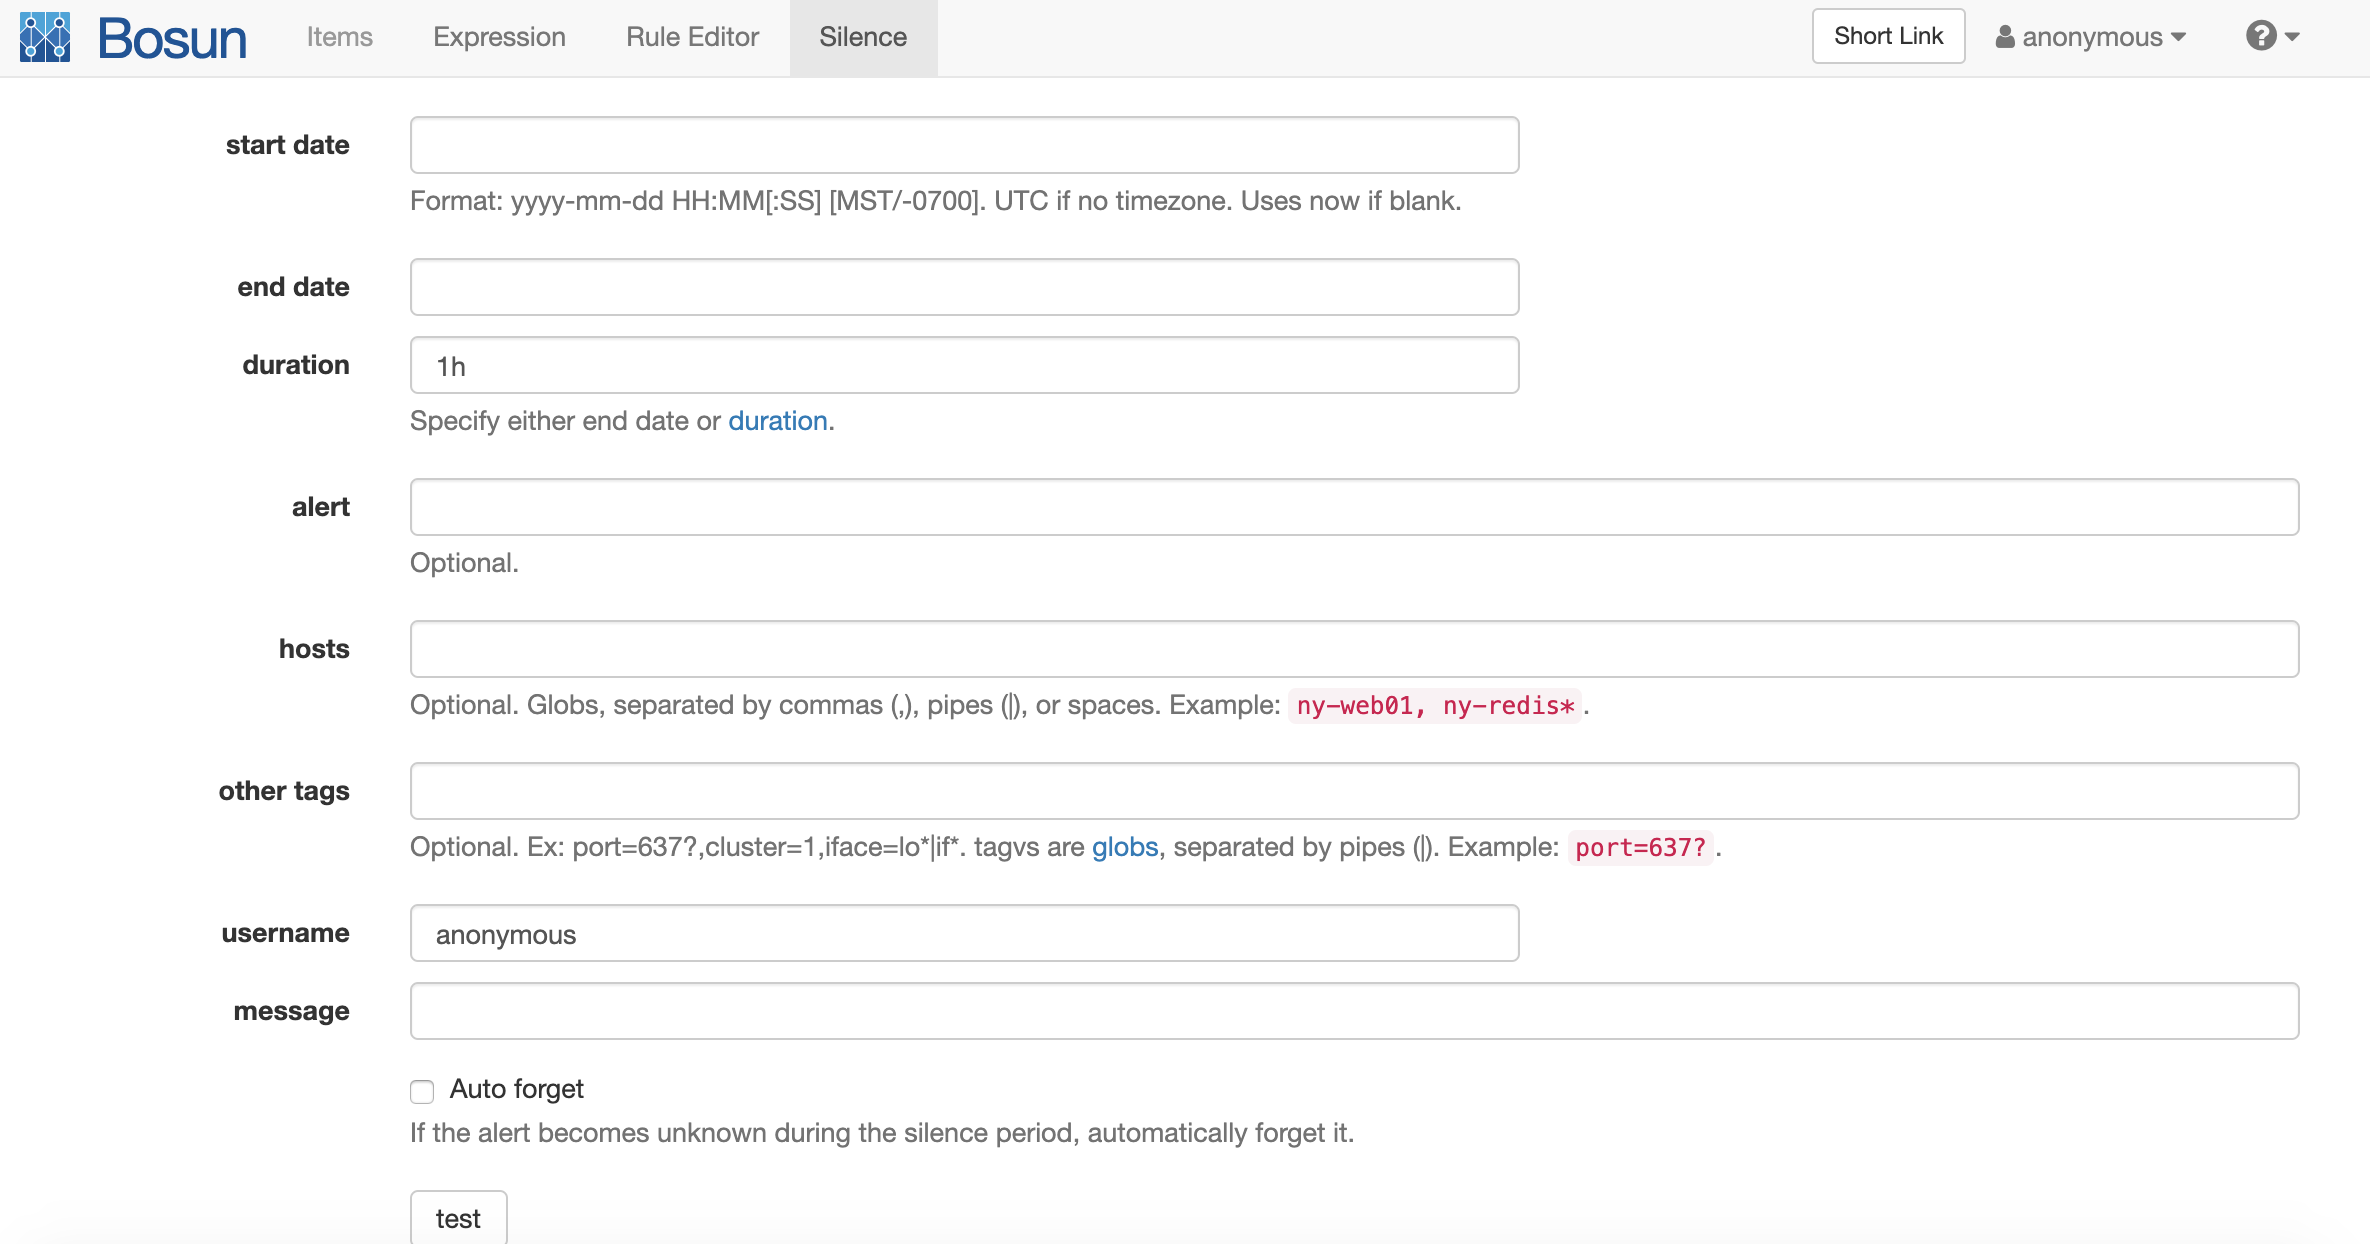
这样就基本满足了告警的需求,并且Bosun还提供了告警静默(silence)的功能,给对不想接收的告警进行静默设置。
这样基于Bosun进行告警基本就满足了当前的告警需求:)
Recommend
-
59
基于Elastalert的安全告警剖析
-
21
为什么要用 alertManager alertmanager 主要用于接收 Prometheus 发送的告警信息,它支持多种告警通知渠道,而且很容易做到告警信息进行去重,降噪,分组等,超级好用。 其实 Grafana 也自带了告警功能,本...
-
10
V2EX › 程序员 prometheus、alertmanager 告警误报问题 Geekerstar · 5 小时 40 分钟...
-
8
基于Prometheus的监控告警系统的Python开发 精选 原创 我的二狗呢 2022-12-18 22:36:53...
-
5
尽管可以通过可视化数据监控系统运行状态,但我们无法时刻关注系统运行,因此需要一些实时运行的工具能够辅助监控系统运行,当系统出现运行问题时,能够通知我们,以此确保系统稳定性,告警便是作为度量指标监控中及其重要的一环。 Promethe...
-
2
【云原生】Prometheus 自定义告警规则 作者:liugp 2023-03-26 08:41:37 从Prometheus server端接收到alerts后,会基于PromQL的告警规则 分析数据,如果满足PromQL定义的规则,则会产生一条告警,并发送告警信息到...
-
15
容器云平台监控告警体系(三)—— 使用Prometheus Operator部署并管理Prometheus Server ...
-
6
解决prometheus告警数据太长的问题 April 12, 2023 prometheus告警的时候经常收到一长串比如 主机磁盘...
-
4
在Prometheus的架构中告警被划分为两个部分,在Prometheus Server中定义告警规则以及产生告警,Alertmanager组件则用于处理这些由Prometheus产生的告警。本文主要讲解Prometheus发送告警机制也就是在Prometheus Server中定义告警规则和产生告警部分,不过多介绍Alert...
-
3
配置邮件示例# Alertmanager configuration alerting: alertmanagers: - static_configs: - targets: - 192.168.19.55:9093 # Load rules once and periodically evaluate them a...
About Joyk
Aggregate valuable and interesting links.
Joyk means Joy of geeK