

How to hydrate data from Stripe and Hubspot
source link: https://dev.to/canonic/how-to-hydrate-data-from-stripe-and-hubspot-1gf2
Go to the source link to view the article. You can view the picture content, updated content and better typesetting reading experience. If the link is broken, please click the button below to view the snapshot at that time.


How to hydrate data from Stripe and Hubspot
We often integrate our systems with external services to support some features. Common example being, using Stripe for handling payments, using Hubspot as your CRM tool, and the list can go on. Naturally all of these services will have data points that you want to see at one place for better data visibility!
Let's see how we can connect with these external datasources and retrieve data from them in conjecture with your own platforms data. We'll be building a simple dashboard to get and show your customers information from your Stripe and Hubspot accounts together with your own database's data. Something like this 👇
So let's begin 🚀
We'll be using:
- React for building the frontend.
- Bootstrap as our UI Library
- Canonic as a Backend
- GraphQL for fetching the data.
📝 Step 1: Create-react-app
First thing first, create a new react project using - create-react-app
npx create-react-app customer-information
Enter fullscreen mode
Exit fullscreen mode
You'll have the basic project setup with the boilerplate code.
📩 Step 2: Add the dependencies
Next, go to your project folder on the terminal and add all the required dependencies.
yarn add react-bootstrap [email protected] @apollo/client [email protected]
Enter fullscreen mode
Exit fullscreen mode
We have the project setup and all the dependencies installed. On the frontend, our design will consist of:
- A simple
Headerat the top. - A
Tablebelow displaying the data we are gonna get from our integrations. - A
Footerat the bottom.
👩🔧 Step 3: Build top-level containers
To build the layout we defined above, We'll use the following components from Bootstrap:
-
Navbarto build the topHeader - Middle
Containerto hold our Table component -
Containerto build theFooter
Go to your App.js file and remove the boilerplate code and add the following:
// Import React and Bootstrap dependencies
import React from "react";
import { Container, Navbar } from "react-bootstrap";
import "bootstrap/dist/css/bootstrap.min.css";

import "./App.css";

function App() {
  return (
    <div className="App">
      {/* Header */}
      <Navbar className="mb-5 navbar-custom" variant="dark" sticky="top">
        <Container>
          <Navbar.Brand href="#home">Customer Information</Navbar.Brand>
        </Container>
      </Navbar>
      {/* Middle Container to hold our Table */}
      <Container>Show Customer Information Here !!</Container>
      {/* Footer */}
      <Container className="mt-3 pb-3 fw-bolder">
        Canonic ©2021 Created by Canonic Inc
      </Container>
    </div>
  );
}

export default App;
Enter fullscreen mode
Exit fullscreen mode
Remove all the pre-added css from your App.css file and add the following code:
/* Changing the color of the Header */
.navbar-custom {
  background-color: #020d57;
}
Enter fullscreen mode
Exit fullscreen mode
After completion of the above 3 steps, when you run using yarn start - the project should have something like this 👇
You can see we have our Header, Middle Content, and the Footer all in place. Let's build our Table Component that will show the data from our backend and add it to our middle container 🏃♂️
📝 Step 4: Setup Data Stream
We'll use some dummy data as a data source at first to feed into our table and then replace it with the actual data coming in from the API. This way we'll be able to build our frontend properly and just have to replace the data coming into it without changing any of our frontend code.
This is how our data is gonna come in from the backend, so we'll mock it! Let's create a javascript file to hold it dummyData.js at src/
export const dummyData = {
  customers: [
    {
      hubspotCustomer: {
        properties: {
          email: "[email protected]",
          company: "Thoughtbridge",
          phone: "123-4567",
        },
      },
      stripeCustomer: {
        address: {
          city: "Samos",
          country: "ES",
          line1: "Ctra. de Siles 98",
          line2: "",
          postal_code: "27620",
          state: "LU",
        },
        balance: 50,
        name: "Lila Gonzalez",
      },
    },
  ],
};
Enter fullscreen mode
Exit fullscreen mode
We'll normalise this data in a way that we can feed into our Table. To display any table you'll need two things: Rows & Columns.
- Our
columnswill represent what type of information will be displayed. For example Name, Email, Address, etc. - Our
rowswill have the actual information for the respective columns For example John Doe, [email protected], etc.
Let's create a utility function that will normalise the above data. Create a new file normaliseTableData.js at src/utils
// Gets all the columns that needs to be displayed along with the source from which they are being populated.
export const getColumns = () => {
  return {
    name: "Stripe",
    email: "Hubspot",
    phone: "Hubspot",
    company: "Hubspot",
    address: "Stripe",
    balance: "Stripe",
  };
};

// Maps in the data coming, normalizes it and returns an array of rows according to the columns.
export const getRows = (customers) => {
  return (customers ?? []).map((customer) => {
    const hubspotData = customer.hubspotCustomer.properties;
    const stripeData = customer.stripeCustomer;
    return {
      name: stripeData.name,
      email: hubspotData.email,
      phone: hubspotData.phone,
      company: hubspotData.company,
      address:
        `${stripeData.address.line1},` +
        ` ${stripeData.address.city},` +
        ` ${stripeData.address.country}`,
      balance: stripeData.balance,
    };
  });
};
Enter fullscreen mode
Exit fullscreen mode
📝 Step 5: Create InformationTable Component
We'll create a component - InformationTable at src/components/InformationTable. Create the respective InformationTable.js and index.js files.
Your folder structure would look like this 👇
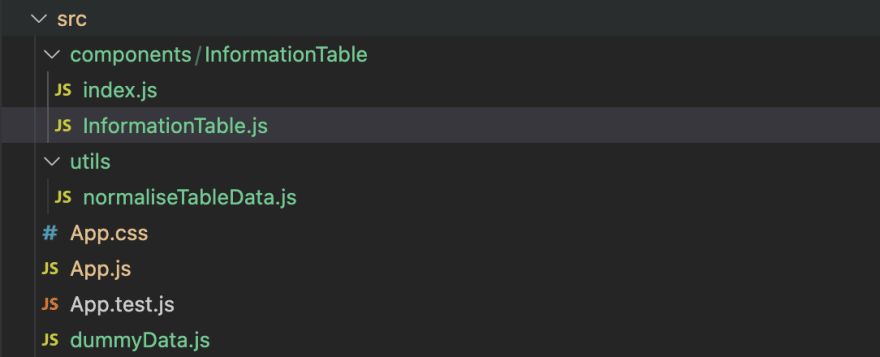
Add following code to your index.js file
export { default } from "./InformationTable";
Enter fullscreen mode
Exit fullscreen mode
Coming to our main InformationTable.js file, to build this component we'll be using the Table component from Bootstrap to quickly display the information we get. We'll using the dummy data source set up to display and check if our UI is working properly before we integrate it with the backend.
-
<thead>element of bootstrapsTablecomponent sets up the columns. We'll loop over the columns we are getting from our normalised data. -
<tbody>element sets up the rows of the table. So we'll loop over our rows here from our normalised data.
// Import React and Bootstrap dependencies
import React from "react";
import { Table } from "react-bootstrap";

// Import our util functions
import { getColumns, getRows } from "../../utils/normaliseTableData";

// Dummy Data Source
import { dummyData } from "../../dummyData";

const InformationTable = () => {
  const data = dummyData;
  const { customers = [] } = data;
  const columns = getColumns();
  const rows = getRows(customers);

    /* Getting class names according to the data source */
  const className = (key) => {
    return key === "Stripe" ? "bg-primary" : "bg-warning text-dark";
  };

  return (
    /* Bootstraps Table Component */
    <Table responsive hover bordered>
      <thead>
        <tr>
          <th class="align-middle">#</th>
          {/* Mapping over the columns and setting them up */}
          {Object.keys(columns).map((keyName) => {
            return (
              <th class="text-center align-middle" key={keyName}>
                <div>{keyName.toUpperCase()}</div>
                                {/* Showing a bagde to see from where the data came from */}
                <span className={`badge ml-5 ${className(columns[keyName])}`}>
                  {columns[keyName]}
                </span>
              </th>
            );
          })}
        </tr>
      </thead>
      <tbody>
        {rows.map((customer, index) => {
          return (
            <tr key={index}>
              <td class="align-middle fw-bolder font-monospace">{index}</td>
              {/* Mapping over the rows and setting them up */}
              {Object.keys(customer).map((keyName, index) => {
                return (
                  <td class="col-2 align-middle text-center " key={index}>
                    {customer[keyName] ?? "N/A"}
                  </td>
                );
              })}
            </tr>
          );
        })}
      </tbody>
    </Table>
  );
};

export default InformationTable;
Enter fullscreen mode
Exit fullscreen mode
Our InformationTable component is ready, let's add it to our layout's middle container to see how it looks. Head back to App.js, import InformationTable & update the <Container> element.
// Import Information Table
import InformationTable from "./components/InformationTable/InformationTable";
Enter fullscreen mode
Exit fullscreen mode
{/* Middle Container to hold our Table */}
<Container>
    <InformationTable></InformationTable>
</Container>
Enter fullscreen mode
Exit fullscreen mode
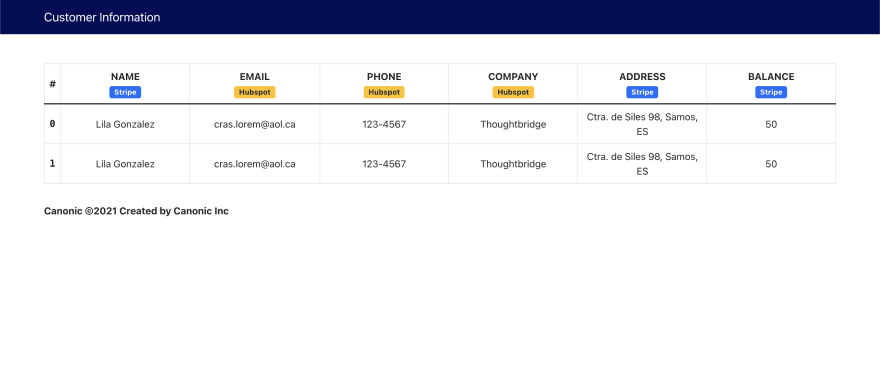
Here's what it should look like after successful completion. 👇
👩🔧 Step 6: Setup Backend
Let's head to Canonic and clone this template to get started. It has same integrations for Stripe & Hubspot added for you. You can either:
- Use this sample project to and continue, or
- Clone it, replace the Stripe & Hubspot credentials with yours and hit Deploy 🚀 . This will then use your data from the services to fetch.
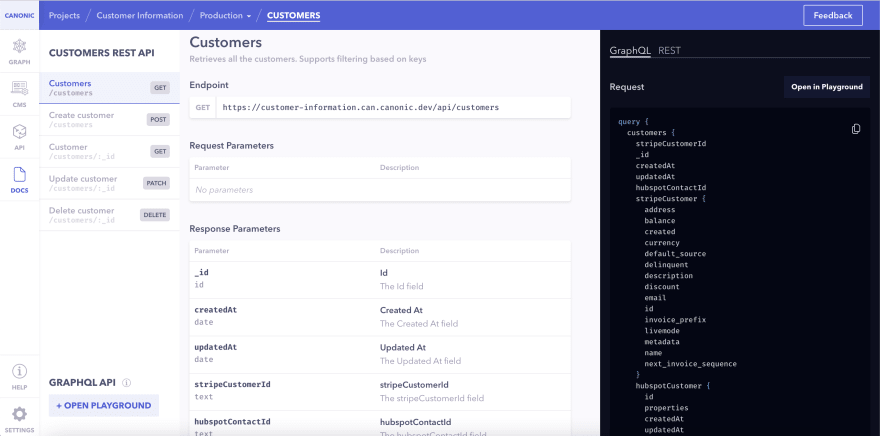
You can see the GraphQL API Endpoint in the Docs Section of your project.
🔽 Step 7: Configure GraphQL
We are using ApolloClient to connect with our backend through GraphQL. Head to App.js and:
- Import the new dependencies
- Configure
ApolloClient - Wrap our top component with
ApolloProvider
// Import Apollo Dependencies
import { ApolloProvider, InMemoryCache, ApolloClient } from "@apollo/client";
Enter fullscreen mode
Exit fullscreen mode
...

import "./App.css";

/**
 * Connecting with the backend using apollo client
 */
const client = new ApolloClient({
  // Make sure you update the URI here to point to your backend
  uri: "https://customer-information.can.canonic.dev/graphql",
  cache: new InMemoryCache({
    addTypename: false,
  }),
});

...
Enter fullscreen mode
Exit fullscreen mode
// Wrap our top component in ApolloProvider
function App() {
  return (
    <ApolloProvider client={client}>
      <div className="App">

        ...

      </div>
    </ApolloProvider>
  );
}
Enter fullscreen mode
Exit fullscreen mode
Note: Replace the
uriwith your GraphQL API Endpoint if you cloned and deployed your own project.
🙌 Step 8: Configure Data Querying
After setting up our Client, let's set up the query (API Call) that we are gonna make to our backend. You can head to the docs section of your project and can copy it directly from there 👇
Let's create a javascript file to hold it queries.js at src/gql and add the following code to setup the query:
import { gql } from "@apollo/client";

/**
 * gql query to get customers information
 * The query parameters we got straight from Canonic autogenerated documentation
 */
export const GET_CUSTOMERS_INFO = gql`
  query {
    customers {
      stripeCustomer {
        address
        balance
        email
        name
        phone
      }
      hubspotCustomer {
        properties
      }
    }
  }
`;
Enter fullscreen mode
Exit fullscreen mode
We stripped out the parameters whose information we don't need to display on our dashboard. GraphQL let's you do that!
🏃♂️ Step 9: Let's Integrate !!
Head to InformationTable.js where we'll execute our above query to fetch data from the backend. To do that:
- Add the required dependencies that are needed to execute the
query - Execute the query and replace the data coming from it with our dummyData
// Import Quering dependencies
import { useQuery } from "@apollo/client";
import { GET_CUSTOMERS_INFO } from "../../gql/queries";
Enter fullscreen mode
Exit fullscreen mode
...

const InformationTable = () => {
//   const data = dummyData;
  const { data = {}, loading } = useQuery(GET_CUSTOMERS_INFO);
  const { customers = [] } = data;

    ...

};
Enter fullscreen mode
Exit fullscreen mode
Here's what it should look like after successful completion. We just replaced our dummyData with our actual data and the frontend worked like a charm 👇
Since the API Call is an asynchronous operation, we show a loading indicator instead of our table at that time. Let's add that and our project will be complete.
- We'll be using the
Spinnercomponent from Bootstrap to show the loading indicator. - We'll show/hide it on the basis of the
loadingvariable that we get from ouruseQuery()function. It has the updated information wether the API call is still in the process or not.
// Update the bootstrap dependencies
import { Table, Spinner } from "react-bootstrap";
Enter fullscreen mode
Exit fullscreen mode
const InformationTable = () => {
  const { data = {}, loading } = useQuery(GET_CUSTOMERS_INFO);

    ...

/* Show loading indicator is the API call is in progress */
  if (loading)
    return (
      <div className="d-flex justify-content-center">
        <Spinner animation="border" />
      </div>
    );

  ...

  );
};
Enter fullscreen mode
Exit fullscreen mode
Here's what it should look like after when loading 👇
And with that, we have successfully made the whole project end to end . 💃🕺
Congratulations! 🎉
Live Link
Sample code on GitHub
Conclusion
Hope this guide helped you gain better insight about creating a dashboard that fetches data from Stripe and Hubspot, how you can structure it, and how to quickly get a basic dashboard up and running. You can also check out our other guides here.
Join us on discord to discuss or share with our community. Write to us for any support requests at [email protected]. Check out our website to know more about Canonic.
Recommend
About Joyk
Aggregate valuable and interesting links.
Joyk means Joy of geeK