

新功能:Prometheus Agent 模式上手体验
source link: https://zhuanlan.zhihu.com/p/438726797
Go to the source link to view the article. You can view the picture content, updated content and better typesetting reading experience. If the link is broken, please click the button below to view the snapshot at that time.

新功能:Prometheus Agent 模式上手体验
大家好,我是张晋涛。
Prometheus 几乎已经成为了云原生时代下监控选型的事实标准,它也是第二个从 CNCF 毕业的项目。
当前,Prometheus 几乎可以满足各种场景/服务的监控需求。我之前有写过一些文章介绍过 Prometheus 及其生态,本篇我们将聚焦于 Prometheus 最新版本中发布的 Agent 模式,对于与此主题无关的一些概念或者用法,我会粗略带过。
拉模式(Pull)和 推模式(Push)
众所周知,Prometheus 是一种拉模式(Pull)的监控系统,这不同于传统的基于推模式(Push)的监控系统。
什么是拉模式(Pull)呢?

待监控的服务自身或者通过一些 exporter 暴露出来一些 metrics 指标的接口,由 Prometheus 去主动的定时进行抓取/采集,这就是拉模式(Pull)。即由监控系统主动的去拉(Pull)目标的 metrics。
与之相对应的就是推模式(Push)了。
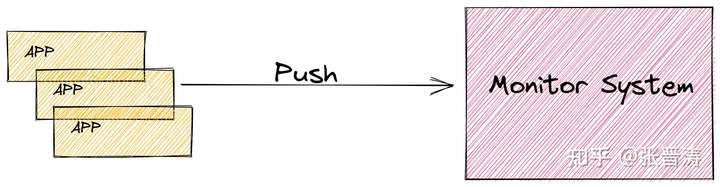
由应用程序主动将自身的一些 metrics 指标进行上报,监控系统再进行相对应的处理。如果对于某些应用程序的监控想要使用推模式(Push),比如:不易实现 metrics 接口等原因,可以考虑使用 Pushgateway 来完成。
对于拉模式(Pull)和推模式(Push)到底哪种更好的讨论一直都在继续,有兴趣的小伙伴可以自行搜索下。
这里主要是聚焦于单个 Prometheus 和应用服务之间交互的手方式。本篇我们从更上层的角度或者全局角度来看看当前 Prometheus 是如何做 HA、 持久化和集群的。
Prometheus HA/持久化/集群的方案
在大规模生产环境中使用时,很少有系统中仅有一个单实例 Prometheus 存在的情况出现。无论从高可用、数据持久化还是从为用户提供更易用的全局视图来考虑,运行多个 Prometheus 实例的情况就很常见了。
目前 Prometheus 主要有三种办法来将多个 Prometheus 实例的数据进行聚合,并给用户提供一个统一的全局视图。
- 联邦(Federation):是最早期的 Prometheus 内置的数据聚合方案。这种方案下,可以使用某个中心 Prometheus 实例从叶子 Prometheus 实例上进行指标的抓取。这种方案下可以保留 metrics 原本的时间戳,整体也比较简单;
- Prometheus Remote Read(远程读):可以支持从远程的存储中读取原始 metrics,注意:这里的远程存储可以有多种选择。当读取完数据后,便可对它们进行聚合,并展现给用户了;
- Prometheus Remote Write(远程写):可以支持将 Prometheus 采集到 metrics 等写到远程存储中。用户在使用的时候,直接从远端存储中读取数据,并提供全局视图等;
Prometheus Agent 模式
Prometheus Agent 是自 Prometheus v2.32.0 开始将会提供的一项功能,它主要是采用上文中提到的 Prometheus Remote Write 的方式,将启用了 Agent 模式的 Prometheus 实例的数据写入到远程存储中。并借助远程存储来提供一个全局视图。
前置依赖
由于它使用了 Prometheus Remote Write 的方式,所以我们需要先准备一个 "远程存储" 用于 metrcis 的中心化存储。这里我们使用 Thanos 来提供此能力。当然,如果你想要使用其他的方案,比如: Cortex、influxDB 等也都是可以的。
准备远程存储
这里我们直接使用 Thanos 最新版本的容器镜像来进行部署。这里我们使用了 host 网络比较方便进行测试。
执行完这些命令后,Thanos receive 将会监听在 http://127.0.0.1:10908/api/v1/receive 用于接收"远程写入"。
➜  cd prometheus
➜  prometheus docker run -d --rm \
    -v $(pwd)/receive-data:/receive/data \
    --net=host \
    --name receive \
    quay.io/thanos/thanos:v0.23.1 \
    receive \
    --tsdb.path "/receive/data" \
    --grpc-address 127.0.0.1:10907 \
    --http-address 127.0.0.1:10909 \
    --label "receive_replica=\"0\"" \
    --label "receive_cluster=\"moelove\"" \
    --remote-write.address 127.0.0.1:10908
59498d43291b705709b3f360d28af81d5a8daba11f5629bb11d6e07532feb8b6
➜  prometheus docker ps -l
CONTAINER ID   IMAGE                           COMMAND                  CREATED          STATUS          PORTS     NAMES
59498d43291b   quay.io/thanos/thanos:v0.23.1   "/bin/thanos receive…"   21 seconds ago   Up 20 seconds             receive
准备查询组件
接下来我们启动一个 Thanos 的 query 组件,跟 receive 组件连接,用于查询写入的数据。
➜  prometheus docker run -d --rm \
--net=host \
--name query \
quay.io/thanos/thanos:v0.23.1 \
query \
--http-address "0.0.0.0:39090" \
--store "127.0.0.1:10907"
10c2b1bf2375837dbda16d09cee43d95787243f6dcbee73f4159a21b12d36019
➜  prometheus docker ps -l
CONTAINER ID   IMAGE                           COMMAND                  CREATED         STATUS         PORTS     NAMES
10c2b1bf2375   quay.io/thanos/thanos:v0.23.1   "/bin/thanos query -…"   4 seconds ago   Up 3 seconds             query
注意:这里我们配置了 --store 字段,指向了前面的 receive 组件。
打开浏览器访问 http://127.0.0.1:39090/stores ,如果一起顺利,你应该可以看到 receive 已经注册到了 store 中。
部署 Prometheus Agent 模式
这里我直接从 Prometheus 的 Release 页面 下载了它最新版本 v2.32.0 的二进制文件。解压后,你会发现目录中的内容和之前版本中是一致的。
这是因为 Prometheus Agent 模式现在是内置在 Prometheus 二进制文件中的,增加 --enable-feature=agent 选项即可启用。
准备配置文件
我们需要为它准备一份配置文件,注意, 需要配置 remote_write ,且不能有 alerting 之类的配置
global:
  scrape_interval: 15s
  external_labels:
    cluster: moelove
    replica: 0

scrape_configs:
  - job_name: "prometheus"
    static_configs:
      - targets: ["localhost:9090"]

remote_write:
- url: 'http://127.0.0.1:10908/api/v1/receive'
配置文件另存为 prometheus.yml
启动
我们将它的日志级别设置成 debug 方便查看它的一些细节
➜  ./prometheus --enable-feature=agent --log.level=debug --config.file="prometheus.yml"
ts=2021-11-27T19:03:15.861Z caller=main.go:195 level=info msg="Experimental agent mode enabled."
ts=2021-11-27T19:03:15.861Z caller=main.go:515 level=info msg="Starting Prometheus" version="(version=2.32.0-beta.0, branch=HEAD, revision=c32725ba7873dbaa39c223410043430ffa5a26c0)"
ts=2021-11-27T19:03:15.861Z caller=main.go:520 level=info build_context="(go=go1.17.3, user=root@da630543d231, date=20211116-11:23:14)"
ts=2021-11-27T19:03:15.861Z caller=main.go:521 level=info host_details="(Linux 5.14.18-200.fc34.x86_64 #1 SMP Fri Nov 12 16:48:10 UTC 2021 x86_64 moelove (none))"
ts=2021-11-27T19:03:15.861Z caller=main.go:522 level=info fd_limits="(soft=1024, hard=524288)"
ts=2021-11-27T19:03:15.861Z caller=main.go:523 level=info vm_limits="(soft=unlimited, hard=unlimited)"
ts=2021-11-27T19:03:15.862Z caller=web.go:546 level=info component=web msg="Start listening for connections" address=0.0.0.0:9090
ts=2021-11-27T19:03:15.862Z caller=main.go:980 level=info msg="Starting WAL storage ..."
ts=2021-11-27T19:03:15.863Z caller=tls_config.go:195 level=info component=web msg="TLS is disabled." http2=false
ts=2021-11-27T19:03:15.864Z caller=db.go:306 level=info msg="replaying WAL, this may take a while" dir=data-agent/wal
ts=2021-11-27T19:03:15.864Z caller=db.go:357 level=info msg="WAL segment loaded" segment=0 maxSegment=0
ts=2021-11-27T19:03:15.864Z caller=main.go:1001 level=info fs_type=9123683e
ts=2021-11-27T19:03:15.864Z caller=main.go:1004 level=info msg="Agent WAL storage started"
ts=2021-11-27T19:03:15.864Z caller=main.go:1005 level=debug msg="Agent WAL storage options" WALSegmentSize=0B WALCompression=true StripeSize=0 TruncateFrequency=0s MinWALTime=0s MaxWALTime=0s
ts=2021-11-27T19:03:15.864Z caller=main.go:1129 level=info msg="Loading configuration file" filename=prometheus.yml
ts=2021-11-27T19:03:15.865Z caller=dedupe.go:112 component=remote level=info remote_name=e6fa2a url=http://127.0.0.1:10908/api/v1/receive msg="Starting WAL watcher" queue=e6fa2a
ts=2021-11-27T19:03:15.865Z caller=dedupe.go:112 component=remote level=info remote_name=e6fa2a url=http://127.0.0.1:10908/api/v1/receive msg="Starting scraped metadata watcher"
ts=2021-11-27T19:03:15.865Z caller=dedupe.go:112 component=remote level=info remote_name=e6fa2a url=http://127.0.0.1:10908/api/v1/receive msg="Replaying WAL" queue=e6fa2a
ts=2021-11-27T19:03:15.865Z caller=dedupe.go:112 component=remote level=debug remote_name=e6fa2a url=http://127.0.0.1:10908/api/v1/receive msg="Tailing WAL" lastCheckpoint= checkpointIndex=0 currentSegment=0 lastSegment=0
ts=2021-11-27T19:03:15.865Z caller=dedupe.go:112 component=remote level=debug remote_name=e6fa2a url=http://127.0.0.1:10908/api/v1/receive msg="Processing segment" currentSegment=0
ts=2021-11-27T19:03:15.877Z caller=manager.go:196 level=debug component="discovery manager scrape" msg="Starting provider" provider=static/0 subs=[prometheus]
ts=2021-11-27T19:03:15.877Z caller=main.go:1166 level=info msg="Completed loading of configuration file" filename=prometheus.yml totalDuration=12.433099ms db_storage=361ns remote_storage=323.413µs web_handler=247ns query_engine=157ns scrape=11.609215ms scrape_sd=248.024µs notify=3.216µs notify_sd=6.338µs rules=914ns
ts=2021-11-27T19:03:15.877Z caller=main.go:897 level=info msg="Server is ready to receive web requests."
ts=2021-11-27T19:03:15.877Z caller=manager.go:214 level=debug component="discovery manager scrape" msg="Discoverer channel closed" provider=static/0
ts=2021-11-27T19:03:28.196Z caller=dedupe.go:112 component=remote level=info remote_name=e6fa2a url=http://127.0.0.1:10908/api/v1/receive msg="Done replaying WAL" duration=12.331255772s
ts=2021-11-27T19:03:30.867Z caller=dedupe.go:112 component=remote level=debug remote_name=e6fa2a url=http://127.0.0.1:10908/api/v1/receive msg="runShard timer ticked, sending buffered data" samples=230 exemplars=0 shard=0
ts=2021-11-27T19:03:35.865Z caller=dedupe.go:112 component=remote level=debug remote_name=e6fa2a url=http://127.0.0.1:10908/api/v1/receive msg=QueueManager.calculateDesiredShards dataInRate=23 dataOutRate=23 dataKeptRatio=1 dataPendingRate=0 dataPending=0 dataOutDuration=0.0003201718 timePerSample=1.3920513043478261e-05 desiredShards=0.0003201718 highestSent=1.638039808e+09 highestRecv=1.638039808e+09
ts=2021-11-27T19:03:35.865Z caller=dedupe.go:112 component=remote level=debug remote_name=e6fa2a url=http://127.0.0.1:10908/api/v1/receive msg=QueueManager.updateShardsLoop lowerBound=0.7 desiredShards=0.0003201718 upperBound=1.3
ts=2021-11-27T19:03:45.866Z caller=dedupe.go:112 component=remote level=debug remote_name=e6fa2a url=http://127.0.0.1:10908/api/v1/receive msg=QueueManager.calculateDesiredShards dataInRate=23.7 dataOutRate=18.4 dataKeptRatio=1 dataPendingRate=5.300000000000001 dataPending=355.5 dataOutDuration=0.00025613744 timePerSample=1.3920513043478263e-05 desiredShards=0.00037940358300000006 highestSent=1.638039808e+09 highestRecv=1.638039823e+09
ts=2021-11-27T19:03:45.866Z caller=dedupe.go:112 component=remote level=debug remote_name=e6fa2a url=http://127.0.0.1:10908/api/v1/receive msg=QueueManager.updateShardsLoop lowerBound=0.7 desiredShards=0.00037940358300000006 upperBound=1.3
ts=2021-11-27T19:03:45.871Z caller=dedupe.go:112 component=remote level=debug remote_name=e6fa2a url=http://127.0.0.1:10908/api/v1/receive msg="runShard timer ticked, sending buffered data" samples=265 exemplars=0 shard=0
从日志中可以看到,它会去向 http://127.0.0.1:10908/api/v1/receive 也就是我们一开始部署的 Thanos receive 发送数据。
查询数据
打开我们一开始部署好的 Thanos query, 输入任意 metrics 进行查询,可以查询到预期的结果。
但是如果我们直接访问开启了 Agent 模式的 Prometheus 的 UI 地址的时候,会直接报错,无法进行查询。这是由于 如果已开启 Agent 模式的 Prometheus 将会默认关闭其 UI 查询能力,报警以及本地存储等能力。
总结
本篇主要进行了 Prometheus Agent 的上手实践,通过 Thanos receive 接收来自 Prometheus Agent 的 metrics 上报,然后通过 Thanos query 进行结果的查询。
Prometheus Agent 并没有本质上改变 Prometheus 指标采集的方式,仍然还是继续使用拉模式(Pull)。
它的使用场景主要是进行 Prometheus 的 HA/数据持久化或集群。与现有的一些方案在架构上会略有重合, 但是有一些优势:
- Agent 模式是 Prometheus 内置的功能;
- 开启 Agent 模式的 Prometheus 实例,资源消耗更少,功能也会更单一,对于扩展一些边缘场景更有利;
- 启用 Agent 模式后,Prometheus 实例几乎可以当作是一个无状态的应用,比较方便进行扩展使用;
过段时间就会发布正式版本了,你是否会尝试使用呢?
欢迎订阅我的文章公众号【MoeLove】
Recommend
About Joyk
Aggregate valuable and interesting links.
Joyk means Joy of geeK