

Thinking of Models as Graphs
source link: https://dzone.com/articles/thinking-of-models-as-graphs
Go to the source link to view the article. You can view the picture content, updated content and better typesetting reading experience. If the link is broken, please click the button below to view the snapshot at that time.

Thinking of Models as Graphs
This tutorial shows the first step in big data visualization analysis: ingesting your data! Read more to find out how to do it yourself!
Join the DZone community and get the full member experience.
Join For FreeThe first step in any big data visualization and analysis process is to ingest your data. In the past, most developers thought of models as rows with attributes and references to other row identifiers. In keeping with that mentality, Perspectives pulled data from a relational database into its session-scoped model.
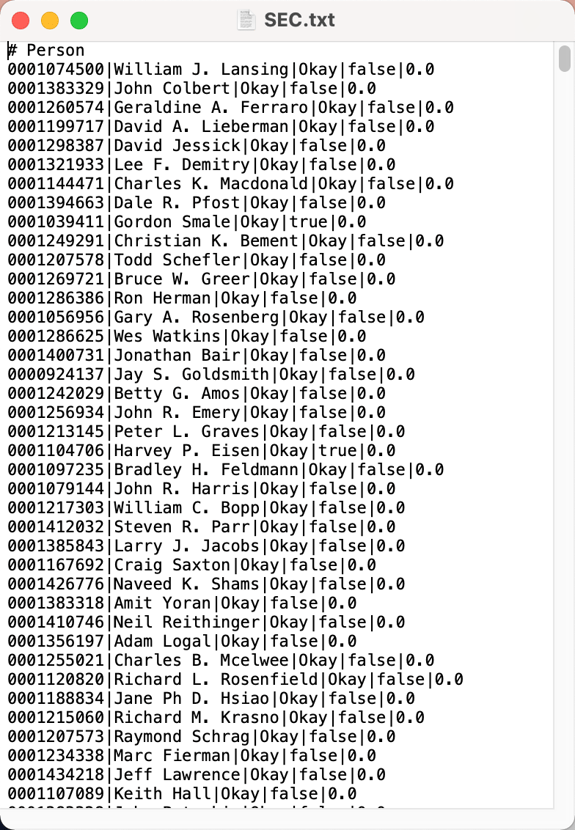 Relational social network data are shown in rows of elements and attributes.
Modern graph visualization developers tend to conceptualize data differently. While many users still pull data from an RDBMS, an increasing number use graph-based data storage and think about their data in graph-like ways.
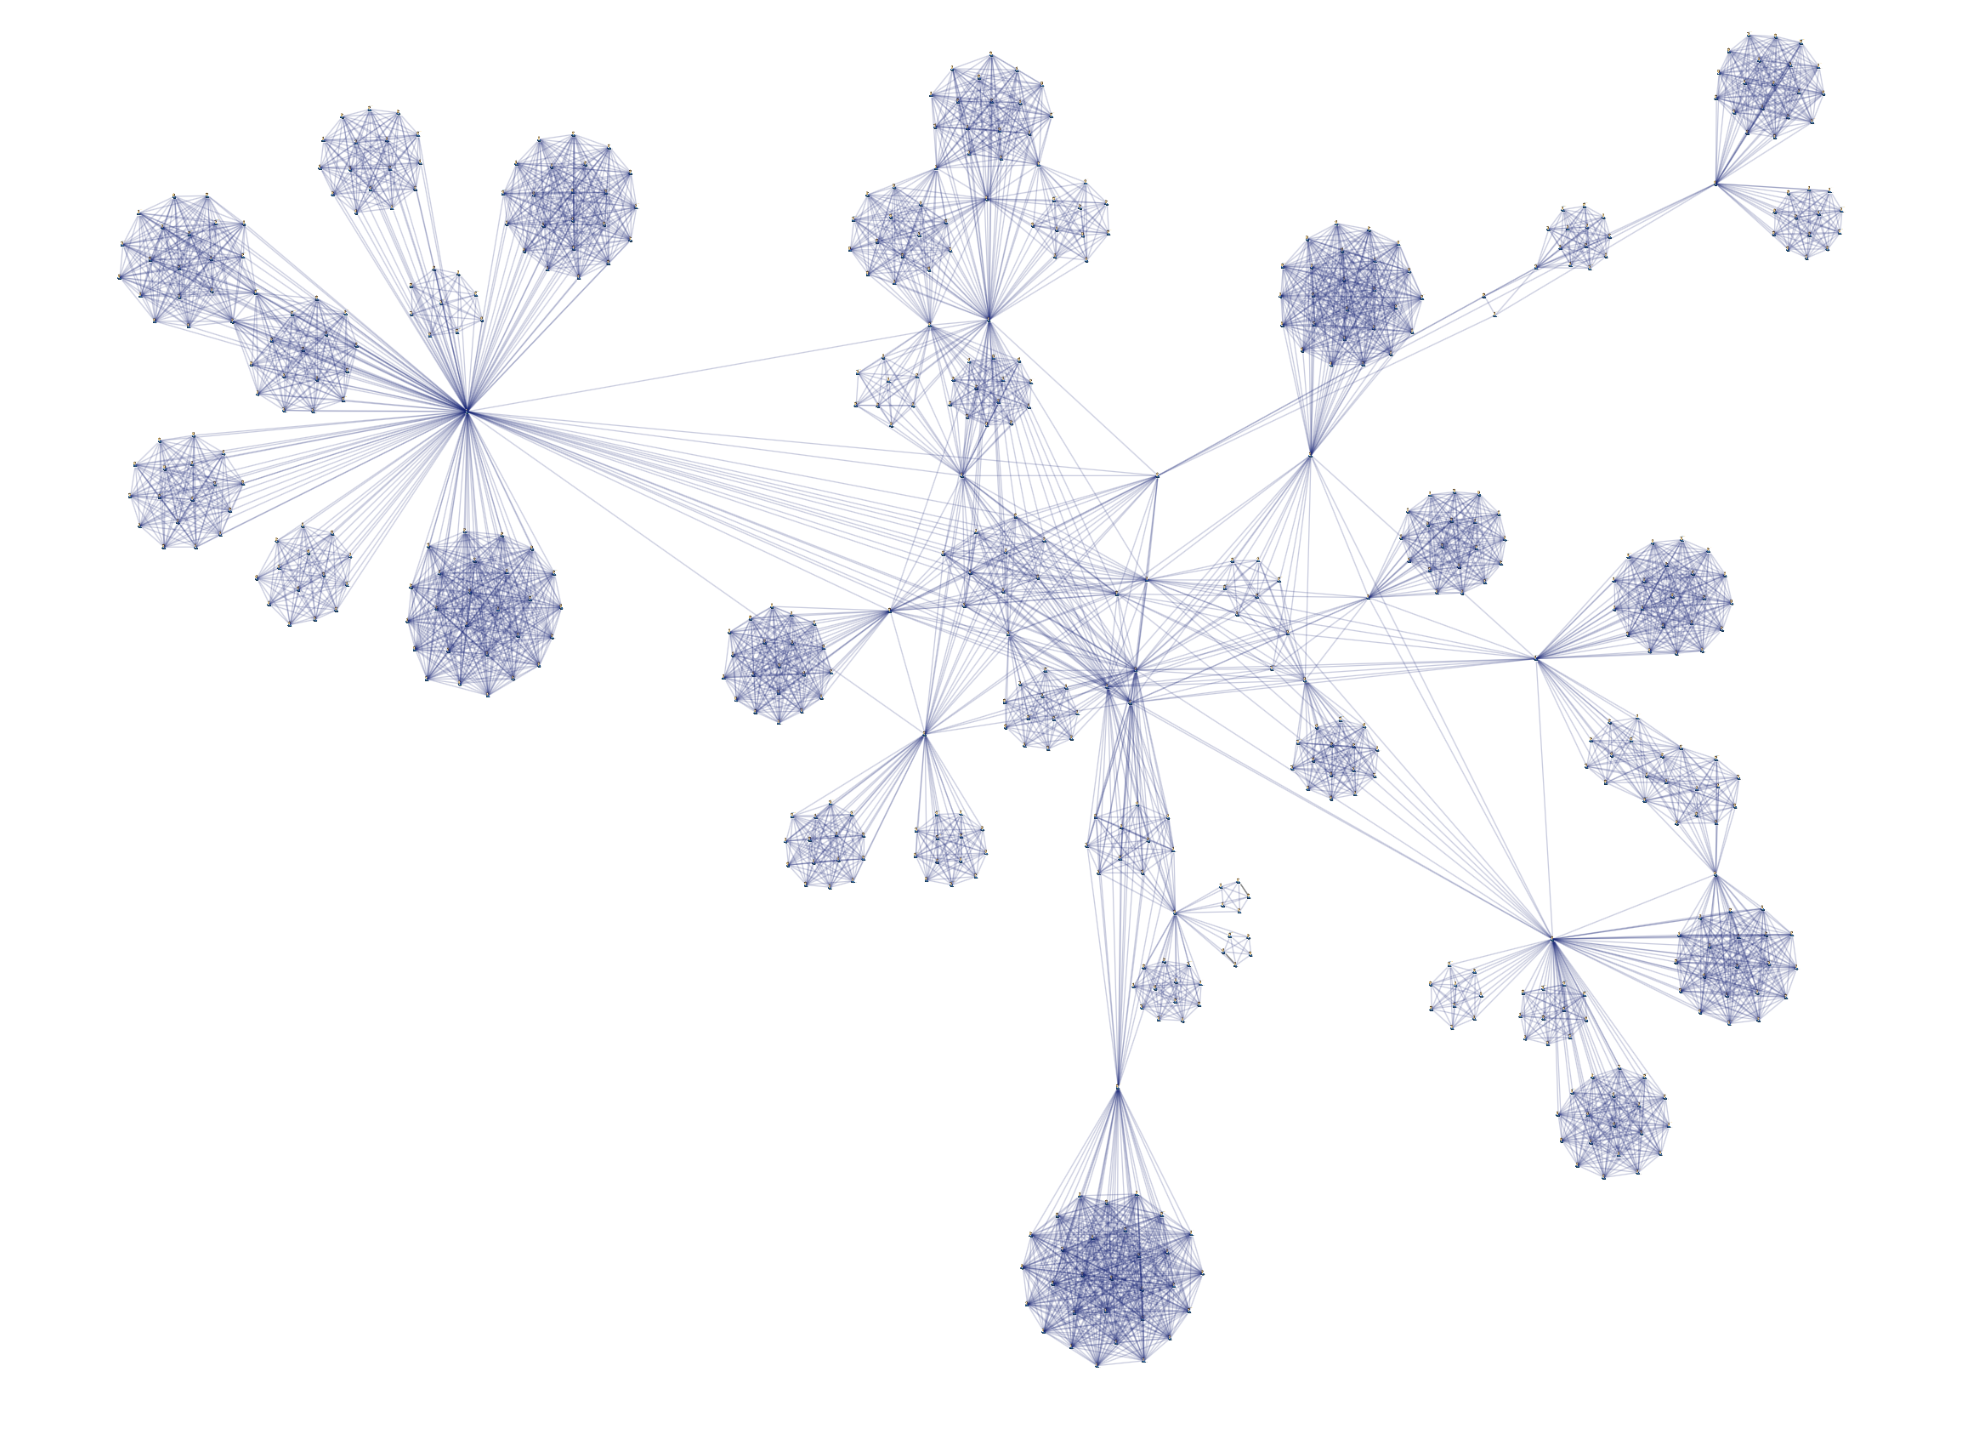 The same social network data are shown as a graph visualization.
Working With Models as Graphs
The new Perspectives schema editor interface presents data as a graph to help developers view and define schemas. Fundamentally, data in the schema editor displays as a property graph where:
- Node types are green.
- Edge types are shown either as red edges or as red nodes, with their source and target indicated with edges.
- Attributes can be values or references if you need to support concepts like multiple foreign keys in a single row.
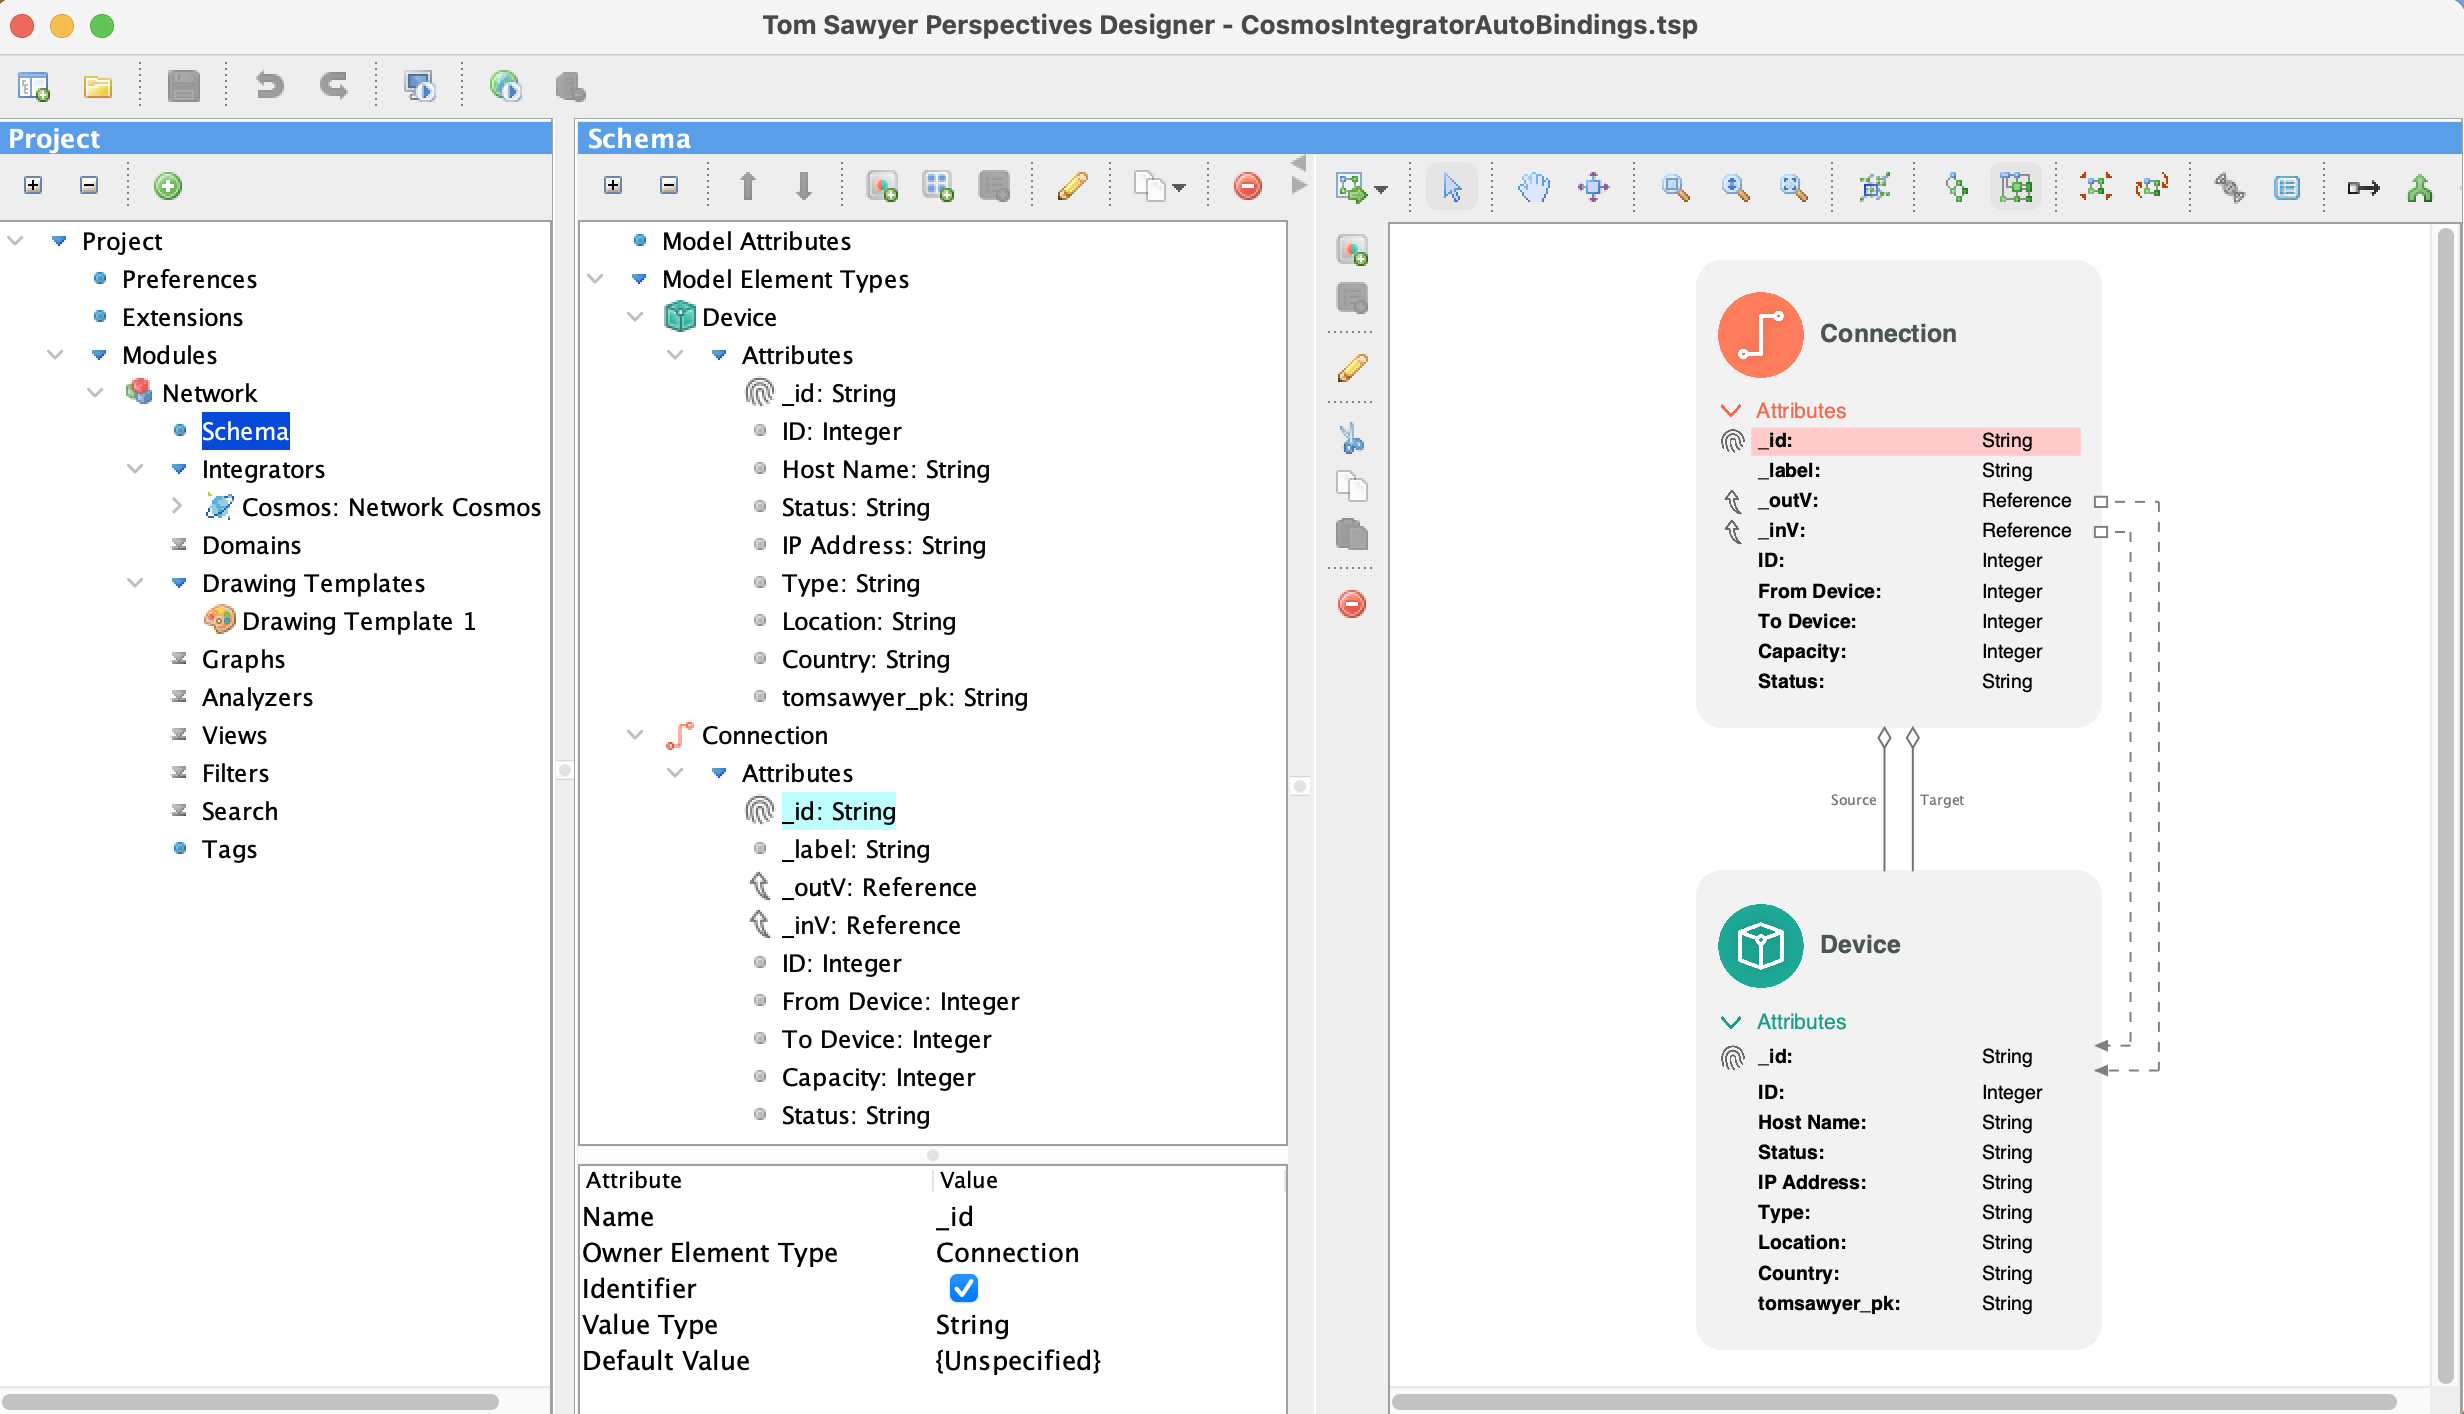 Modern graph visualization development requires modern thinking. Perspectives 10.0 features this updated schema editor that allows you to work with your schema as a graph.
This feature gives exceptional flexibility to a host of users. RDBMS users can treat everything as a node and get an experience very much like a traditional SQL browser. Graph database users can more easily take advantage of the graph concepts they built into their data. Or anyone can take some of column A and all of column B.
Storing Models as Graphs
To further align with the graph-as-model approach, Perspectives now implements schema as a graph model. Understanding the graph-based problems that users are encountering, the Perspectives native graph in-memory model takes advantage of the nature of the graph-based database, even for non-graph databases.
Designing Modern Graph Visualizations With Updated APIs
To make the most of your model, you need to be able to exercise its graph nature. A few new expressions and functions in the Perspectives expressions API will help.
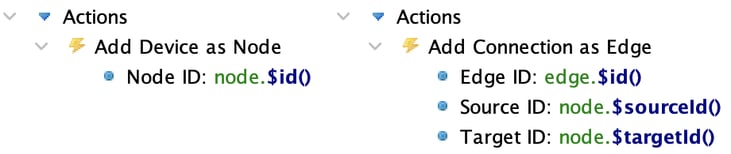
First, the Perspectives in-memory model element now features an identifier accessible via expression. The system ID for model elements, accessed by $id(), is a UUID automatically created for each model element upon its creation. Since every element in the model has a unique ID, this provides a way to find these elements in the model. Perspectives saves time and potential errors by automatically creating these unique names. When an element needs to know "Who am I?," Perspectives uses $id() and finds the name easily.
Secondly, if an element is an edge, you can now use $sourceId() and $targetId() to easily find attached nodes. While these IDs will be helpful when debugging your code, they can do so much more. $sourceId() and $targetId() make it possible to traverse the graph much more easily. Since this connectivity is so conveniently exposed, you can map and model your data and see connections much more quickly.
Finally, the new $source() and $target() lookup functions will help you pull attributes directly from the source and target elements. They essentially discover any attributes that are connected at the ends of an edge. This makes traversing big data far faster and much, much easier.
Recommend
About Joyk
Aggregate valuable and interesting links.
Joyk means Joy of geeK