

Implementing Dynamic Heat Maps In Angular Apps - DZone Web Dev
source link: https://dzone.com/articles/implementing-dynamic-heat-maps-in-angular-apps
Go to the source link to view the article. You can view the picture content, updated content and better typesetting reading experience. If the link is broken, please click the button below to view the snapshot at that time.

Implementing Dynamic Heat Maps In Angular Applications
Heat visualization implementation in less then 5 minutes.
Join the DZone community and get the full member experience.
Join For FreeIn the article, I would like to describe a way to easily implement a simple heat map in an Angular application. For that, I will use two external libraries, which are going to be Leaflet.js and Heatmaps.js. Before the implementation of the heat map, I prefer to begin with a brief introduction to the libraries I mentioned above.
Leaflet.js
It is one of the most popular JavaScript libraries for interactive maps. It has over 30k stars on GitHub. There is an alternative to it such as OpenLayers. But in my example, I picked a leaflet.
Heatmap.js
JavaScript library for heat maps implementation. It is very easy to use and it takes only several lines of code to bring heat visualization. Most important in our case is that this library contain the plugin for a leaflet.
Implementation
Time to start the implementation of dynamic heat maps. First, we need to create a simple angular project by using the following command.
ng new heatmap
Now, we need to install the required libraries.
npm install leaflet
npm install heatmap.js
To be able to represent map tiles properly we need to add links to leaflet styles in the angular.json file. Besides that, links to libraries' JavaScript code also should be added.
"styles": [
"./node_modules/leaflet/dist/leaflet.css",
"src/styles.scss"
],
"scripts": [
"./node_modules/leaflet/dist/leaflet.js",
"./node_modules/heatmap.js/build/heatmap.js",
"./node_modules/heatmap.js/plugins/leaflet-heatmap/leaflet-heatmap.js"
]
The next step is to implement map representation in the app. For that, we need to add a div in the app.component.html file with id="map". Then we can style it by assigning width: 100vw and height: 100vh.
Inside the app.component.ts, we need to write the following code:
import {Component, OnInit} from '@angular/core';import * as leaflet from 'leaflet';
@Component({selector: 'app-root',
templateUrl: './app.component.html',
styleUrls: ['./app.component.scss']
})
export class AppComponent implements OnInit {private map: any;
ngOnInit(): void {this.initMap();
}
private initMap(): void {// Initialising map with center point by using the coordinates
// Setting initial zoom to 3
this.map = leaflet.map('map', {center: [ 39.8282, -98.5795 ],
zoom: 3
});
// Initialising tiles to the map by using openstreetmap
// Setting zoom levels
const tiles = leaflet.tileLayer('https://{s}.tile.openstreetmap.org/{z}/{x}/{y}.png', {maxZoom: 18,
minZoom: 3,
attribution: '© <a href="http://www.openstreetmap.org/copyright">OpenStreetMap</a>'
});
// Adding tiles to the map
tiles.addTo(this.map);
}
}
To be able to show heat layers, we need to add some data. For that, I have created a separate file in the project which contains a randomly generated data set.
export const heatData: any = {data: [
{lat: 48.37, lng: 31.16, count: 143}, {lat: 49.37, lng: 36.16, count: 133}, {lat: 43.32, lng: 37.13, count: 163}, {lat: 39.33, lng: 38.42, count: 143}, {lat: 42.31, lng: 34.65, count: 133}, {lat: 43.39, lng: 32.10, count: 163},]
}
Finally, we can implement heat layers by enhancing the logic in app.component.ts. That is how the whole component looks in the end:
import {Component, OnInit} from '@angular/core';import * as leaflet from 'leaflet';
import 'heatmap.js';
import {heatData} from "./data";
declare const HeatmapOverlay: any;
@Component({selector: 'app-root',
templateUrl: './app.component.html',
styleUrls: ['./app.component.scss']
})
export class AppComponent implements OnInit {private map: any;
ngOnInit(): void {this.initMap();
}
private initMap(): void {// Initialising map with center point by using the coordinates
// Setting initial zoom to 3
this.map = leaflet.map('map', {center: [ 39.8282, -98.5795 ],
zoom: 3
});
// Initialising tiles to the map by using openstreetmap
// Setting zoom levels
const tiles = leaflet.tileLayer('https://{s}.tile.openstreetmap.org/{z}/{x}/{y}.png', {maxZoom: 18,
minZoom: 3,
attribution: '© <a href="http://www.openstreetmap.org/copyright">OpenStreetMap</a>'
});
// Adding tiles to the map
tiles.addTo(this.map);
// Setting up heat layer config
const heatLayerConfig = {"radius": 5,
"maxOpacity": .8,
"scaleRadius": true,
// property below is responsible for colorization of heat layer
"useLocalExtrema": true,
// here we need to assign property value which represent lat in our data
latField: 'lat',
// here we need to assign property value which represent lng in our data
lngField: 'lng',
// here we need to assign property value which represent valueField in our data
valueField: 'count'
};
// Initialising heat layer and passing config
const heatmapLayer = new HeatmapOverlay(heatLayerConfig);
//Passing data to a layer
heatmapLayer.setData(heatData);
//Adding heat layer to a map
heatmapLayer.addTo(this.map);
}
}
And here is how the app looks:
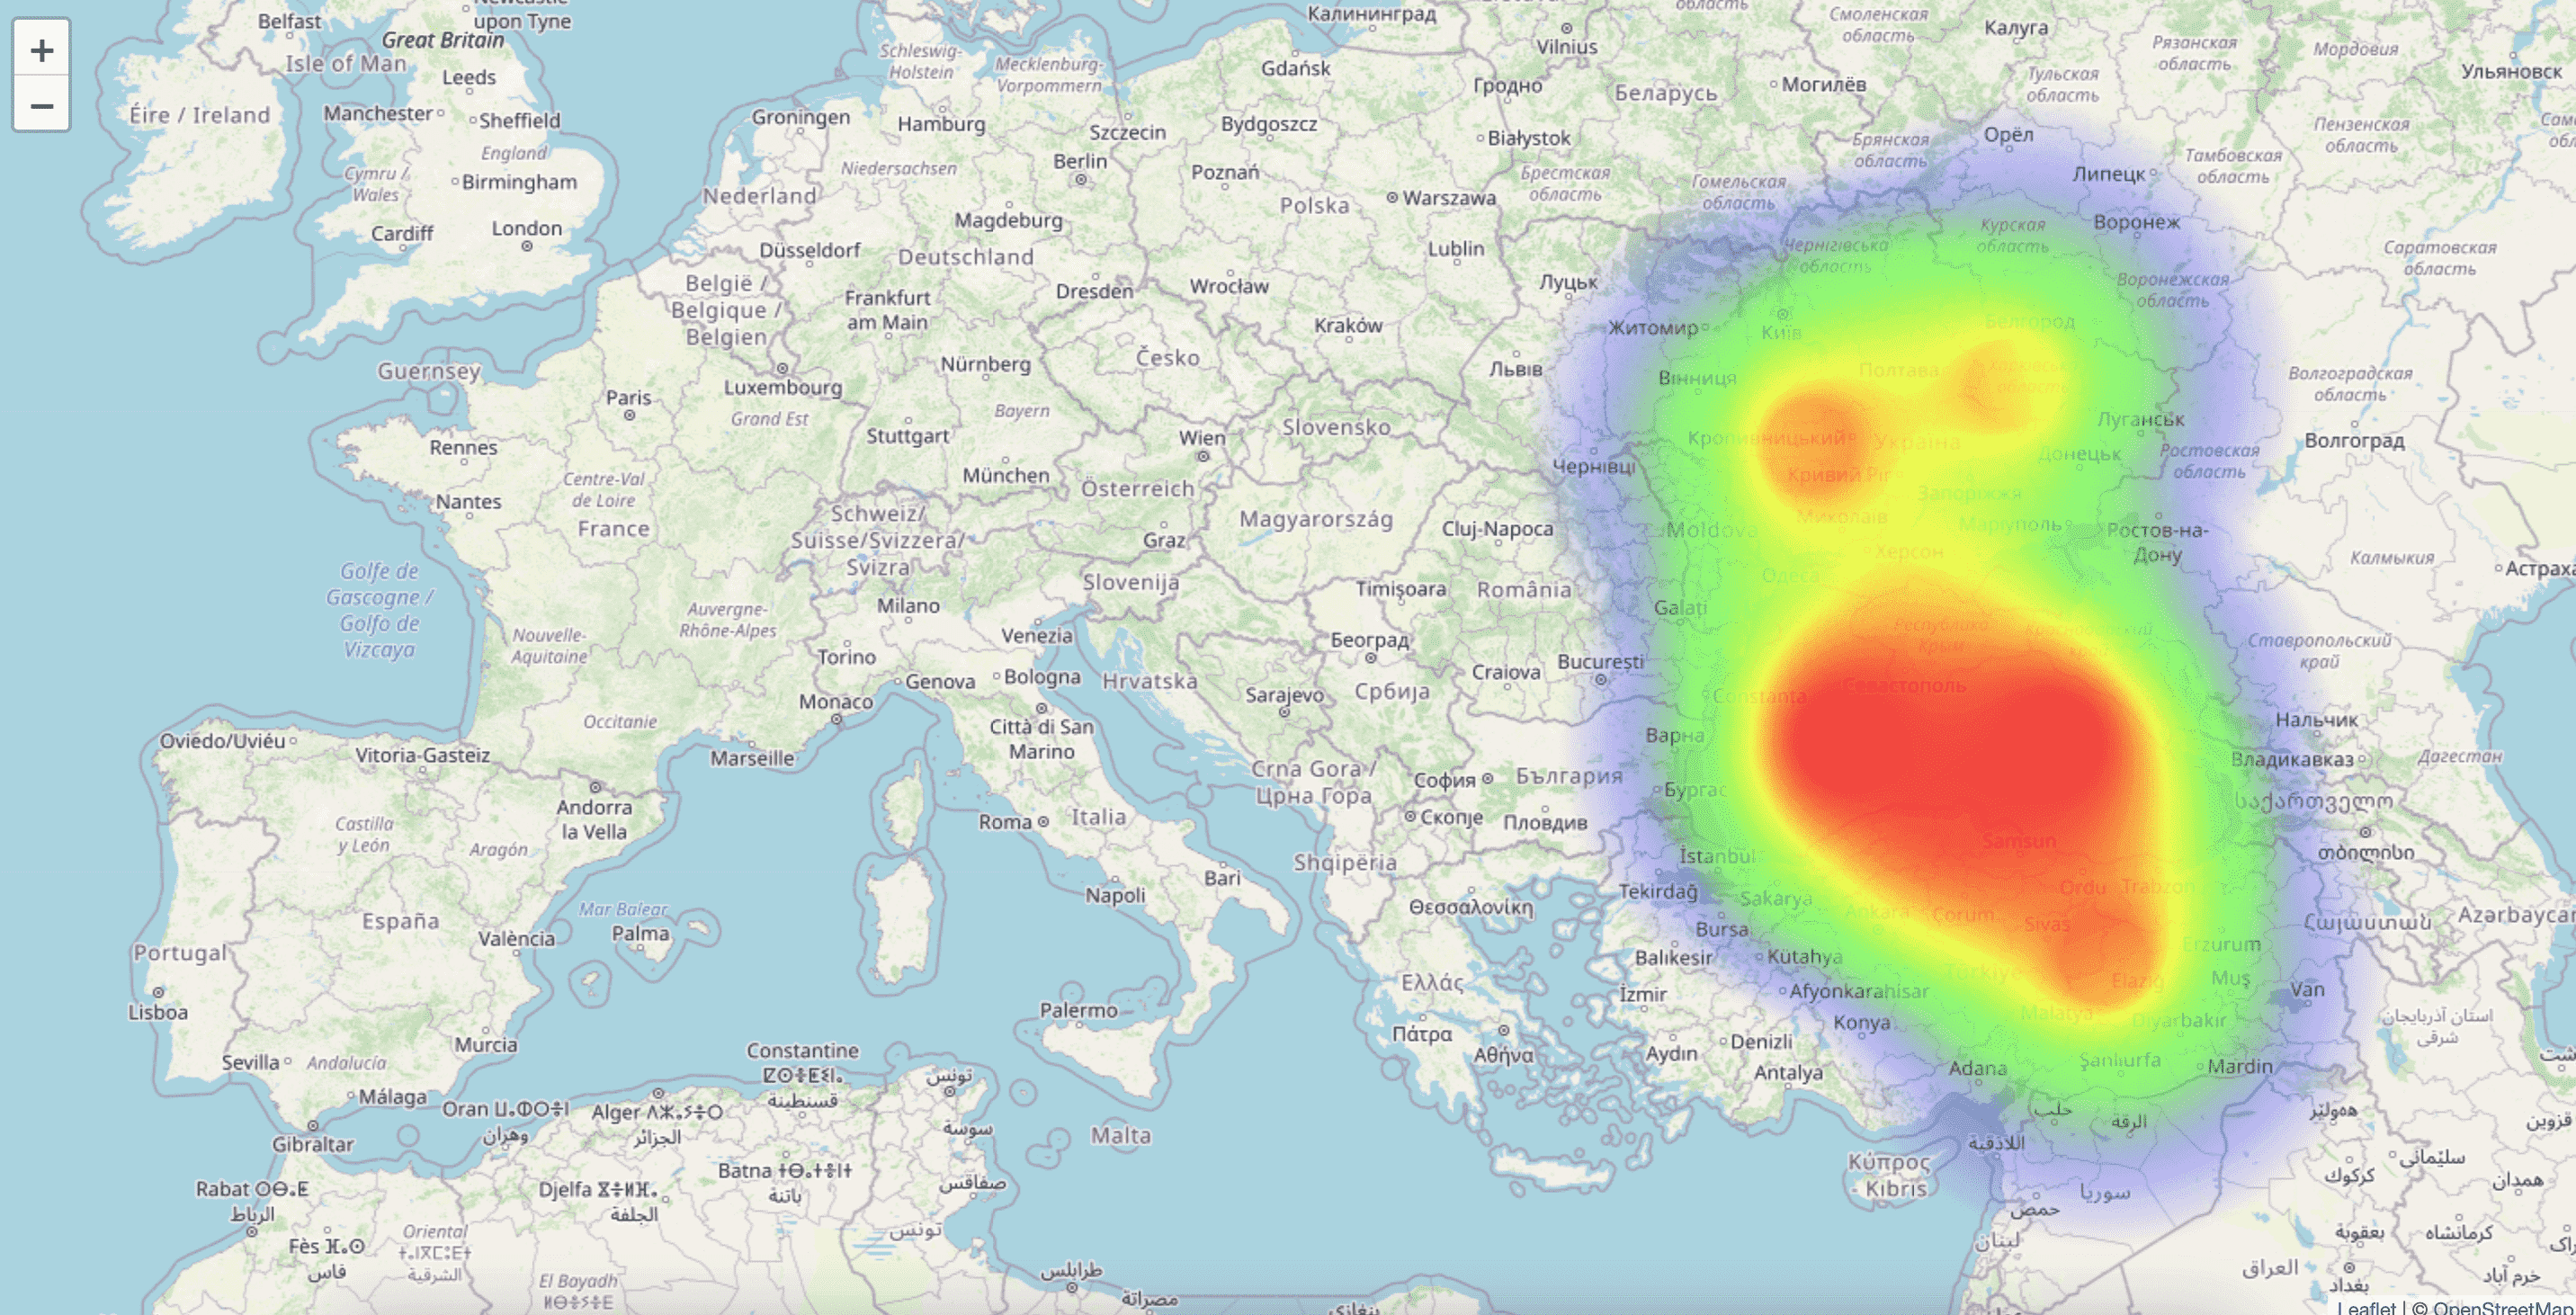
Summing-Up
As you see it took only several lines of code to have heat maps visualization. In practice, it can be used for different purposes, such as climate change representation, the volume of events on location, or even for movement tracking. For example, FIFA uses heat maps to represent football player movement.
Hope it is helpful. The source code of a demo application you can find in my GitHub.
Recommend
About Joyk
Aggregate valuable and interesting links.
Joyk means Joy of geeK