

Observability Tips and Tricks For Using Grafana and Prometheus
source link: https://hackernoon.com/observability-tips-and-tricks-for-using-grafana-and-prometheus
Go to the source link to view the article. You can view the picture content, updated content and better typesetting reading experience. If the link is broken, please click the button below to view the snapshot at that time.

seasoned devops && open source enthusiast && @GitKraken ambassador
“Dashboard anything. Observe everything.”
Overview
Recently I’ve started working in a project heavy focused on observability and monitoring in which the Prometheus configuration and all the Grafana dashboards and alarms were implemented by someone else.
Basically I was blindfolded working with a black-box in terms of application know-how and monitoring perspective.
Foundation
Some important concepts before going further:
Prometheus stores data in a time-series data model, basically streams of values associated with a timestamp.
Prometheus scrapes endpoints also known as instances and a collection of instances form a job.
Every time-series is uniquely identified by its metric name and optional key-value pairs called labels.
#<metric name>{<label name>=<label value>, ...}
kube_node_labels{cluster="aws-01", label_kubernetes_io_role="master"}
Grafana supports many different storage backends for your time-series data (data source). We will focus on Prometheus.
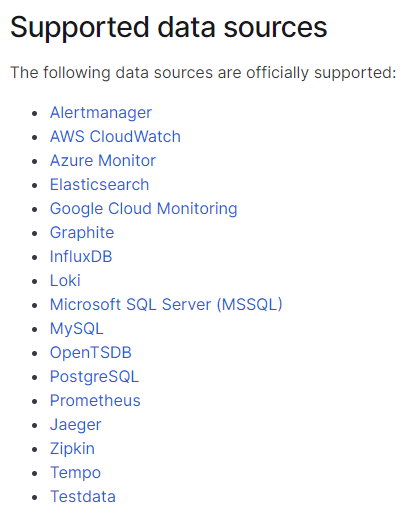
Grafana officially data sources
Start exploring
Get all labels
As I said we know close to zero things about our metrics, therefore some probing (in terms of metrics and labels) is required. For this we can create a new ephemeral dashboard, and tinker with query type variable.
So let’s say we want to get all the labels…kind of greedy.
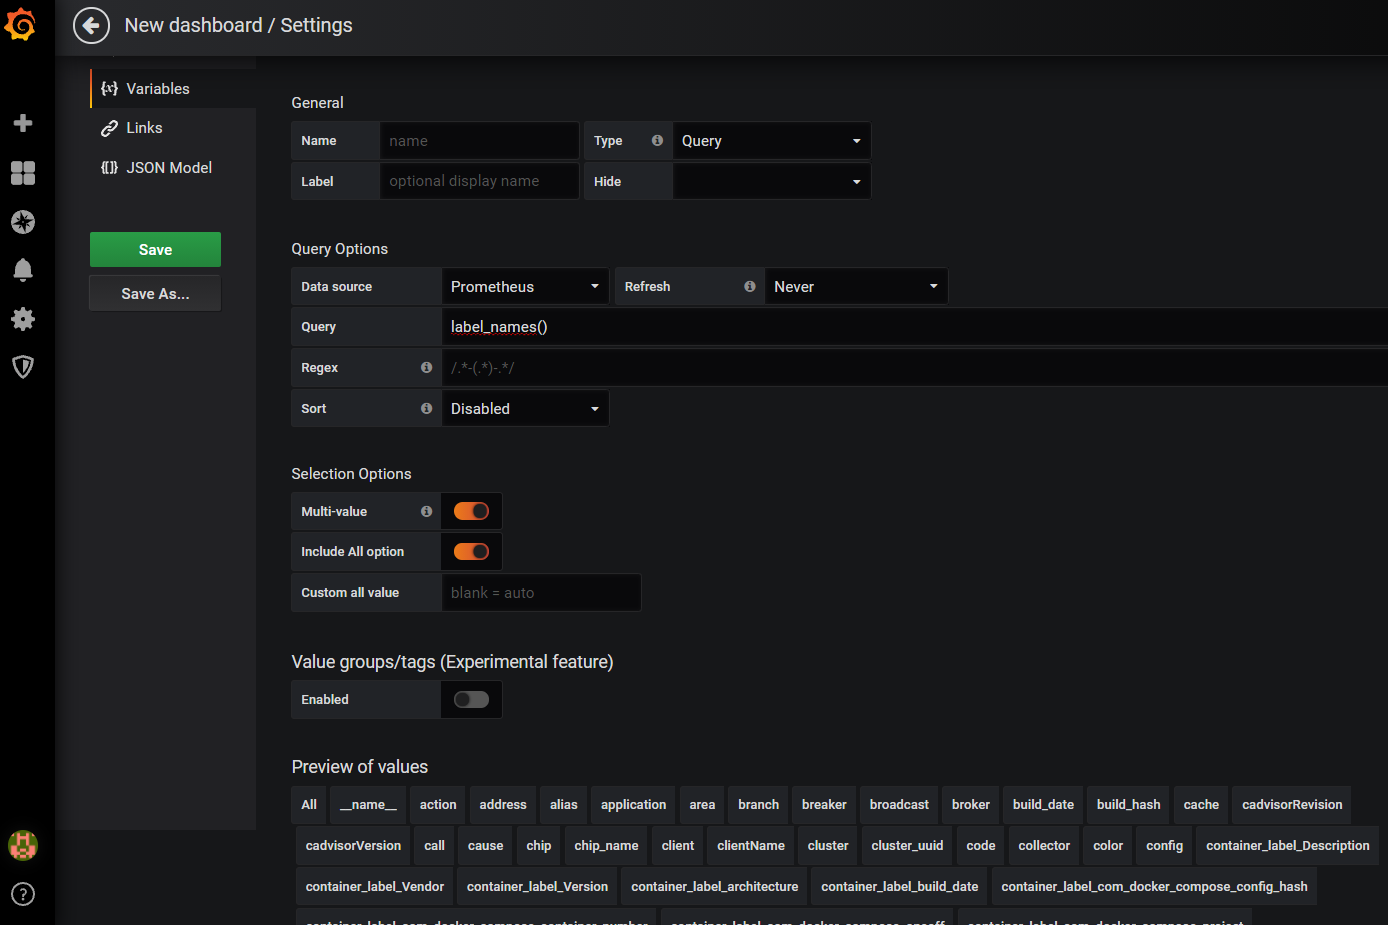
label_names()
We have the following options:
label_names()	Returns a list of label names.
label_values(label)	Returns a list of label values for the label in every metric.
label_values(metric, label)	Returns a list of label values for the label in the specified metric.
metrics(metric)	Returns a list of metrics matching the specified metric regex.
query_result(query)	Returns a list of Prometheus query result for the query.
Keep in mind that label function doesn’t support queries and isn't a part of Prometheus functions, but a part of Grafana templating (that’s why we created a new dashboard).
We can get all the labels also using Prometheus API endpoint /api/v1/labels:
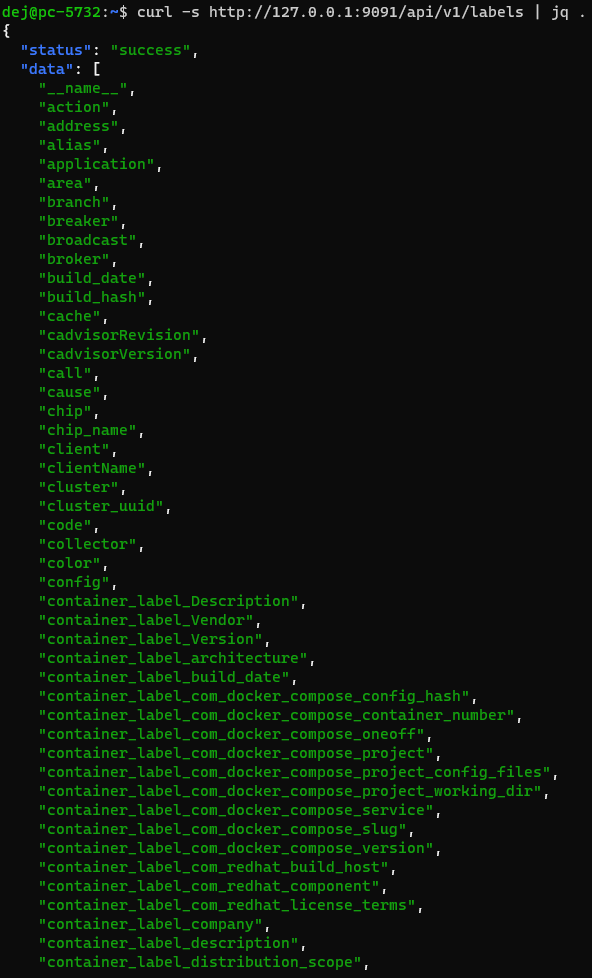
Prometheus API
Extract all the values for a particular label
Let’s assume that we want all the values for dockerVersion label we can do this using Grafana
label_valuesfunction or using Prometheus API endpoint /api/v1/label/<label_name>/values.
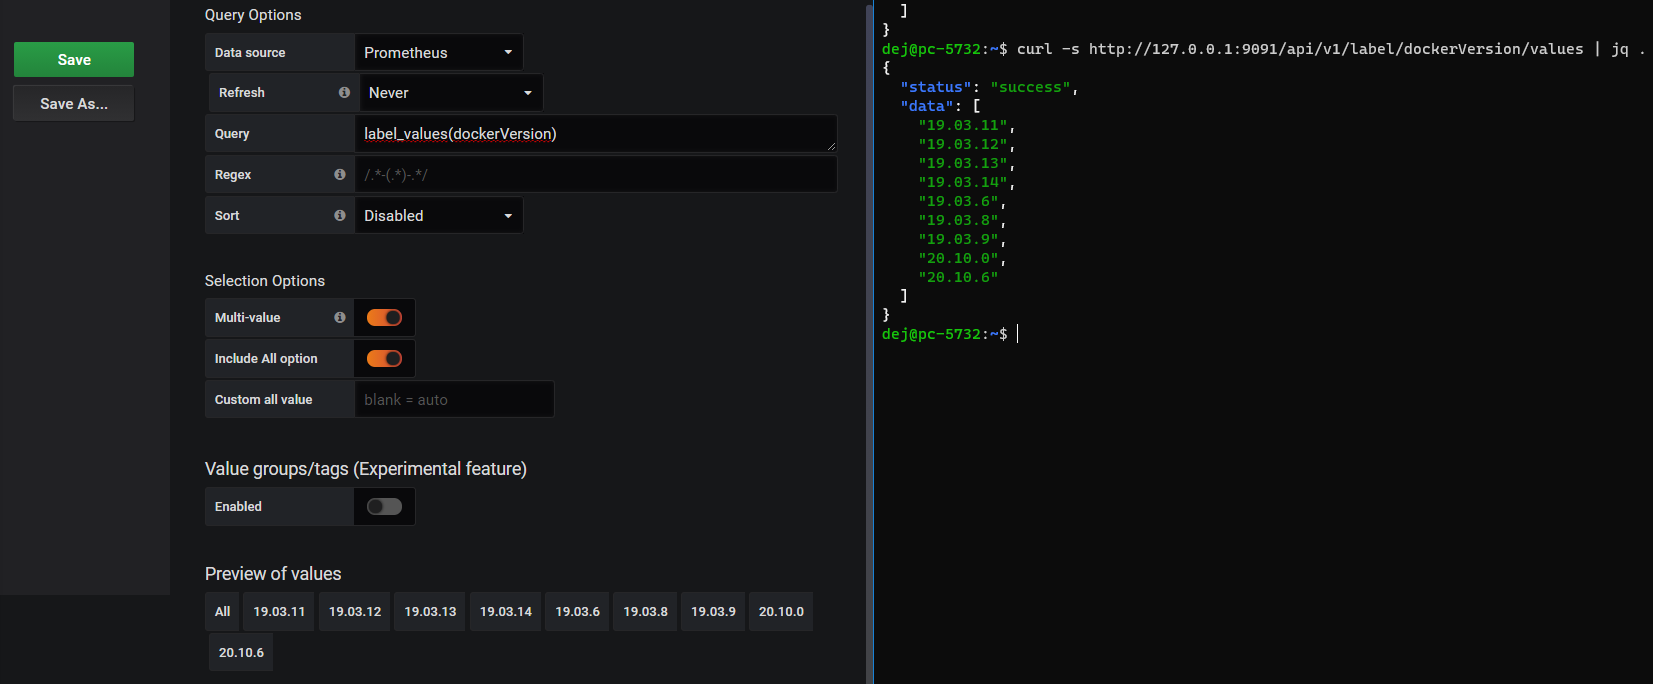
Label Values
Get all the jobs
Prometheus API exposes the following endpoint /api/v1/label/job/values in order to gather all the jobs scraped by that particular instance.
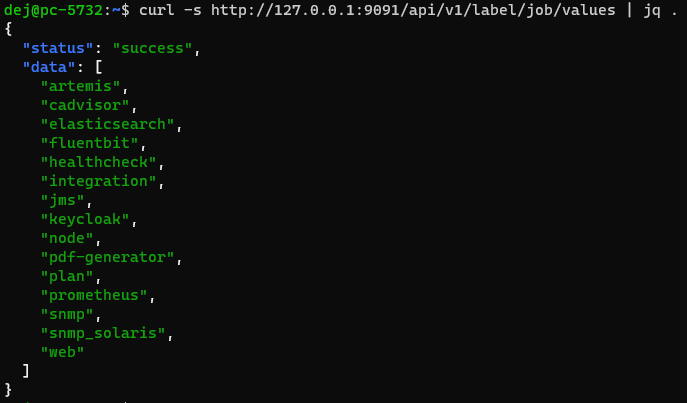
Prometheus jobs endpoint
Quick check if the instances are healthy/reachable - automatically generated labels and time-series
When Prometheus scrapes a target, it attaches some labels automatically to the scraped time series which serve to identify the scraped target.
# up time series is useful for instance availability monitoring
up{job="<job-name>", instance="<instance-id>"}
Going further we also can check all the labels for a particular job using the
upmetric.
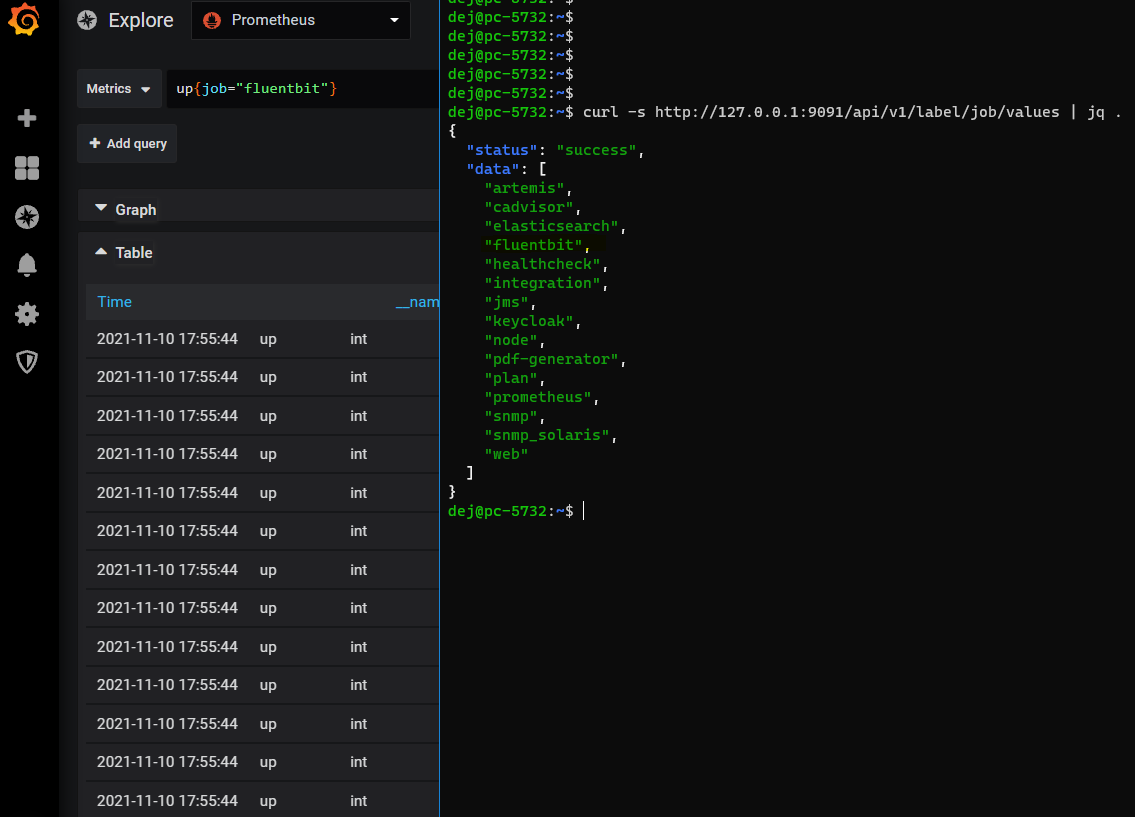
Job fluent-bit labels and value
Conclusions
Grafana and Prometheus are frequently used in organizations, and they’re such a useful monitor-stack because despite the fact that at a certain point we might not know all the implementation details concerning metric collection, they allow us to cast some light using the aforementioned tips.
Grafana
Prometheus API
label_names()
curl -s http://127.0.0.1:9091/api/v1/labels
label_values(<label_name>)
label_values(<metric_name>,<label_name>)
curl -s http://127.0.0.1:9091/api/v1/label/<label_name>/values
up{job="<job_name>"}
Recommend
About Joyk
Aggregate valuable and interesting links.
Joyk means Joy of geeK