

Visual Studio 2022 verson 17.0 Release Notes | Microsoft Docs
source link: https://docs.microsoft.com/en-us/visualstudio/releases/2022/release-notes
Go to the source link to view the article. You can view the picture content, updated content and better typesetting reading experience. If the link is broken, please click the button below to view the snapshot at that time.

 Visual Studio 2022 version 17.0 Release Notes
- 11/16/2021
- 53 minutes to read
Watch the Visual Studio 2022 launch event to learn about what's new, hear tips & tricks, participate in a live Q&A with the team, and download free digital swag.
Developer Community | Visual Studio 2022 Roadmap | System Requirements | Compatibility | Distributable Code | License Terms | Blogs | Latest Release Known Issues | Whats New in Visual Studio Docs
Click a button to download the latest version of Visual Studio 2022. For instructions on installing and updating Visual Studio 2022, see Update Visual Studio 2022 to the most recent release. Also, see instructions on how to install offline.
Visit the visualstudio.microsoft.com/downloads page to download other Visual Studio 2022 products.
What's New in Visual Studio 2022 version 17.0
Visual Studio 2022 version 17.0 Releases
Visual Studio 2022 Blog
The Visual Studio 2022 Blog is the official source of product insight from the Visual Studio Engineering Team. You can find in-depth information about the Visual Studio 2022 releases in the following posts:
 Visual Studio 2022 version 17.0.1
released November 16, 2021
Issues Addressed in this release of 17.0.1
- Fixed a crash when using batch builds.
- Fixed a crash when launching Xamarin.Forms projects with XAML Hot Reload enabled.
From Developer Community
Developer Community has a full list of fixes available in 17.0.
Visual Studio 2022 version 17.0.0
released November 08, 2021
Summary of What's New in this Release of Visual Studio 2022 version 17.0.0
64-bit
- devenv.exe is now 64-bit only
Azure Cloud Services
- Azure Cloud Service (classic) and Azure Cloud Service (extended support) projects are now supported.
- The v143 build tools are now available through the Visual Studio installer as well as the standalone build tools.
- The new Hot Reload experience is now available to native C++ applications when running under the debugger. It supports both MSBuild and CMake projects. For more information see our Hot Reload section below.
- You can now build and debug natively on WSL2 without establishing a SSH connection. Both cross-platform CMake projects and MSBuild-based Linux projects are supported.
- Visual Studio now supports the
buildPresets.targetsoption in CMakePresets.json. This allows you to build a subset of targets in your CMake project. - The Project menu in CMake projects has been streamlined and exposes options to "Delete Cache and Reconfigure" and "View Cache".
- CMake Overview Pages have been updated to support CMakePresets.json.
- Implemented
/scanDependenciesflag for outputting C++20 module dependencies for CMake projects as described in P1689r4. This is a step towards support for building modules-based projects with CMake and we are working on completing this support in later releases. - You can now debug processes running on a remote systems from Visual Studio with LLDB.
- We have upgraded the version of CMake shipped with Visual Studio to version 3.21. See the CMake 3.21 release notes for details on what is available.
- LLVM tools shipped with Visual Studio have been upgraded to LLVM 12. See the LLVM release notes for details.
- The MSVC toolset now defaults to SHA-256 source hashing in debug records. Previously, the toolset used MD5 for source hashing by default.
- The Game development with C++ workload now installs the latest Unreal Engine with support with for Visual Studio 2022.
- Made improvements in C++ IntelliSense when providing navigation and syntax highlighting for types from imported Modules and Header Units.
- Improved C++ IntelliSense performance by optimizing cached header usage and symbol database access, providing improved load times to get into your code.
- The IntelliSense Code Linter for C++ is now on by default, providing instant as-you-type suggestions and fix suggestions for common code defects.
- Support for libfuzzer under the switch
-fsanitize=fuzzer. See the documentation for more details. - We have improved null pointer dereference detection in our code analysis tooling.
- Code analysis now enforces that return values of functions annotated with
_Check_return_or_Must_inspect_result_must be checked. - Added support for
gsl::not_nullto code analysis. - Updated to NDK r21 LTS in C++ Mobile Development workload.
- C++ AMP headers are now deprecated. Including <amp.h> in a C++ project will generate build errors. To silence the errors, define
_SILENCE_AMP_DEPRECATION_WARNINGS. Please see our AMP Deprecation links for more details.
- Attach to process dialog improvements
- Exception helper improvements
- Force Run to Click
- Memory Dump Diagnostic Analysis
- We have released a new type of breakpoint called Dependent Breakpoint, which allows you to configure a breakpoint to be enabled only if another breakpoint is first hit.
- We have added more updates to the Extrenal Sources node , you can now see the module under the sub-node "Modules without Sources" and load the symbols form solution explorer itself.
- Breakpoint Gutter improvements
- Temporary Breakpoint
- Drag and Drop Breakpoint
- External Sources Node in Solution Explorer
- Attach to process dialog improvements
Personalization
- Added Color Tabs for vertical and horizontal tabs
- Added Theme Pack and worked with VS Code theme authors to launch collection of custom themes
- Built Theme Converter to convert VS Code themes to work in Visual Studio 2022
- Added capability to sync Visual Studio theme with Windows theme
- Added new document management capabilities inclduding customizing tab width, bolding active document, and additional close button in docwell.
- Added subword navigation
- Autosave is now available as a preview feature
- Multi-caret copy/paste experience
- Removed APIs from Microsoft.VisualStudio.Language.Client assemblies
- VS SDK contains several breaking changes and Visual Studio 2019 extensions will not work in 2022. See VSSDK documentation for more information.
- VS SDK Reference assemblies are no longer installed to the
VSSDK\VisualStudioIntegration\Common\Assembliesfolder. If your build was relying on these assemblies, please migrate your project to use NuGet packages instead. For offline scenarios:- Keep an in-org nuget feed from which to restore the nuget packages.
- Check in the binaries.
- Added ILanguageClient breaking change fixes
Cloud Services
- Azurite will be used for local emulation of Azure Storage instead of the older and no longer actively developed Azure Storage Emulator.
Git Tooling
- Multi-repo support under a preview flag for any Solution that spans different repositories (i.e. Solutions with projects hosted in different Git repositories)
- Publish to Azure DevOps is now fully supported in the create git repository experience
- Status bar enhancements including a new ability to view and open repositories from an empty VS and display a count of unpulled commits
- The overflow menu on the Git Changes window is now available for local only repositories with additional git operations
- Unified Diff toolbar containing the number of added/deleted lines and a discoverable configuration options
- Commit details enhancements including a more responsive and user friendly UI
Help Menu
- During 17.0 we have remodeled the Help Menu with Get Started material and helpful Tips/Tricks.
- Provides more collaboration with our development team by adding things such as access to Developer Community, Release Notes, the Visual Studio product Roadmap, and our Social Media pages.
- Hot Reload is now available to .NET developers through the Visual Studio debugger and without the debugger for many .NET 6 application types
- Hot Reload is now available to C++ developers when using the Visual Studio Debugger
For more details see the above link
IntelliCode
- Whole line completions predict your next chunk of C# code based on your current context, and presents it as an inline suggestion to the right of your cursor.
- Whole line completions are now compatible with the newest builds of JetBrains ReSharper. Note that updating the line completion context based on ReSharpers custom completions list item selection is not supported - if required, ReSharper users can opt to use Visual Studio native IntelliSense instead, as documented here
JavaScript/TypeScript
- We have released a new JavaScript/TypeScript project type that builds standalone JavaScript/TypeScript projects with additional tooling. You will be able to create Angular and React projects in Visual Studio using the framework version installed on your computer.
- JavaScript and TypeScript testing is now available in the Visual Studio Test Explorer
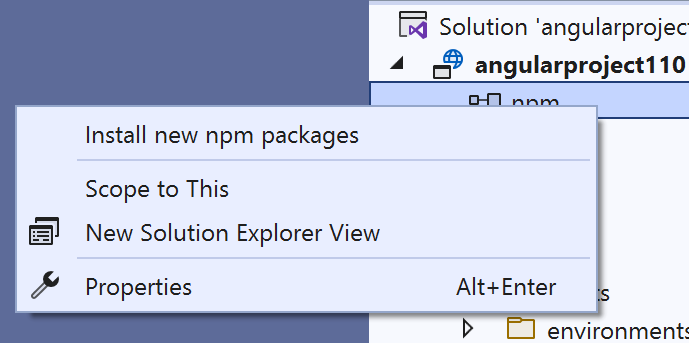
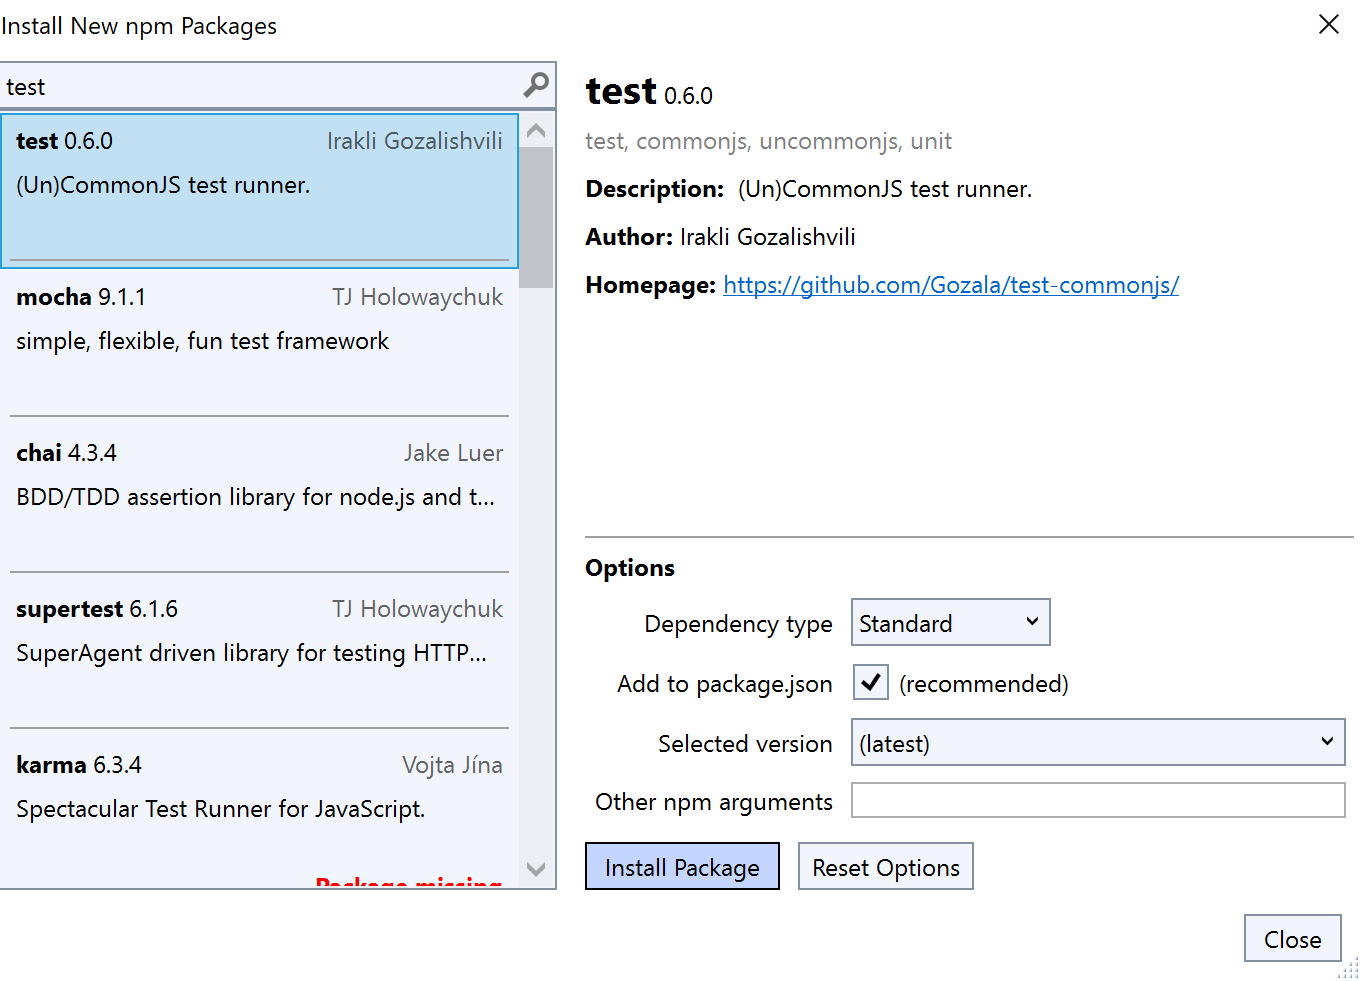
- NPM GUI available, so you can now download NPM modules the same way you download Nuget packages
.NET 6 SDK
- The .NET 6 SDK is included in Visual Studio 2022
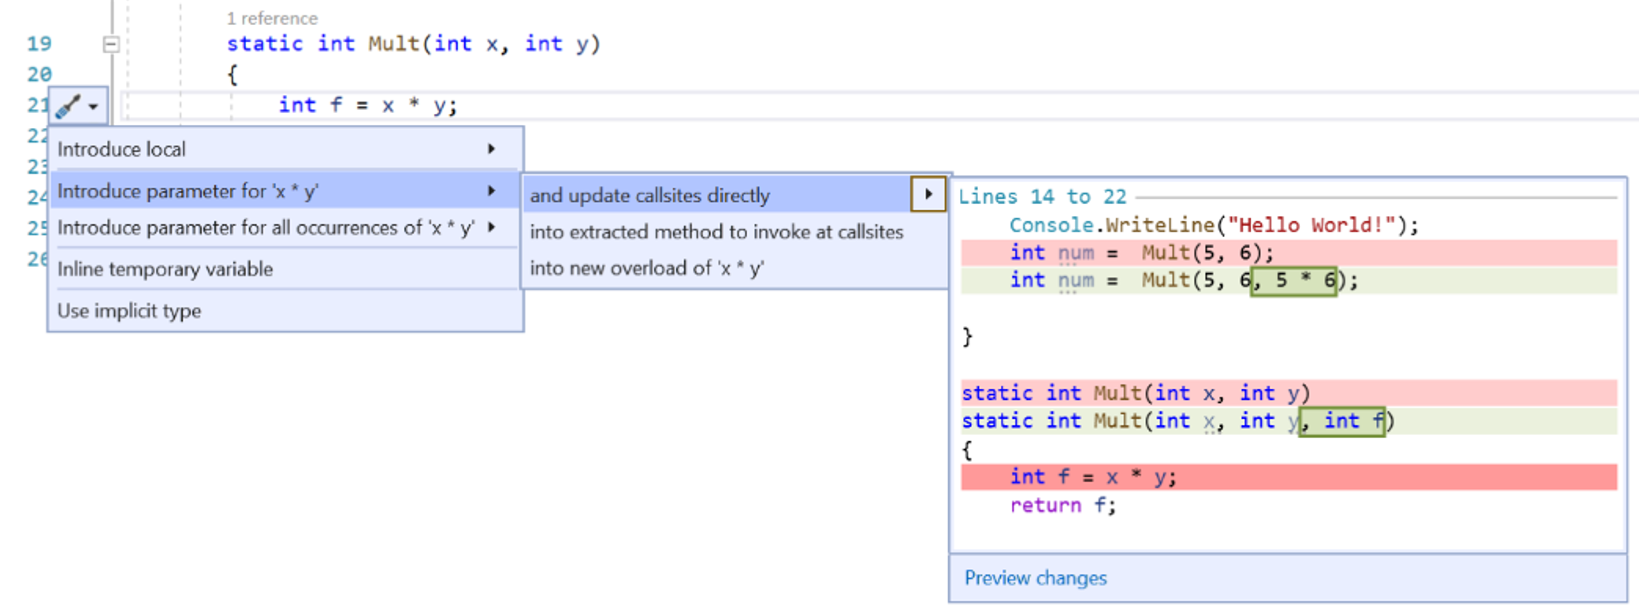
- Introduce parameter refactoring can move a new parameter from the method implementation to its callers.
- Track Value Source for data flow analysis
- Option to underline variables that are re-assigned
- Added search option in Generate Overrides dialog
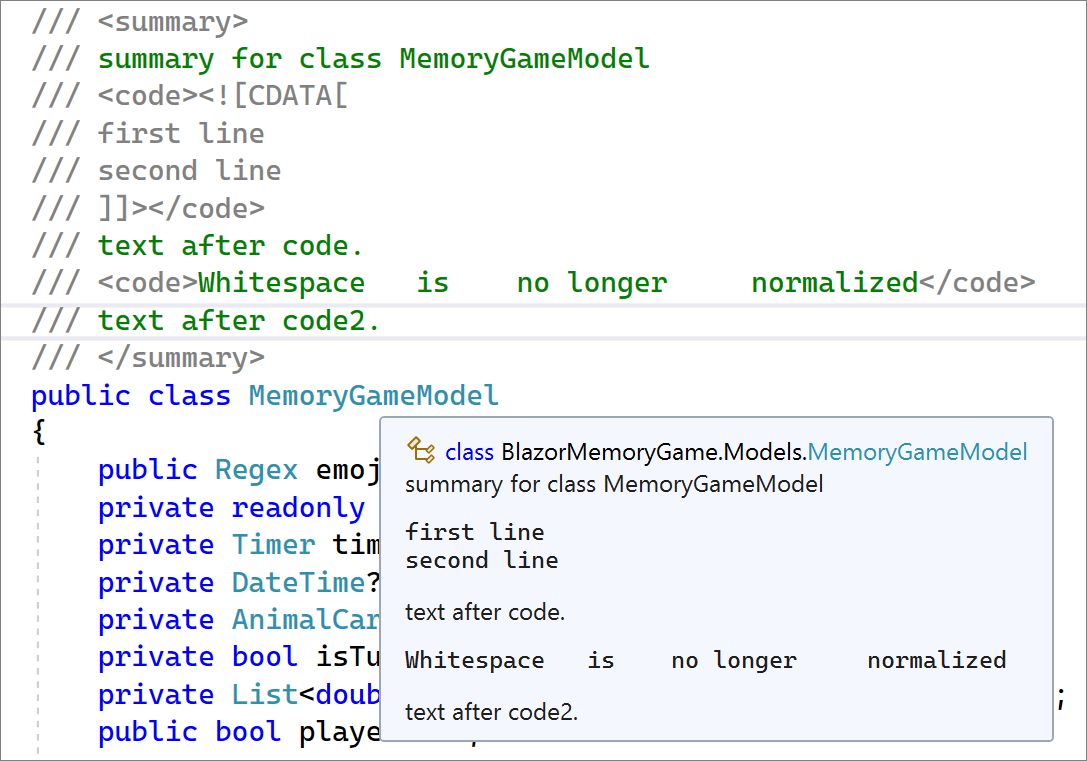
- Quick info for XML <code> tags now preserve whitespace and CDATA blocks
- Find All References window will now group multi-target projects
- Refactoring to remove repetitive types in Visual Basic
- Go to Implementation will no longer navigate to members with abstract declarations that are also overridden.
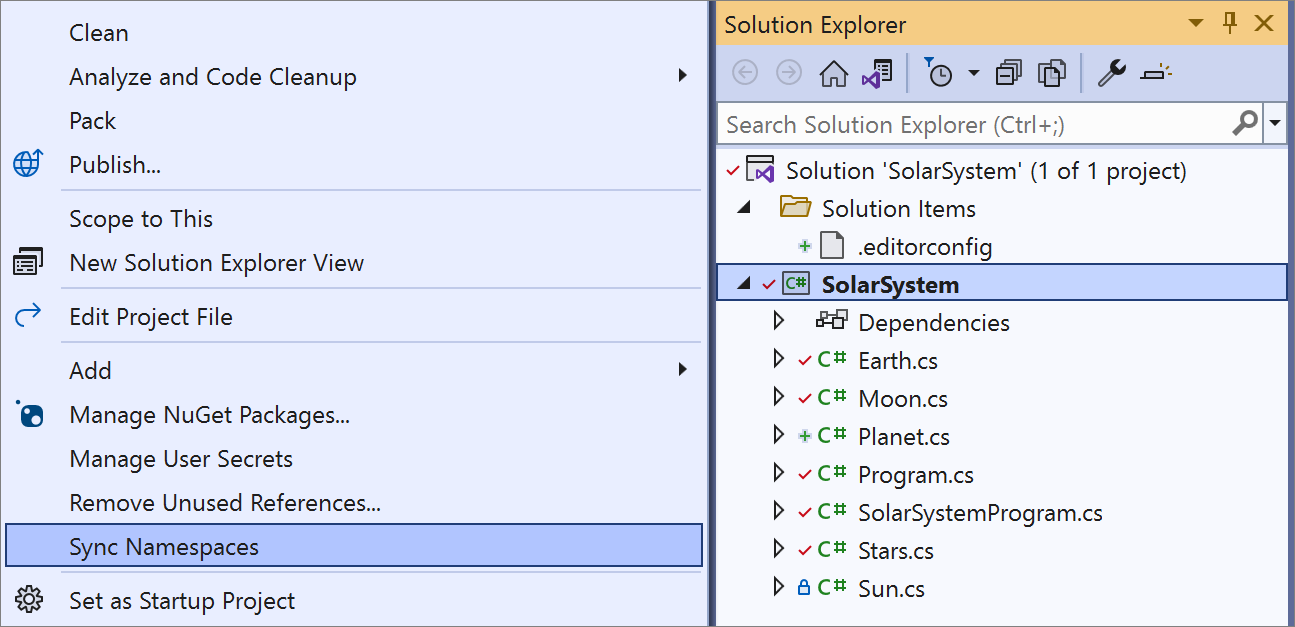
- Synchronize namespaces to match your folder structure from Solution Explorer
- Configure background code analysis from Solution Explorer
- Nullable reference types is now enabled by default for new .NET projects
- C# 10.0 File-scoped namespace refactoring
- Navigate to decompiled sources is now on by default
- Refactoring to prefer null check over type check
- XML comments will now automatically generate an
<exception>tag when a method explicitly throws exceptions - Inheritance Margin is now enabled by default
- Reduced UI freezes and improved performance on solution startup
- Faster semantic colorization up to 2x in some solutions
- F7 (view code) support in Razor files
- Snippet support in razor files which will complete a snippet session with a single tab instead of pressing tab-tab
- Better formatting in @code blocks when there's nested HTML and Razor Components
- Hot Reload support in Razor files
- Performance improvements
- Formatting and indentation enhancements
- New Razor editor colors
- TagHelpers are now colorized and have quick info classification support and completion tooltips
- Angle brace highlighting and navigation for Razor constructs
- Comments now have auto-completion, smart indentation, auto-inclusion of commenting continuations, and block comment navigation
- Very early experimental preview of enabling running tests on remote environments such as linux containers, WSL, and over SSH connections.
- Show in Test Explorer
- New versions of the test platform starting with 17.0 will not be able to run Generic tests and Ordered tests. These specific features only shipped as part of an early version of MSTestv1 and are not included in MSTestv2. We see very low usage of these features and ordered tests is now considered contrary to best testing practices.
- Some test experiences will not be available in 17.0 including creating new TestSettings files and the TestSettings editor. Test runs will still be able to use TestSettings files, however TestSettings was replaced with RunSettings and we encourage users to migrate improved performance and functionality. Read more.
- Web Load Test and Coded UI Test support updates. Coded UI Tests and [Web Load Tests](Cloud-based load testing service end of life | Azure DevOps Blog (microsoft.com) were officially deprecated in 2019. To minimize impact to users there is minimum support for these features in Visual Studio 2022. We strongly encourage users to move off Coded UI Test and Web Load Test.
Toolbox population for UWP Extension SDKs
- UWP Extension SDKs are now required to explicitly declare the types that they wish to appear in the Toolbox by listing them in their SdkManifest.xml file. The behavior of older versions of Visual Studio is unchanged; they will ignore the list of controls in the manifest and instead dynamically enumerate the control types in the SDK's assemblies.
- We have revamped the “Trust Settings” functionality and can now show a warning whenever untrusted code (e.g. files, projects or folders) is about to be opened inside the IDE.
- Trust checks are now done at the solution folder level
- User created projects are automatically added to the trusted list
- Users can skip trust checks on temporary locations created by Visual Studio
Updates, LTSC's and Deployment
- With Visual Studio 2022, there will be multiple simultanouely supported servicing baselines that will release in the fall and in the spring. For more details, refer to Visual Studio Release Rhythm documentation and the Visual Studio 2022 Product Lifecycle.
- The new installer that comes with Visual Studio 2022 now has the capability of configuring where the Visual Studio product should get its updates from. This allows you to choose updates from a different LTSC, or, if you're in a managed enterprise environment, you can configure the client to get its updates from a layout. The ability to configure the source for updates is new functionality that comes with the Visual Studio Installer, and thus the behavior is applicable to downlevel versions of Visual Studio too, such as Visual Studio 2019. For additional information about configuring the update channel, refer to the Update Visual Studio documentation. For additional information about making this work for network layouts, refer to the Visual Studio Administrators Guide.
- IT Administrators can now report issues without having Visual Studio installed.
- The default icons have been updated and refreshed.
Web Tools
- The Publish summary page now has actions to start / stop remote debugging and profiling under the '...' menu on the top right corner of the 'Hosting' section
- The Connected Services page now has an action to launch Storage Explorer
- The "ASP.NET Core Empty" template that comes with .NET 6 is using the new 'minimal APIs' paradigm for which we have started to add support
- Azurite will be used for local emulation of Azure Storage instead of the older and no longer actively developed Azure Storage Emulator.
- You can add authentication to your ASP.NET Core application using Microsoft identity platform through the Connected Services experience in Visual Studio.
WPF XAML Designer for .NET Framework
- The current WPF XAML Designer for .NET Framework is replaced with a new WPF XAML Designer for .NET Framework, based on the same architecture used for the WPF XAML Designer for .NET (.NET Core). The Visual Studio experience will look the same, but third-party control vendors need to support the new extensibility model since the previous model based on
.design.dllandMicrosoft.Windows.Design.Extensibilityis deprecated. If you already created a.designtools.dllextension for .NET (.NET Core), that same extension will work for the new WPF XAML Designer for .NET Framework. Please refer to the migration document below for further information about how to migrate to the new extensibility model.
- XAML Hot Reload Changes - Minor changes to in-app toolbar and settings
- XAML Live Preview is now available for WPF, UWP, WinUI and Xamarin.Forms developers running their apps in either Android Emulator or as a UWP desktop app. Live Preview captures a running applications user interface and brings it into a docked window within Visual Studio. This makes it easier to use XAML Hot Reload to change the app while seeing those changes inside Visual Studio itself, without the need to tab back and forth between the running app and Visual Studio while making live XAML code changes.
For more information click on the link above.
XAML Sample Data
- Design-Time Sample Data will now be added by default when creating DataGrid, ListBox, and ListView controls from the toolbox in WPF applications. To disable this behavior, uncheck ‘Automatically add sample data on element creation’ under Tools -> Options -> XAML Designer.”
- To learn more about Sample Data , please visit the Sample Data documentation.
Improved XAML binding experience
- We’ve made a bunch of improvements to make data binding fast and easy, such as quick access to the Data Binding dialog from Property Inspector, ability to set binding from Quick Actions, ability to choose the property to bind to inside the Data Binding Dialog.
For more information click on the link above.
Known Issues
Mobile Development with .NET
Python Tooling
C++ IntelliSense
Details of What's New in this Release of Visual Studio 2022 version 17.0.0
Debugging & Diagnostics
- Attach to process dialog improvements
- New parent / child process list view via toggle at the bottom of the window
- Selection of view should be persisted.
- Left keypress in keyboard navigates to parent process in parent/child view.
- All columns should be sortable like the original view.
- The New Command Line column is available in both views.
- App pool name is shown in the "Title column" for w3wp processes

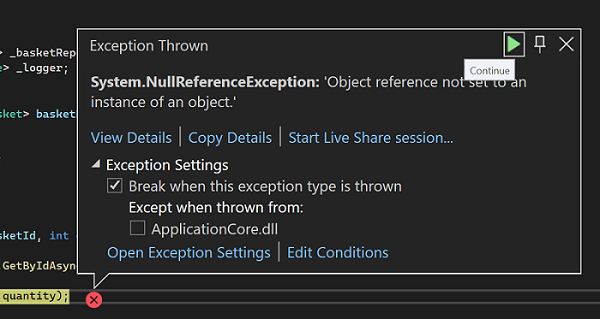
- Added an Exception Helper in catch block. This will displays the exception helper with the relevant exception info when a managed step causes an exception to be thrown, and the step completes in a catch block.
- A new 'continue' button: showing the exception helper on 'caught' exceptions.
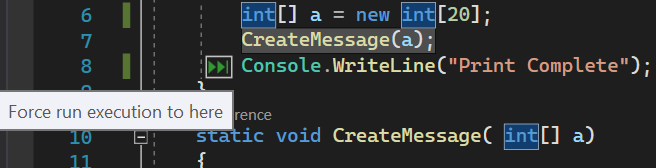
- We added an option to Force run to click that will run the debugger until the selected cursor position is reached while ignoring all the breakpoints in between.
- You can execute this by clicking "Force Run to Click" from right-click menu on the desired line of code.
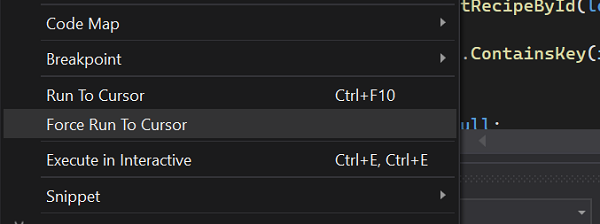
- When the application is in debugging mode, you can also execute the "Force Run to Click" by clicking the green glyph that appears next to a line of code when the mouse has hovered while holding the SHIFT key.
- Memory Dump Diagnostic Analysis
- We have improved the analyzer engine to find more sync-over-async issues in ASP.NET Core memory dumps.
- Find what parts of your code are consuming the most CPU resources by reviewing the top 5 threads by CPU time.
- Review the entire managed heap for signs of memory pressure in Generation 0, 1, 2 and the Large Object Heap.
- If you have a crash dump you can quckly find the second chance exception and thread that caused your application to crash.
- Struggling to form a diagnostics hypothesis? When the exact cause of a crash or hang is not well known you can use Exception analyzer to quickly find and review all exceptions on the heap.
- For those moments when memory analysis is important we have improved the heuristics of Finalizer queue analyzer. We now focus on your code and exclude objects managed by the .NET framework.
Dependent Breakpoint
This is new breakpoint that lets user to configure a breakpoint to be enabled only if another breakpoint is first hit. When debugging, Visual Studio debugger will only pause application on the Dependent breakpoint if the prerequisite breakpoint is hit. You can convert any breakpoint to Dependent breakpoint by enabling "Only enable when followwing breakpoint is hit" checkbox from the settings window and selecting the prerequisite breakpoint from dropdown on which you want your configure your Dependent breakpoint.

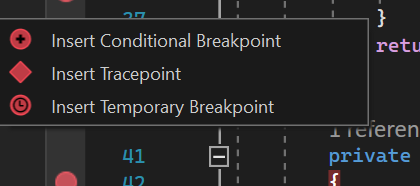
Breakpoint Gutter improvements
We added new breakpoint glyph to indicate location where the user can set a breakpoint.
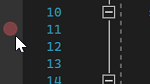
Right click on that breakpoint glyph will give new context menu with options; which gives a quick way to create advance breakpoints(Conditional breakpoint, Tracepoint and Temporary breakpoint) in fewer clicks.
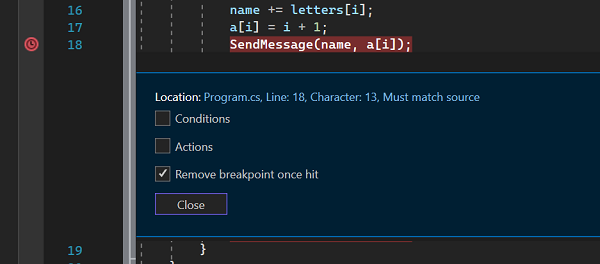
Temporary Breakpoint
This is new breakpoint that lets user break the code only once. When debugging, Visual Studio debugger will only pause application runtime once for this breakpoint and removes it immediately after it has been hit. You can convert any breakpoint to temporary breakpoint by enabling "Remove breakpoint once hit" checkbox from the settings window. Alternatively, you can use the new right click context menu from the breakpoint gutter to set this breakpoint.
Drag and Drop Breakpoint
We have added the drag and drop gesture for the breakpoints. You can now hold your breakpoint and released on the desired line of code to move the breakpoint from one location to another. It works for our advance breakpoint as long as the actions/condition variables are within the context.
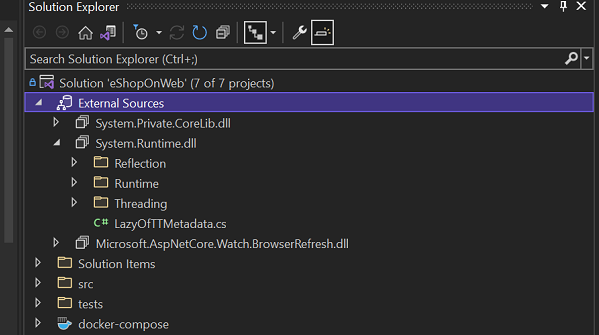
External Sources Node in Solution Explorer
We added a new "External Sources" node in Solution explorer. This will currently only appear while debugging and will show sources for managed modules with symbols loaded that contain Source Server or Source Link info.
While debugging, any loaded managed symbol file (.pdb) that has Source Server information present will appear under this node. You can browse for files like any other solution explorer folder or double-click an item to download the file from Source Server and open it in the VS Editor.
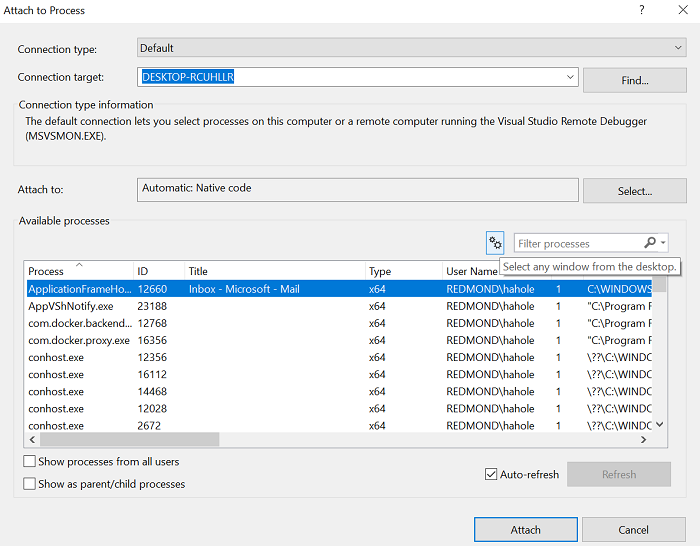
Attach to process Dialog Improvements
We added a new auto-refresh checkbox in the attach to process dialog , which when check refreshes the process list automatically with the available processes. New “Select any window from desktop” option from the attach to process dialog, lets user pick any running window from the desktop and attaches to its associated process for debugging.
Memory Dump Diagnostic Analysis
Finding the root call frames when a Stack Overflow Exception occurs can be difficult and time consuming. Our latest analyzers presents a convenient view of the Call Stack and removes repetititive and noisy frames for faster problem analysis.
Personalization
Convert VS Code Themes to Visual Studio Themes
We've created a Theme Converter tool that can convert VS Code themes to work in Visual Studio. Try it here.
New Visual Studio Theme Pack
The default VS Code themes are now available as a Visual Studio Theme Pack. Take a look at the theme pack here.
Sync Theme to Windows OS
We added the capability to sync your Visual Studio theme to your Windows theme, so that your theme can adjust based on the amount of ambient light available. To enable this, navigate to Tools > Theme > Use System Setting.
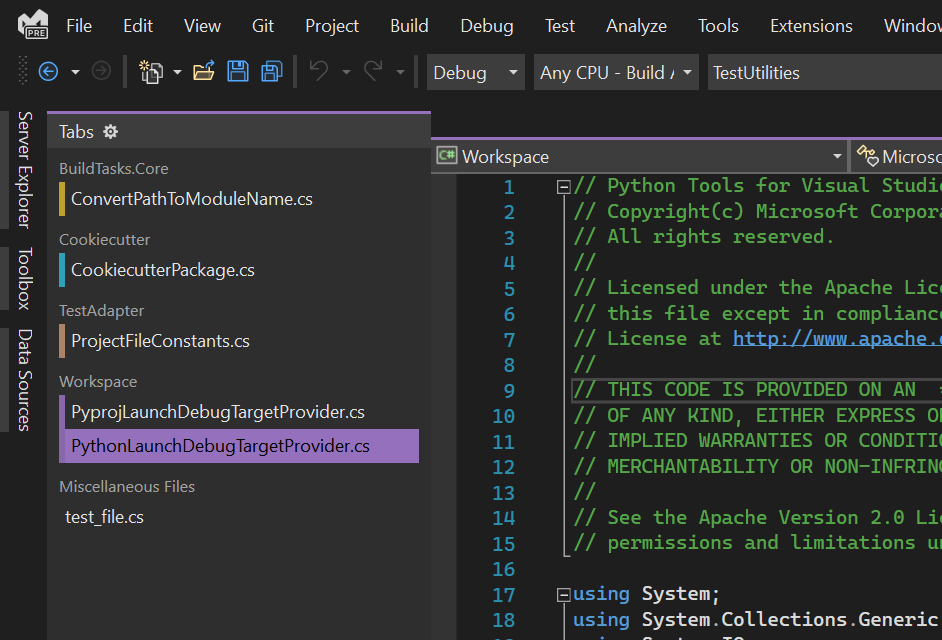
Color Tabs
To enable color tabs, navigate to Tools > Options > Tabs & Windows, and enable Colorize Tabs.
Editor
Subword navigation
Ctrl+Alt+Left Arrow and Ctrl+Alt+Right Arrow will now navigate by subword. For instance, the string "HelloWorld" identifies "Hello" and "World" as subwords. Enabling Subword navigation in Tools > Options > Text Editor > General will cause word related commands (e.g. TransposeWord) to interact with subwords.
Autosave
Under Tools > Options > Environment > Preview Features, autosave is now available. If enabled, when the Visual Studio application loses focus (e.g. another window gets focus), all dirty documents will be saved to disc if possible. If any file cannot be saved, it will remain dirty until the user explicitly saves it (with the Save or Save As... commands).
Multi-caret copy\paste experience
We improved the multi-caret copy and paste experience. Previously, pasting multiple lines into multiple carets resulted in the entire clipboard being duplicated at each caret. Now, pasting multiple lines into the same number of carets will insert each line to a respective caret. To use multi-caret press Alt+Shift+mouse click or Alt+Shift+. and use Ctrl+Shift+arrow key to expand selections. Next, press Ctrl+C to copy the text in multiple selections. Use Alt+Shift+mouse click to create multiple carets for each line that you would like to paste in desired locations. Finally, press Ctrl+V to paste each line at its own caret.
![]()
Additionally, you can use Alt+Shift+up or down arrow key or Alt+Shift+mouse drag to select with multiple carets. Previously, these gestures created box selection. Now, box selection transforms into multiple carets. This method is easier and faster than having to click in precise locations to insert individual carets. If you prefer to keep using box selection with Alt+Shift+arrow keys and Alt+Shift+mouse drag when expanding multi caret selection go to Tools > Options > Text Editor > Advanced and select Use box selection.
![]()
Extensibility
The Microsoft.VisualStudio.LanguageServer.Client is introducing a new way to customize notifications when a language client fails to initialize.
The initialization task will now be tracked by the Task Status Center (TSC). If the initialization task fails, users may go to the TSC get more info on what went wrong. Language clients will now be able to customize the message shown to the user providing information on what this failure represent to them and possible actions to take to fix it. In order to do so we are introducing a new set of APIs in the ILanguageClient interface. These new APIs would cause a breaking change in the ILanguageClient interface, so language extensions will require to reference the new package in order to work in Visual Studio 2022.
The following are the new APIs:
- ShowNotificationOnInitializeFailed property - Boolean property that will determine whether the language server want us to show a bubble to notify the user about the failure like this:
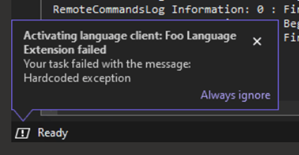
Recommendation is to set this property to true only if the failure drastically affects the user experience for the project they are currently working on.
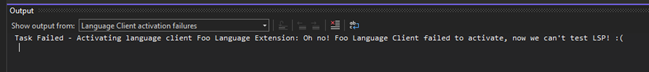
- OnServerInitializedFailedAsync method - This method will be invoked when the initialization of the language client fails. We will provide a LanguageClientInitializationInfoBase object with information on how the failure occurred so that the language client can notify the user of the failure on its own way or provide a customized message with the context of the failure. If the message is provided, it will be shown in the Output window of Visual Studio.
JavaScript/TypeScript
There is now support for a new JavaScript/TypeScript project type that allows you to create standalone Angular, React and Vue projects in Visual Studio. The projects will be created using the framework cli tools you have installed on your local machine. This also means that the template version is based on the cli versions you have on your local machine.
Within these new projects, you will be able to run unit tests and integrate them with ASP.NET Core API projects. Documentation can be found here
- We have released a new JavaScript/TypeScript project type that builds standalone JavaScript/TypeScript projects with additional tooling. Read more about it here
- NPM GUI available, so you can now download NPM modules the same way you download Nuget packages in the new JavaScript/TypeScript projects
Hot Reload Experience for .NET & C++ Developers
Earlier this year we announced .NET Hot Reload, an ambitious project to bring Hot Reload to as many .NET developers as possible. We started this journey with a first preview available in Visual Studio 2019 and promised a lot more to come in Visual Studio 2022 where the full experience would ship. Today I am excited to share the details of what we’ve completed in Visual Studio 2022 GA release.
For anyone new to Hot Reload, here is a quick introduction. The Hot Reload experience in Visual Studio works for both managed .NET and native C++ apps. Regardless of the type of app you’re working on, our goal with Hot Reload is to save you as many app restarts between edits as possible, making you more productive by reducing the time you spend waiting for apps to rebuild, restart, re-navigate to the previous location where you were in the app itself, etc.
We accomplish this by making it possible for you to edit your applications code files and apply those code changes immediately to the running application, also known as “Hot Reload”. Once those changes are applied, simply re-execute your code again by taking an action in the app itself (or through some sort of timer, etc.) and see the changes immediately, no pausing of the app through breakpoints required!
If you want to see some live demos of this feature you can check out one of these videos:
Hot Reload User Experience in Visual Studio
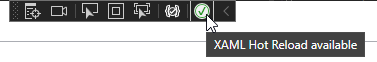
The Hot Reload experience for both .NET and C++ developers in Visual Studio 2022 has also undergone major improvements. The toolbar now has the target implementation of our “Hot Reload” button with improved look and more functionality.
The first thing you will notice is the new drop-down style button with a new icon. The command is renamed from “apply code changes” (from early previews) to “Hot Reload”.
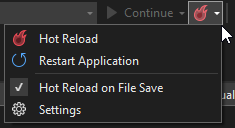
Expanding the buttons reveals quick access to features such as restart running application(s), an opt-in toggle for Hot Reload on save, and quick access to the new settings panel.
Here are more details on each of the new features:
- Restart Applications Easily: You can now easily restart your running application if a rude edit needs to be applied through a rebuild regardless of whether you started your app using the debugger or if you started it without the debugger (NEW for .NET 6 apps!).
- Hot Reload on Save: In earlier preview releases you could only apply Hot Reload changes on save in ASP.NET projects, for every other project you had to explicitly click the Hot Reload button. In the final release it is now possible to Hot Reload using the save key for any project type. This option is opt-in, but once enabled it will apply to all your future Visual Studio sessions unless you turn it off.
- Easy Settings Access: We’ve added a Hot Reload options panel to give you more control when Hot Reload is enabled/disabled. You can reach these settings in Visual Studio “Options > .NET / C++ Hot Reload” or through the Hot Reload buttons dropdown menu by clicking on Settings.
We’ve also added an improved rude edit dialog that is available when running your .NET app without the debugger.
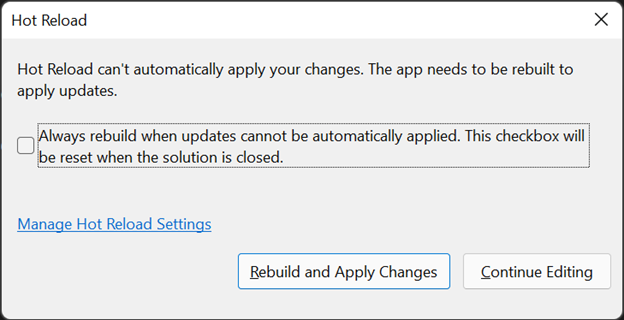
This new dialog has multiple improvements such as:
- A Visual Studio session wide opt-in option to Rebuild and Apply Changes on each Hot Reload rude edit. Once checked this applies to all future rude edits until Visual Studio is restarted
- A rebuild and apply your code changes command that can be accomplished with a single click, instead of multiple manual steps
- And easy access to settings
The dialog also lets you continue editing if you don’t want to take any automated action as was previously possible.
There is one known limitation, this new dialog won’t be available in the GA release when using the debugger, but the work to make it available in this scenario will be completed in a future update.
Support for C++ apps
When using Visual Studio 2022 and starting your app with the debugger It is now possible to Hot Reload a native C++ application when running under the debugger (F5) using the ‘Hot Reload’ button. Hot Reload is also supported for apps built using CMake and OpenFolder projects.
This experience is powered by native Edit and Continue, for supported edits see our documentation.
Supported .NET App Frameworks & Scenarios
Since we announced Hot Reload back in May 2021 a very common question from .NET developers has been “will Hot Reload work with my .NET apps framework/version combination?”. We’ve made huge progress to make the answer YES in most situations, here are the highlights.
- When using Visual Studio 2022 and starting your app with the debugger the basic Hot Reload experience works with most types of .NET apps and framework versions, this includes .NET Framework, .NET Core and .NET 5+ (for both C# and VB.NET as applicable). The type of apps that are supported include web (code-behind changes), desktop, mobile, cloud and other project types. The key rule here is if you’re using the debugger assume Hot Reload is available to you and give it a try!
- When using Visual Studio 2022 but not using the debugger (for example using CTRL-F5 to start the app) Hot Reload is now available even without the debugger when targeting most types of .NET 6 apps. This means that apps not targeting .NET 6 (.NET 5 or below) will not support the “no debugger” scenario and must use the debugger to get Hot Reload support.
- When using Visual Studio 2022 with a .NET 6 app, the most type of scenarios are supported. This is not limited to the new “no debugger” feature mention above. It also includes other new capabilities such as support for Hot Reloading Blazor projects and more generally editing Razor files in any ASP.NET Core apps and CSS Hot Reload. Using both Visual Studio 2022 and apps that target .NET 6 together will definitively give you the most powerful Hot Reload experience and we hope you will give it a try.
Below we’ll expand on the above summary and dive into more details.
Visual Studio 2022 with a .NET app when using the debugger
When using Visual Studio 2022 and starting the app with the debugger, Hot Reload works with most app frameworks, including typical app types such as Console, Windows Forms (WinForms), WPF, UWP, WinUI 3* and most types of ASP.NET web projects (for code-behind edits) including ASP.NET MVC, Web API and even older Web Forms projects. This list is also just an example. The real answer is anywhere you have .NET and you’re using the Visual Studio managed debugger, you should get basic Hot Reload support.
This means that even projects such as Azure Functions will work great in this scenario. We encourage you to try your combination and let us know if you find any problems.
*WinUI 3 by default uses mixed mode debugging which does not support Hot Reload. You can modify this in project settings by enabling the Managed Debugger which will enable Hot Reload to work properly.
When using Visual Studio 2022 with a .NET app, but not using the debugger
Hot Reload is now available without the debugger when targeting most types of .NET 6 apps, including project types such as Console, WPF, Windows Forms (WinForms), ASP.NET Core MVC, Web API and Blazor. We know some developers have good reason or preference to start their apps without the debugger and we hope this extra feature will give them value for little to no impact on startup time.
This feature is exclusive to .NET 6+ and those apps not targeting .NET 6 (.NET 5 or below) will not support the “no debugger” scenario and must use the debugger to get access to Hot Reload functionality.
Also be aware that not all project types will be supported for the “no debugger” scenario in our first release. Specifically:
- UWP apps are not supported for Hot Reload without the debugger, this is by design and there are no current plans to improve this.
- Xamarin.Forms apps targeting iOS & Android don’t support .NET Hot Reload (regardless of if you are starting your app with or without the debugger), but will continue to support XAML Hot Reload
- .NET MAUI apps in the immediate future will not support the no debugger scenario, but will support .NET Hot Reload through the debugger
When using Visual Studio 2022 with a .NET 6 app, the most type of scenarios are supported
Developers who are able to use both Visual Studio 2022 and work on apps that target .NET 6 will get the benefits of the most polished and capable Hot Reload experience.
Highlights of what is supported:
- Blazor apps (Server and WebAssembly*)
- Razor file editing in both Blazor and regular ASP.NET Core websites
- CSS Hot Reload
- Ability to get Hot Reload support when running apps without the debugger (as described above in more detail)
Developers targeting .NET 6 will continue to get more improvements in future Visual Studio 2022 updates and .NET feature band and major releases. We’re just getting started!
*In Visual Studio 2022 GA release Hot Reload support for Blazor WebAssembly when using the Visual Studio debugger isn’t enabled yet. You can still get Hot Reload If you start your app through Visual Studio without the debugger, and we are working to resolve this in a future Visual Studio update.
Supported ASP.NET Core Scenarios
The basic Hot Reload experience is now broadly supported for many ASP.NET scenarios. The most widely available feature is the ability to change code-behind and other .NET class files for most types of web applications. This feature works while using the Visual Studio debugger and is present anywhere Edit and Continue was previously available.
For those ASP.NET Core developers who are targeting .NET 6 there are additional capabilities not available for lower versions of .NET, this includes improvements such as:
- CSHTML: Editing a Razor CSHTML file now supports many types of edits.
- Browser Refresh: Editing a razor file will now automatically refresh the changes in your web browser when debugging. This was previously only available when starting the app without the debugger.
- CSS Hot Reload: It is now possible to change CSS files while the app is running, and changes will be applied immediately to the running app as you type.
- No Debugger: You will now get Hot Reload support when using Visual Studio to start your web app without the debugger (CTRL-F5).
Note: When working on a Blazor Wasm app and using Visual Studio 2022 (17.0), Hot Reload for razor pages only works when launching apps without the debugger. We will be adding debugger support in a future update.
Supported .NET Edits
The .NET Hot Reload experience is powered by the Edit and Continue mechanism and we’ve made improvements to support additional types of edits that go beyond what was originally possible in previous versions. Improvements include:
- Adding, updating or deleting Custom Attributes
- Adding or updating Record structs
- Adding or updating #line directives
- Editing Switch expressions
- Editing files with #line directives, including changes to the directive itself
- Editing top-level statements
- Editing code that uses any of the new C# 10 features, such as global using directives, file scoped namespaces, improved lambdas and parameter-less struct constructors
- Renaming Lambda parameters
- Renaming parameters of existing methods
The above improvements are available to both Hot Reload and the Edit and Continue experiences.
Additional Updates
- Hot Reload and Edit and Continue with multiple processes: It is now possible to reliably use both the Hot Reload and Edit and Continue experiences when attached to multiple processes. Previously this capability was not fully supported and did not always work properly, this has now been corrected.
- Updated error/warning messages: We’ve updated many error/warning messages to be clearer when the messages applies to both EnC and Hot Reload. We did this by making the messages more generic so that edit and continue terminology is not used during Hot Reload operations
- Faster Unit Testing of .NET apps: Hot Reload technology can now be used as an experimental feature to speed up unit testing when targeting .NET 6. For more information see the testing section of these release notes
Unsupported .NET Scenarios
Even in the final release there will still be some unsupported scenarios that you should be aware of:
- Xamarin.Forms apps won’t support .NET Hot Reload in iOS and Android scenarios. You will get some Hot Reload when targeting a UWP app. This is by design, and we don’t expect to make any further improvements. (Note: XAML Hot Reload will continues to be available and supported for Xamarin.Forms customers on the latest SDK)
- .NET MAUI apps are not supported in this release, for working with .NET MAUI and Hot Reload please see Visual Studio 2022 Update 1 Preview 1 release notes for details.
- Apps built using F# or those targeting .NET Native will not support Hot Reload.
.NET Productivity
The sync namespaces refactoring is now available in the (right-click) menu of a project or folder in Solution Explorer, allowing you to easily synchronize namespaces to match your folder structure.
Background code analysis configuration is now available in the Solution Explorer (right-click) menu. Right click on the solution node in Solution Explorer and select Analyze and Code Cleanup. Next, select Set Analysis Scope to configure the scope for background code analysis.
- There is now a refactoring that introduces a parameter which will move an expression from a method implementation to its callers by adding a new parameter. Place your cursor on the line containing the expression or highlight the expression. Press (Ctrl+.) to trigger the Quick Actions and Refactorings menu. Select Introduce parameter for {0} or Introduce parameter for all occurrences of {0}. Both options will have three flyout options to either (1) insert the updated expression at all the call sites, (2) extract and create a new method that returns the expression and adds an argument at the call sites, or (3) create an overload of the method that contains the expression and calls upon the original method.
- There is a new command called Track Value Source that allows you to perform data flow analysis to determine how certain values might have passed at a given point and where it might be passed. Right click on any given member and select Track Value Source from the right click menu.

- The Value Tracking window will open allowing you analyze results:
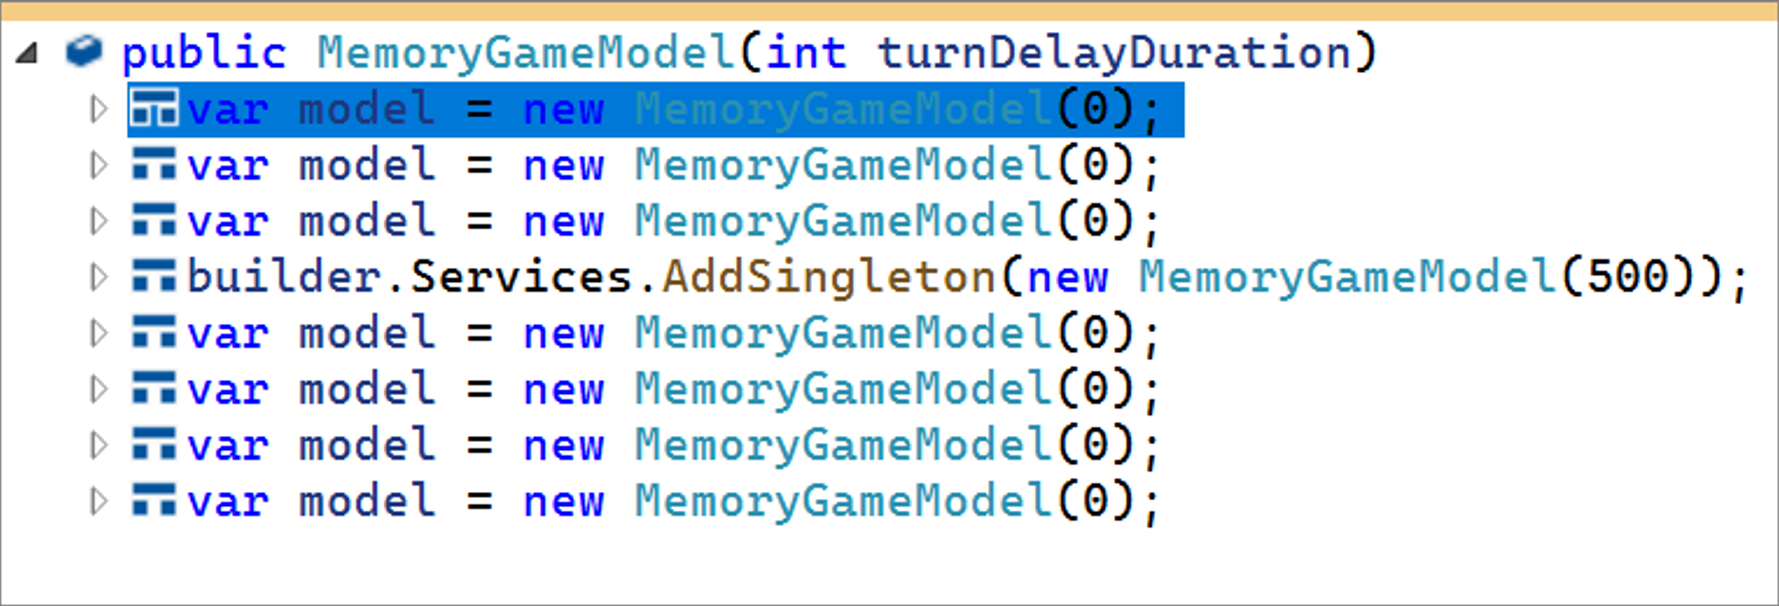
- We added an option to underline variables that are reassigned. This is off by default so you will need to enable it in Tools > Options > Text Editor > C# or Basic > Advanced and select Underline reassigned variables.

- We added a search option in the Generates Overrides dialog, allowing you to quickly search and select members to override.

- Quick Info for XML <code> tags now preserve white space and CDATA blocks. Hover your cursor over the element. Quick Info will then display the supported styles from the XML comments above your code.
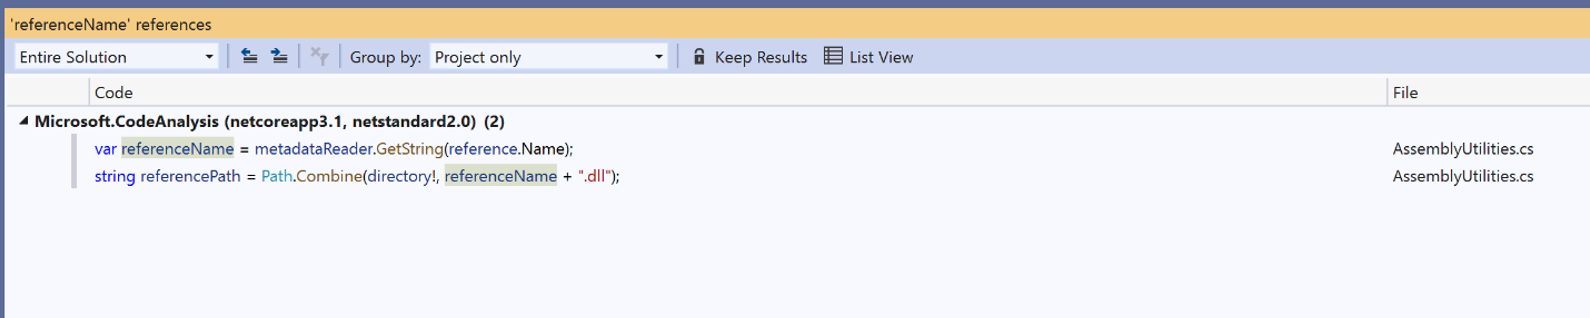
- The Find all References window will now group multi-target projects helping reduce visual noise.
- There is now a refactoring that removes repetitive types in Visual Basic.
- Go to Implementation will no longer navigate to members with abstract declarations that are also overridden.
C# Language Tooling
In C# 8.0 we introduced nullable reference types allowing you to declare whether null is expected. To use nullable reference types you either need to add the <Nullable>enable</Nullable> element to your project file or add the #nullable enable pragma to every source file in your project. To help streamline this process we now automatically include the <Nullable>enable</Nullable> for new .NET projects.
In C# 10.0 we are introducing File-scoped namespace giving you the option to not nest class definitions within a namespace. We now have a refactoring to convert a namespace to a file-scoped namespace. In-order to use file-scoped namespace you will first need to add the <LangVersion>preview</LangVersion> element to your project file. Next, place your cursor on a namespace. Press (Ctrl+.) to trigger the Quick Actions and Refactorings menu. Select Convert to file-scoped namespace.

There is now a refactoring to prefer is not null over is object when applied to value types. To use this new refactoring place your cursor on a type check. Press (Ctrl+.) to trigger the Quick Actions and Refactorings menu. Select Prefer null check over type check.
Navigate to decompiled sources
Navigate to Decompiled Sources in now on by default allowing you to navigate to declarations of library types. Navigate to Decompiled Sources is available when you invoke Go to Definition on a library symbol in your source code and on decompiled sources.
Editor Enhancements
XML comments will now automatically generate an <exception> tag within a <summary> tag allowing you to add a description when a method explicitly throws exceptions.
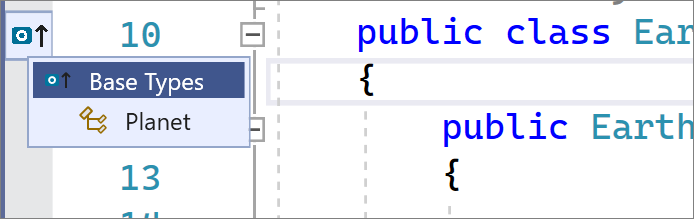
In Visual Studio 2019 we released Inheritance Margin which adds icons to the margins representing your code's implementations and overrides. Clicking on the inheritance margin icons will display inheritance options that you can select to navigate to. In this release Inheritance Margin is enabled by default. To disable Inheritance Margin go to Tools > Options > Text Editor > C# or Basic > Advanced and deselect Enable Inheritance Margin.
Programming Languages
C# 10
- Record structs and
withexpressions on structs (record struct Point(int X, int Y);,var newPoint = point with { X = 100 };). - Global using directives:
global usingdirectives avoid repeating the sameusingdirectives across many files in your program. - Improved definite assignment: definite assignment and nullability analysis better handle common patterns such as
dictionary?.TryGetValue(key, out value) == true. - Constant interpolated strings: interpolated strings composed of constants are themselves constants.
- Extended property patterns: property patterns allow accessing nested members (
if (e is MethodCallExpression { Method.Name: "MethodName" })). - Sealed record ToString: a record can inherit a base record with a sealed
ToString. - Incremental source generators: improve the source generation experience in large projects by breaking down the source generation pipeline and caching intermediate results.
- Mixed deconstructions: deconstruction-assignments and deconstruction-declarations can be blended together (
(existingLocal, var declaredLocal) = expression). - Method-level AsyncMethodBuilder: the AsyncMethodBuilder used to compile an
asyncmethod can be overridden locally. - #line span directive: allow source generators like Razor fine-grained control of the line mapping with
#linedirectives that specify the destination span (#line (startLine, startChar) - (endLine, endChar) charOffset "fileName"). - Lambda improvements: attributes and return types are allowed on lambdas; lambdas and method groups have a natural delegate type (
var f = short () => 1;). - Interpolated string handlers: interpolated string handler types allow efficient formatting of interpolated strings in assignments and invocations.
- File-scoped namespaces: files with a single namespace don't need extra braces or indentation (
namespace X.Y.Z;). - Parameterless struct constructors: support parameterless constructors and instance field initializers for struct types.
- CallerArgumentExpression: this attribute allows capturing the expressions passed to a method as strings.
See the C# language feature status and breaking changes for more details.
Razor (ASP.NET Core) Editor
- There is now Hot Reload support in Razor files.
We made significant improvements to performance to the Razor Editor.
We enhanced formatting and indentation making it more reliable and significantly faster.
We added new Razor colors! You can customize these colors in Tools > Options > Environment > Fonts and Colors.
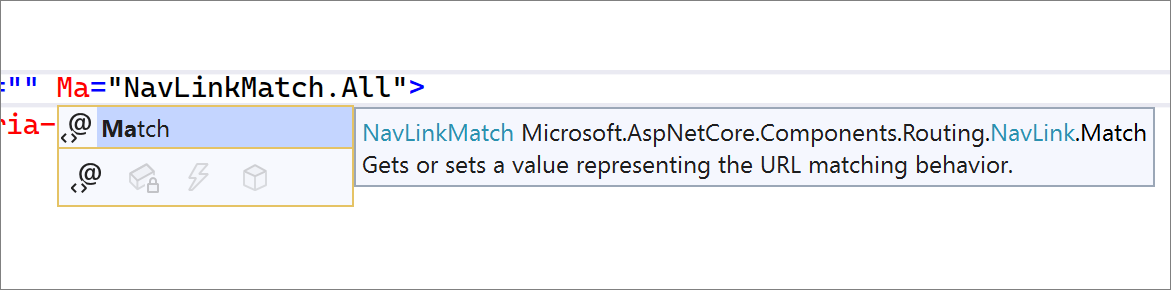
TagHelpers are now colorized and have classification support in Quick Info and IntelliSense completion tooltips.
We enhanced the angle branch highlighting and navigation for Razor constructs.
Comments now have auto-completion, smart indentation, auto-inclusion of commenting continuations, and block comment navigation.
Remote Testing Early Experimental Preview
We have a very early experimental preview of enabling running tests on remote environments such as linux containers, WSL, and over SSH connections! While this is a very valuable capability, we ask for your patience as this feature is still in a very early experimental state as we collect feedback. You may not experience the smoothness you normally get as you may imagine there are a lot of corner scenarios in how we can communicate and manage a connected environment from Visual Studio. Here are some requirements for using this experimental version of remote testing:
- You need to install the necessary dependencies in your target environment. This means if you want your tests targeting .NET 3.1 to run in a linux container, you need to make sure the container has .NET 3.1 installed via your Dockerfile. Someday we’d love to create an install experience that enables smooth acquisition of any of your test dependencies, but for now we are leaving the bulk of the provisioning of the environment up to the user’s specification.
- Plan to monitor your connection status to the remote environment via the Output->Tests pane. For example, if the container was stopped a message will appear in Output->Tests pane. We may not detect all scenarios so plan to check your output if it looks like the connection was lost. Especially if the Output pane is not set to "Test", you may not immediately see the message. We are still experimenting with the best notification model when connections are lost so feedback is very welcome! If it does appear the connection was lost, you can use the remote test environment drop down in the Test Explorer to set the connection back to your local environment and then select the remote environment again to reinitiate the connection.
- The experimental preview is scoped to only .NET tests for now. We are aware of the interest in supporting C++ remote test experiences and we hope to provide that as well eventually.
How can I try out remote testing?
- Official docs will arrive after the experimental period. For now, here is what you need to get started testing it out.
- Environments are specified using
testenvironments.jsonin the root of your solution. The json file structure follows the below schema:
{
    "version": "1", // value must be 1
    "environments": [
        { "name": "<unique name>", ... },
        ...
    ]
}
- Local container connections
- To connect to a container running locally, you must have Docker Desktop on your local machine. Optionally, enable WSL2 integration for better performance.
- For a Dockerfile, the environment can be specified in
testEnvironments.jsonin the root of your solution:
For example:{ "name": "<name>", "localRoot": "<path to local environment>", // optional "type": "docker", "dockerImage": "<docker image tag>", }{ "version": "1", "environments": [ { "name": "linux dotnet-core-sdk-3.1", "type": "docker", "dockerImage": "testenv" } ] } - Here is an example of a Dockerfile for running tests targeting .NET 3.1.
FROM mcr.microsoft.com/dotnet/core/sdk:3.1 - Build your container using the following command (including the "." at the end):
docker build -t <docker image name> -f <path to Dockerfile> .
- Local WSL2 connections
- You must enable WSL2 integration on your local machine.
- The environment can be specified in
testEnvironments.jsonin the root of your solution following this schema:{ "version": "1", "environments": [ { "name": "WSL-Ubuntu", "type": "wsl", "wslDistribution": "Ubuntu" } ] }
- SSH connections
- Go to Tools > Options > Cross Platform > Connection Manager to add or remove SSH connections. Selecting "Add" will allow you to enter the host name, port, and any credentials you need.
- The environment can be specified in
testEnvironments.jsonin the root of your solution with the following:{ "version": "1", "environments": [ { "name": "ssh-remote", "type": "ssh", "remoteUri": "ssh://user@hostname:22" } ] }
- The active environment is selected via a drop down in the Test Explorer tool bar. Currently only one test environment can be active at a time.
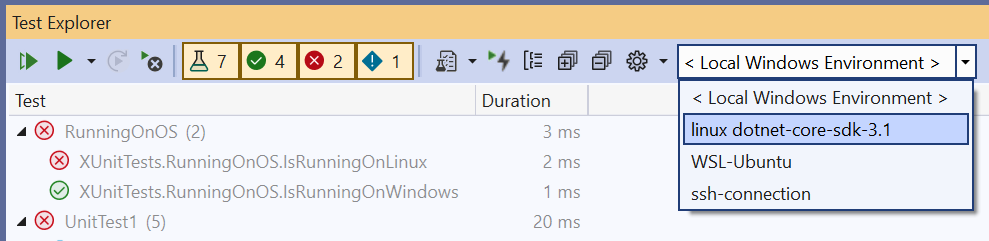
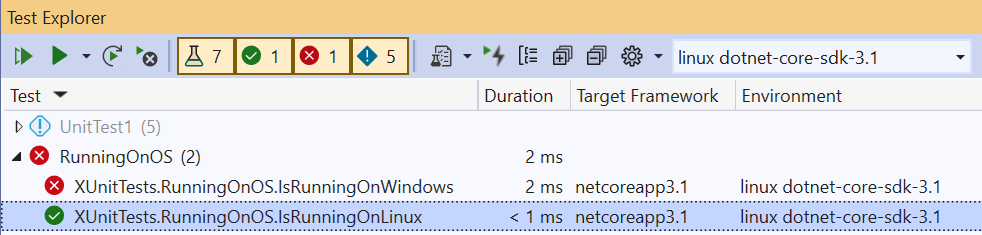
- Once an environment is selected, tests are discovered and run in the new environmentt.

You can now run and debug your tests inside the remote environment!
The Test Explorer may prompt you to install some missing environment prerequisites and attempt to install them, but ultimately, we are leaving the bulk of the provisioning of the remote environment up to the user’s specification.
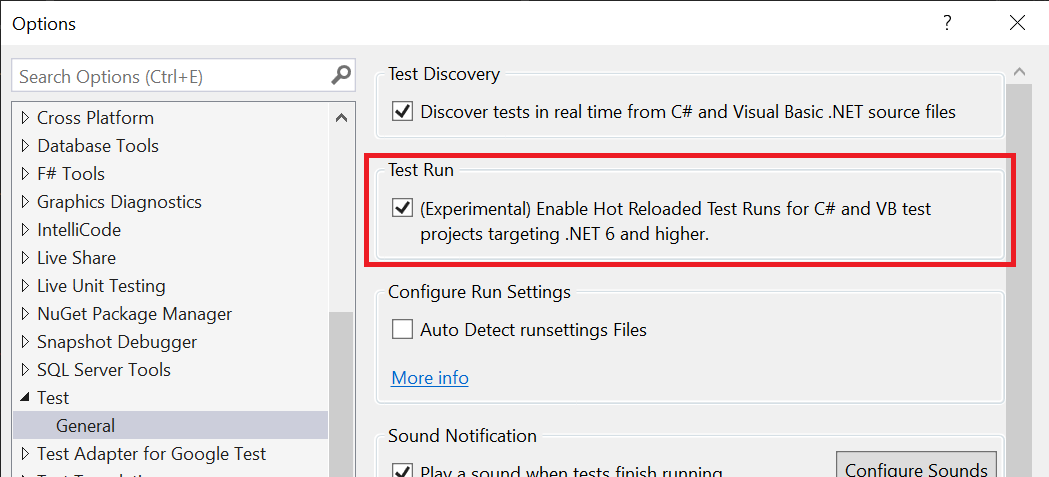
Hot Reload in Test Explorer [experimental]: It is now possible to try a new experimental feature that speeds up your test experience using Hot Reload technology behind the scenes. What this means is that after your first test run where a full build is still required, you can then make minor changes, run your tests, and all those updates will be reflected without having to do a full build again. To get started and learn more caveats see the details below:
- This experience is only available for projects targeting .NET 6 and you must opt-in by going to 'Tools > Options > Test'
When this option is enabled, your tests are being updated even with unsaved changes in the editor. We aren’t building, so the binaries on your disk in your bin folder are stale. This means you may see discrepancies between what is on disk and your test results in Visual Studio. To resolve these and before you check in, make sure you do a full build with (Ctrl+Shift+B). Any explicit build will replace the hot reload test results with the regular full-build test results.
There are certain types of edits that hot reload can’t pick up and in those cases, it will default back to the old behavior of doing a full build. Please also note that only changes in Visual Studio are being tracked, opaque cases in the editor such as changing targets may default back to requiring a full build.
Certain large changes (like renaming 1000+ method names) may take longer to hot reload than simply re-building. In these cases, a message will be printed in output prompting users to do a full rebuild rather than waiting for hot reload.
Stack traces are not yet available with hot reload in the Test Explorer. If you need to use the stack trace, we advise you to do a full build.
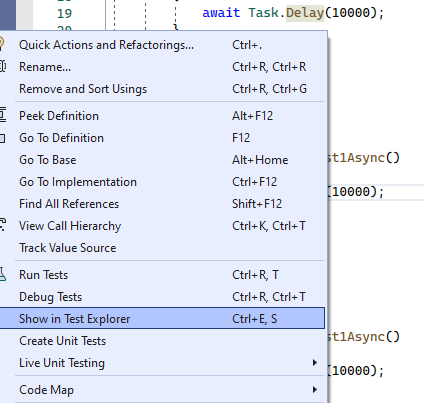
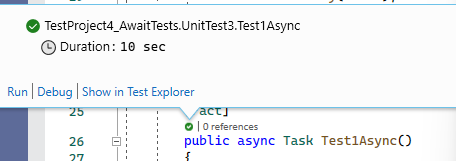
Test tools
Show in Test Explorer (Ctrl+E,S): Show in Test Explorer is the ability to jump from where your cursor is in a test method in the editor to where the test is in the Test Explorer. This may remind you of a similar feature called Sync with Active Document that keeps the document you are currently working in highlighted in the Solution Explorer. This was one of the top voted items on Developer community so thank you to all who voted and helped us prioritize this feature! Show in Test Explorer is also available from the editor right-click menu, CodeLens test glyph, and the right-click in the Solution Explorer.
Web Load Test and Coded UI Test support update: The Web Load test recorder is available in Visual Studio 2022. The Coded UI Test recorder won’t be included in Visual Studio 2022. You will still be able to run Coded UI tests and create new tests by writing code in Visual Studio 2022, but the recorder relies on 32bit dependencies that aren’t feasible to port. You can still install Visual Studio 2019 side-by-side to use the Coded UI recorder. As a reminder, Web Load Test and Coded UI Test were deprecated in 2019 and we do plan to remove them from the product when we can minimize the impact to users. We highly encourage users interested in web UI testing to adopt the new cross-platform and open source web testing framework Playwright. In addition to supporting all major browsers and much better handling of asynchronous code, Playwright also has test recording functionality built-in.
Trusted Locations
- As part of the “Trust Settings” revamp, we removed the “Mark of the web” check and added a warning dialog that’s displayed when attempting to open code (e.g. files, projects or folders) that has not been previously trusted
- Code can now be trusted at the current folder or parent folder location
- Projects created by the user are automtically added to the user's trusted locations list
- You can skip trust checks for temporary locations created by Visual Studio functionality
Before content (e.g., solution, project, file or folder) is opened inside the IDE, we'll verify if the folder location has been previously trusted.
If untrusted code is detected, we’ll show a warning dialog alerting you of the security implications and asking you to trust the code before normal IDE operation.
Note: While this feature is currently turned off by default, it can be enabled via Options > Trust Settings > Requre a trust decision before opening content
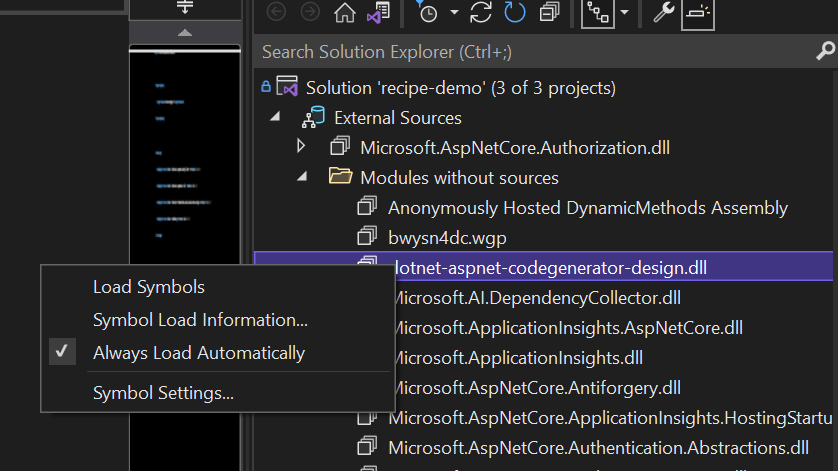
External Sources Node updates
The External Sources node in Solution explorer now also has C++ support. Additionally, we have added a new sub-node which give you all the modules with symbols are not yet loaded.
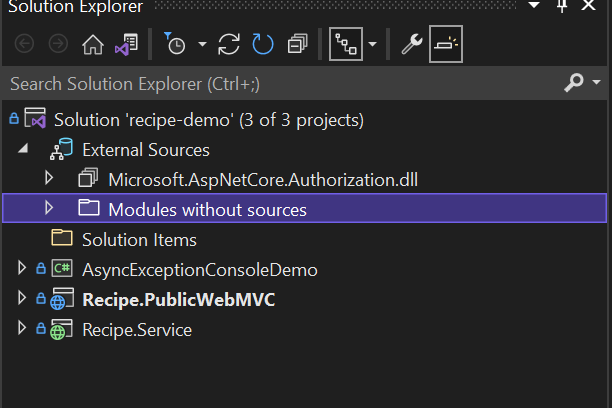
You can also use the right click context menu to load the symbols directly from the solution explorer so that the modules can appear in the external source nodes. The files the External Sources node are also sorted alphabetically now.
Updated and refreshed iconography
- As part of our goal to refresh the user interface for Visual Studio 2022, you'll find newly refreshed and updated icons throughout the IDE based on consistency, legibility, and familiarity.
![]()
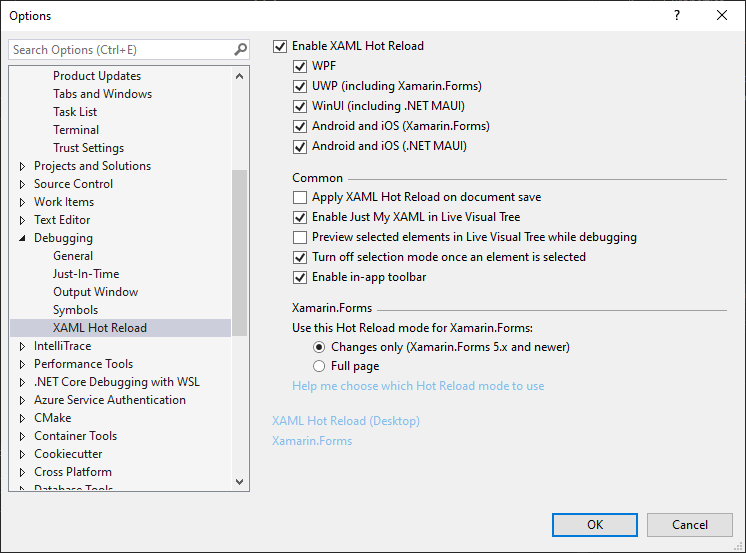
XAML Hot Reload
We've updated the XAML Hot Reload settings and in-app toolbars to provide clarity that the settings and in app experiences are related to XAML Hot Reload and not .NET Hot Reload.
We've also streamlined the settings pane to better organize common options together.
XAML Live Preview
XAML Live Preview is now available for WPF, UWP, WinUI and Xamarin.Forms developers running their apps in either Android Emulator or as a UWP desktop app. Live Preview captures a running applications user interface and brings it into a docked window within Visual Studio. This makes it easier to use XAML Hot Reload to change the app while seeing those changes inside Visual Studio itself, without the need to tab back and forth between the running app and Visual Studio while making live XAML code changes.
To get started:
- Start a supported application using the debugger
- Turn on XAML Live Preview, either through quick search by typing "XAML Live Preview" or using the in-app toolbars "Show in XAML Live Preview" button
Once the experience is started the following features will be available:
- Scrolling and Zooming: You can pan and zoom the window that captures your apps UI, this enables you to make it fit your needs to show the full app or just the parts you are trying to edit. Panning and scrolling works with a touch pad (two finger scrolling), mouse scroll wheel or CTRL + Click to drag the content around.
- Rulers: You can add one or more horizontal/vertical rulers to overlay your running app. These lines can then be moved into position using the mouse or keyboard. When moving rulers with keyboard use arrow keys for precise positioning and Ctrl + arrow key for fast positioning. You can also delete rulers by selecting them (clicking on them) and pressing the delete key.
- Element Selection & info tips: With element selection you can select the XAML element you wish to edit using the same feature you might be used to from the Live Visual Tree or in-app toolbar. Once selected you can also enable the new 'info tips' feature to get additional information about the selected element such as fonts, colors, margin/padding info and more. When using Element Selection consider enabling Preview Selected Item - either via Live Visual Tree toolbar button or Debug > Options > Hot Reload settings - to go to source XAML.
- Windows Switching: You can control which of your app windows is captured.
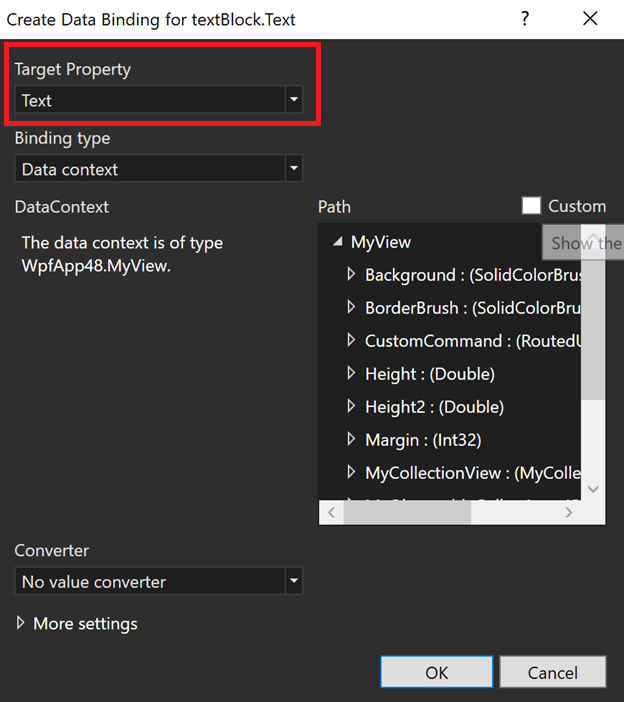
Improved XAML binding experience
- Improved data binding icons in Property Inspector. Now you can quickly access Data Binding Dialog by clicking on a “cylinder” icon next to a property, and you can clear the binding by clicking on ‘x” icon.
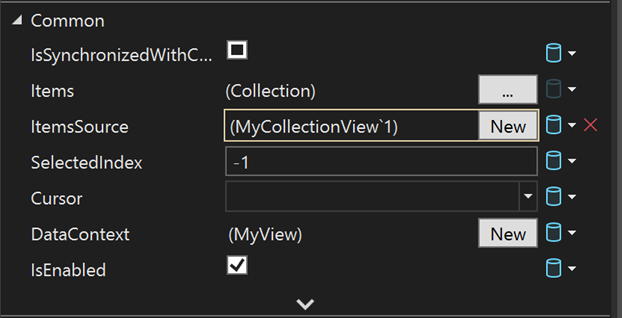
- Added Binding tab in Quick Actions so you can create bindings with just a few clicks from XAML designer.
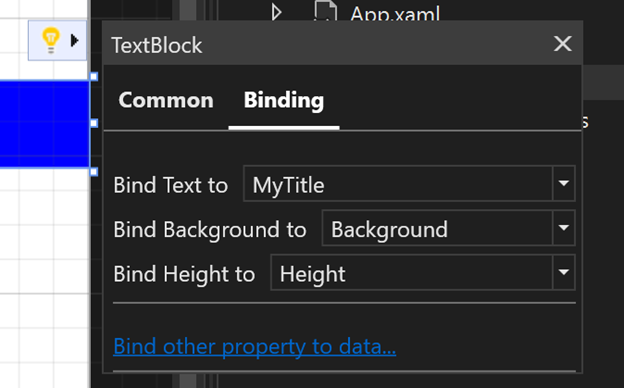
- Added Target Property combo box to the Data Binding Dialog to select property on the go.
Top Voted Issues From Developer Community
Please see our full list of Developer Community fixes in this release.
Known Issues
See all open issues and available workarounds in Visual Studio 2022 by following the below link.
Feedback and suggestions
We would love to hear from you! You can Report a Problem or Suggest a Feature ![]() by using the Send Feedback icon in the upper right-hand corner of either the installer or the Visual Studio IDE, or from Help > Send Feedback. You can track your issues by using Visual Studio Developer Community, where you add comments or find solutions. You can also get free installation help through our Live Chat support.
by using the Send Feedback icon in the upper right-hand corner of either the installer or the Visual Studio IDE, or from Help > Send Feedback. You can track your issues by using Visual Studio Developer Community, where you add comments or find solutions. You can also get free installation help through our Live Chat support.
Blogs
Take advantage of the insights and recommendations available in the Developer Tools Blogs site to keep you up-to-date on all new releases and include deep dive posts on a broad range of features.
Recommend
About Joyk
Aggregate valuable and interesting links.
Joyk means Joy of geeK