

How to Hive on GCP Using Google DataProc and Cloud Storage: Part 1
source link: https://dzone.com/articles/how-to-hive-on-gcp-using-google-dataproc-and-cloud
Go to the source link to view the article. You can view the picture content, updated content and better typesetting reading experience. If the link is broken, please click the button below to view the snapshot at that time.

How to Hive on GCP Using Google DataProc and Cloud Storage: Part 1
This tutorial shows how to perform an exploratory data analysis using Google DataProc (big data on cloud) & Apache Hive.
Join the DZone community and get the full member experience.
Join For FreeGoogle Cloud Dataproc is a managed Spark and Hadoop service that lets you take advantage of open-source data tools for batch processing, querying, streaming, and machine learning. This includes the Hadoop ecosystem (HDFS, Map/Reduce processing framework, and a number of applications such as Hive, Mahout, Pig, Spark, and Hue that are built on top of Hadoop). Hive gives an SQL-like interface to query data stored in various databases and file systems that integrate with Hadoop. Queries submitted via HIVE are converted into Map/Reduce jobs that access stored data, results are then aggregated and returned to the user or application.
For this exercise, we will be using New York city's yellow and green taxi trip data accumulated for the year 2019. Yellow Taxis are the only vehicles licensed to pick up street-hailing passengers anywhere in NYC while Green Taxis provide street hail service and prearranged service in northern Manhattan (above E 96th St and W 110th St) and in the outer boroughs. The dataset is available at the city portal.
Major steps will be as follows:
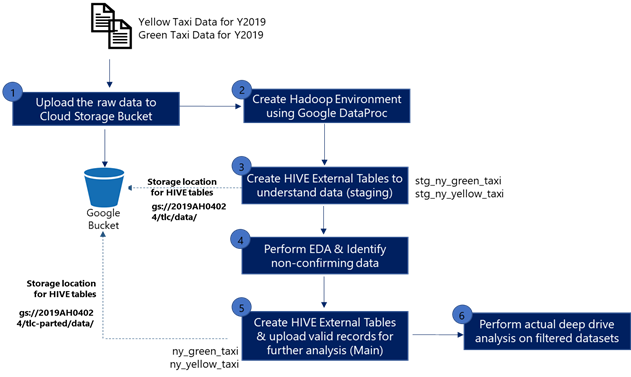
Step 1: Upload the TLC Raw Data (Green and Yellow Taxi Data for Y2019) Into Cloud Storage
First, create a suitable GCP Cloud Storage bucket and create folders to store datasets of Green Taxi, Yellow Taxi data for the year 2019 as shown below:
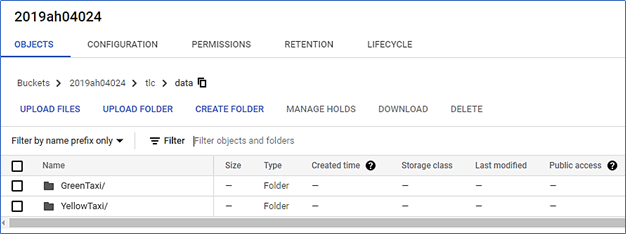
Note the cloud storage location of data files. These would be used to create external tables in the following steps:
- Yellow Taxi: gs://2019ah04024/TLC/data/YellowTaxi/
- Green Taxi: gs://2019ah04024/TLC/data/GreenTaxi/
Next, upload the datasets from the city portal into the bucket using upload files. All the 2019 yellow taxi data will be uploaded to “YellowTaxi/” and green Taxi to “GreenTaxi/” folders.
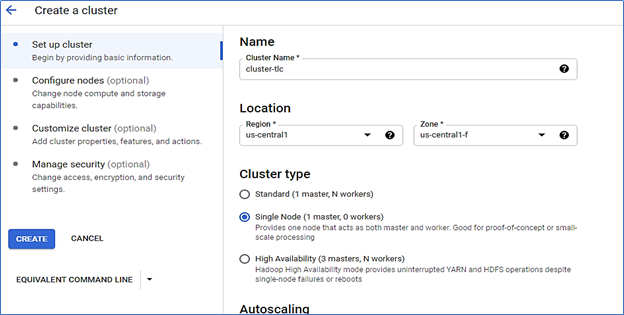
Step 2: Create Hadoop Cluster Environment Using Google DataProc
Create a Hadoop cluster in GCP using DataProc and will access the master node through the CLI. You can create clusters with multiple masters and worker nodes but, for this exercise, I have created a single node that acts both as a master node as well as the worker.
Once, the cluster is created and ready, go to "VM INSTANCES" to view master and worker VM details.
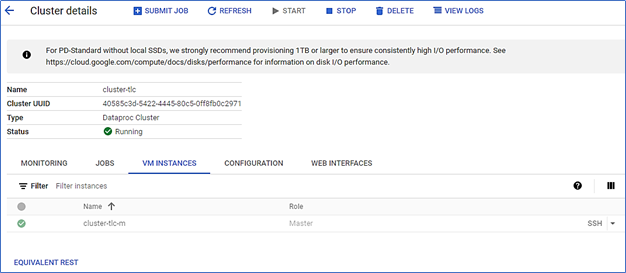
Select the master node. Click on the down arrow next to the SSH icon and select Open in a browser window from the drop-down menu. A new browser window will open and an icon will appear in the center alerting you to the SSH connection being set up. Once the SSH connection is established, the shell prompt will appear.
Run the Beeline shell using the JDBC HIVE interface. Hive runs on localhost at port 10000.
use the Google Cloud user name at the Master Node hostname (cluster-tlc-m in this example). The command line will be the following:
beeline -u jdbc:hive2://localhost:10000/default -n myusername@cluster-tlc-m -d org.apache.hive.jdbc.HiveDriverStep 3: Create HIVE External Tables for EDA (Staging Environment)
An external table is a table for which Hive does not manage storage. If you delete an external table, only the definition in Hive is deleted. In our case, even if the HIVE tables are deleted, the data still remains in cloud storage.
The data dictionary for Yellow and Green Taxis contains the fields, descriptions as well as the appropriate values to be stored. From the data dictionary files, we can notice that are 20 columns in the Green Taxi dataset while there are 18 columns for the yellow taxi dataset. So, we will create below 2 different external tables (staging environment) and point to Green, Yellow Taxi datasets by specifying the respective "location" in the cloud storage.
- stg_ny_yellow_taxi
- stg_ny_green_taxi
/*Create External table for yellow taxi*/
CREATE EXTERNAL TABLE stg_ny_yellow_taxi (
              vendor_id int,
              tpep_pickup_datetime string,
              tpep_dropoff_datetime string,
              passenger_count int,
              trip_distance double,
              rate_code_id smallint,
              store_and_fwd_flag string,
              pu_location_id int,
              do_location_id int,
              payment_type smallint,
              fare_amount double,
              extra_charge double,
              mta_tax double,
              tip_amount double,
              tolls_amount double,
              improvement_surcharge double,
              total_amount double,
              congestion_surcharge double
       )
ROW FORMAT DELIMITED
FIELDS TERMINATED BY ','
LINES TERMINATED BY '\n'
STORED AS TEXTFILE
LOCATION 'gs://2019ah04024/tlc/data/YellowTaxi/';

/*Create External table for green taxi*/
CREATE EXTERNAL TABLE stg_ny_green_taxi (
              vendor_id int,
              lpep_pickup_datetime string,
              lpep_dropoff_datetime string,
              store_and_fwd_flag string,
              rate_code_id smallint,
              pu_location_id int,
              do_location_id int,
              passenger_count int,
              trip_distance double,
              fare_amount double,
              extra_charge double,
              mta_tax double,
              tip_amount double,
              tolls_amount double,
              ehail_fee double,
              improvement_surcharge double,
              total_amount double,
              payment_type smallint,
              trip_type smallint,
              congestion_surcharge double
       )
ROW FORMAT DELIMITED
Step 4: Data Ingestion and Exploratory Data Analysis (EDA)
We will perform exploratory data analysis to get a general understanding of Yellow and Green Taxis datasets, extract basic statistics, check for data validity, and highlight any nonconforming values.
EDA1: From the data dictionary, there are two vendors (1= Creative Mobile Technologies, LLC; 2= VeriFone Inc). We will check if there are any records where the vendor id is null or vendor id is not in (1,2).
/*Green Taxi*/
SELECT sum(CASE when vendor_id = 1 THEN 1 ELSE 0 END)as Creative_Mobile_Tech,
       sum(CASE when vendor_id = 2 THEN 1 ELSE 0 END)as Verifone_Inc,
       sum(CASE when vendor_id < 1 or vendor_id > 2  THEN 1 ELSE 0 END)as Others,
       sum(CASE when vendor_id IS NULL THEN 1 ELSE 0 END) as NULL_Values,
count(*) as Total_Vendors
from stg_ny_green_taxi;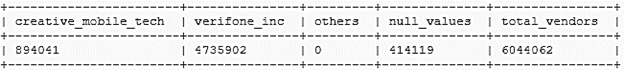
The output of the query for the Green Taxi is as below:
- There are a total of 6044062 records in the dataset.
- Records for Creative Mobile Tech are 894041 and Verifone Inc is 4735902.
- There are 414119 records where the vendor id is null or not in (1, 2).
/*Yellow Taxi*/
SELECT sum(CASE when vendor_id = 1 THEN 1 ELSE 0 END)as Creative_Mobile_Tech,
       sum(CASE when vendor_id = 2 THEN 1 ELSE 0 END)as Verifone_Inc,
       sum(CASE when vendor_id < 1 or vendor_id > 2  THEN 1 ELSE 0 END)as Others,
       sum(CASE when vendor_id IS NULL THEN 1 ELSE 0 END) as NULL_Values,
count(*) as Total_Vendors
from stg_ny_yellow_taxi;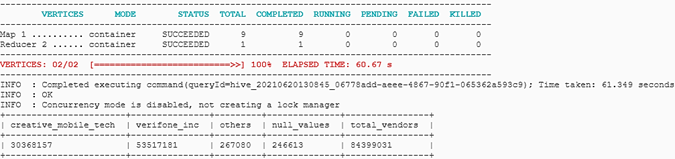
The output of the query for the Yellow Taxi is as below:
- There are a total of 84399031 records in the dataset.
- Records for Creative Mobile Tech are 30368157 and Verifone Inc is 53517181.
- There are 246613 records where the vendor id is null or not in (1, 2).
- There are 267080 records other than 1 or 2 and not NULL.
EDA2: We will perform exploratory data analysis associated with vendor trips:
- Distinct Vendors count.
- Min and max time range for pickups and drops.
- Min and Max Passengers Count in a trip.
- Distinct payment types are used to count.
- Distinct rate codes were used.
- Check if any records imply that only trips that have been started and completed are in the year 2019. Only data between January to December 2019 will be considered for our analysis.
/*Green Taxi*/
select count(*) as number_of_records,
count(distinct vendor_id) as number_of_tpep_vendors,
min(to_date(lpep_pickup_datetime)) as oldest_pickup_timestamp,
max(to_date(lpep_pickup_datetime)) as recent_pickup_timestamp,
min(to_date(lpep_dropoff_datetime)) as oldest_dropoff_timestamp,
max(to_date(lpep_dropoff_datetime)) as recent_dropoff_timestamp,
min(passenger_count) as min_passengers_pertrip,
max(passenger_count) as max_passengers_pertrip,
avg(passenger_count) as average_passengers_pertrip,
min(trip_distance) as min_trip_distance,
max(trip_distance) as max_trip_distance,
avg(trip_distance) as average_trip_distance,
count(distinct rate_code_id) as number_of_rate_codes,
count(distinct store_and_fwd_flag) as types_of_store_forward_flag,
count(distinct pu_location_id) as num_of_pickup_zones,
count(distinct do_location_id) as num_of_dropoff_zones,
count(distinct payment_type) as number_of_payment_types
from stg_ny_green_taxi;
The output of the query for the Green Taxi is as below:
- There are a total of 6044062 records in the dataset.
- There are 2 TPEP vendors.
- The pickup timestamps and drop timestamps range between 21st Aug 2008 and 15th Aug 2062. This is a nonconformity.
- The passenger count ranges between 0 to 9.
- There are 7 distinct rate codes in the dataset when the data dictionary limits it to 6. This is a nonconformity.
- There are 262 logged pickup locations and 264 logged drop-off locations.
- There are 5 distinct payment types in the dataset.
/*Yellow Taxi*/
select count(*) as number_of_records,
count(distinct vendor_id) as number_of_tpep_vendors,
min(to_date(tpep_pickup_datetime)) as oldest_pickup_timestamp,
max(to_date(tpep_pickup_datetime)) as recent_pickup_timestamp,
min(to_date(tpep_dropoff_datetime)) as oldest_dropoff_timestamp,
max(to_date(tpep_dropoff_datetime)) as recent_dropoff_timestamp,
min(passenger_count) as min_passengers_pertrip,
max(passenger_count) as max_passengers_pertrip,
avg(passenger_count) as average_passengers_pertrip,
min(trip_distance) as min_trip_distance,
max(trip_distance) as max_trip_distance,
avg(trip_distance) as average_trip_distance,
count(distinct rate_code_id) as number_of_rate_codes,
count(distinct store_and_fwd_flag) as types_of_store_forward_flag,
count(distinct pu_location_id) as num_of_pickup_zones,
count(distinct do_location_id) as num_of_dropoff_zones,
count(distinct payment_type) as number_of_payment_types
from stg_ny_yellow_taxi;
The output of the query for the Yellow Taxi is as below:
- There are a total of 84399031 records in the dataset.
- There are 3 TPEP vendors. But, the given TPEP vendors are 2. This is a non-conformity
- The pickup timestamps and drop timestamps range between the 1st of Jan 2001 and the 31st of Dec 2090. This is a nonconformity.
- The passenger count ranges between 0 to 9.
- There are 7 distinct rate codes in the dataset when the dictionary limits it to 6. This is a nonconformity.
- There are 263 logged pickup locations and 263 logged drop-off locations.
- There are 5 distinct payment types in the dataset.
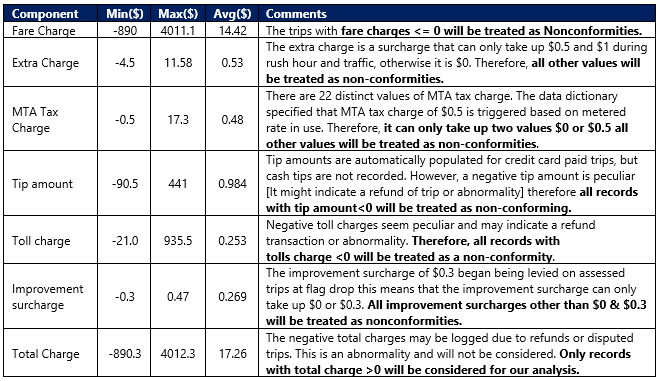
EDA3: We will Perform exploratory data analysis of components associated with Fare Details like the following:
• Min, Max, and Average fare charge
• Min, Max, and Average extra charge
• Min, Max, and Average MTA charge
• Distinct count of MTA types
• Min, Max, and Average tip amount
• Min, Max, and Average toll charge
• Min, Max, and Average improvement surcharge charges
• Distinct count of improvement surcharge types
• Min, Max, and Average total amount
/*Green Taxi*/
select min(fare_amount) as min_fare_charge,
max(fare_amount) as max_fare_charge,
avg(fare_amount) as average_fare_charge,
min(extra_charge) as min_extra_charge,
max(extra_charge) as max_extra_charge,
avg(extra_charge) as average_extra_charge,
count(distinct mta_tax) as types_of_mta_tax_charge,
min(mta_tax) as min_mta_tax_charge,
max(mta_tax) as max_mta_tax_charge,
avg(mta_tax) as average_mta_tax_charge,
min(tip_amount) as min_tip_amount,
max(tip_amount) as max_tip_amount,
avg(tip_amount) as average_tip_amount,
min(tolls_amount) as min_toll_charge,
max(tolls_amount) as max_toll_charge,
avg(tolls_amount) as average_toll_charge,
count(distinct improvement_surcharge) as types_of_surcharge,
min(improvement_surcharge) as min_surcharge,
max(improvement_surcharge) as max_surcharge,
avg(improvement_surcharge) as average_surcharge,
min(total_amount) as min_total_charge,
max(total_amount) as max_total_charge,
avg(total_amount) as average_total_charge
from stg_ny_green_taxi;
The output for the Green Taxi is below:
/*Yellow Taxi*/
select min(fare_amount) as min_fare_charge,
max(fare_amount) as max_fare_charge,
avg(fare_amount) as average_fare_charge,
min(extra_charge) as min_extra_charge,
max(extra_charge) as max_extra_charge,
avg(extra_charge) as average_extra_charge,
count(distinct mta_tax) as types_of_mta_tax_charge,
min(mta_tax) as min_mta_tax_charge,
max(mta_tax) as max_mta_tax_charge,
avg(mta_tax) as average_mta_tax_charge,
min(tip_amount) as min_tip_amount,
max(tip_amount) as max_tip_amount,
avg(tip_amount) as average_tip_amount,
min(tolls_amount) as min_toll_charge,
max(tolls_amount) as max_toll_charge,
avg(tolls_amount) as average_toll_charge,
count(distinct improvement_surcharge) as types_of_surcharge,
min(improvement_surcharge) as min_surcharge,
max(improvement_surcharge) as max_surcharge,
avg(improvement_surcharge) as average_surcharge,
min(total_amount) as min_total_charge,
max(total_amount) as max_total_charge,
avg(total_amount) as average_total_charge
from stg_ny_yellow_taxi;
The output of Yellow Taxis is as given below: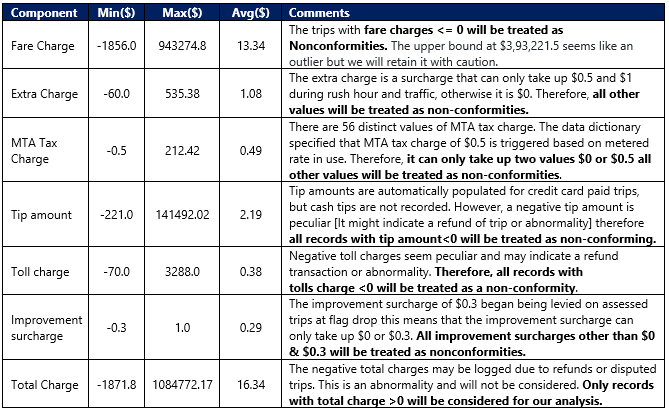
In a similar manner, EDA can be performed to verify associated components with passenger count, rate code, payment type, and also if there are any records in which the pickup timestamp is after the drop-off timestamp. By analyzing all these scenarios, we can see the non-confirming records where:
- Vendor id is null or not in (1,2)
- Pick up or drop off date times != 2019
- Pick up date time is after the drop-off timestamp
- Passenger count not in (1,2,3,4,5,6,7,8,9)
- Trip distance <= 0.0
- Rate code id not in (1,2,3,4,5,6)
- Payment type not in (1,2,3,4,5,6)
- Fare amount <= 0
- Extra charge not in (0,0.5,1)
- MTA Tax not in (0,0.5)
- Tip Amount less than 0
- Payment type = 2 and tip amount is not 0
- Tolls amount less than 0
- Improvement surcharge not in (0,0.3)
- Total amount <= 0
So, we now have the total non-confirming records for the Green Taxi records:
/*Green Taxi*/
select vendor_id as Vendor_Id_1CreativeMob_2VeriFone,
count(*) as NonConf_Records
from stg_ny_green_taxi
where year(lpep_pickup_datetime) =2019 and year(lpep_dropoff_datetime) =2019 and
unix_timestamp(lpep_pickup_datetime) < unix_timestamp(lpep_dropoff_datetime) and
passenger_count in (1,2,3,4,5,6,7,8,9) and
trip_distance > 0.0 and rate_code_id in (1,2,3,4,5,6) and
payment_type in (1,2,3,4,5,6) and fare_amount > 0 and
extra_charge in (0,0.5,1) and mta_tax in (0,0.5) and
tip_amount > 0.0 and tolls_amount >= 0.0 and
improvement_surcharge in (0,0.3) and
total_amount > 0 and vendor_id is not null
group by vendor_id
order by vendor_id;
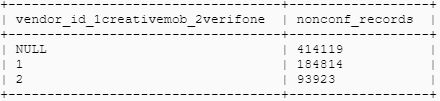 There are almost 692856 non-confirming records for the green taxi, which accounts for 11.4% of the total Green Taxi Y2019 dataset and total Non-confirming records for the Yellow Taxi records:
/*Yellow Taxi*/
select vendor_id as Vendor_Id_1CreativeMob_2VeriFone,
count(*) as NonConf_Records
from stg_ny_yellow_taxi
where year(tpep_pickup_datetime) =2019 and year(tpep_dropoff_datetime) =2019 and
unix_timestamp(tpep_pickup_datetime) < unix_timestamp(tpep_dropoff_datetime) and
passenger_count in (1,2,3,4,5,6,7,8,9) and
trip_distance > 0.0 and rate_code_id in (1,2,3,4,5,6) and
payment_type in (1,2,3,4,5,6) and fare_amount > 0 and
extra_charge in (0,0.5,1) and mta_tax in (0,0.5) and
tip_amount > 0.0 and tolls_amount >= 0.0 and
improvement_surcharge in (0,0.3) and
total_amount > 0 and vendor_id is not null
group by vendor_id
order by vendor_id;
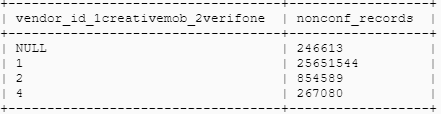
There are almost 27019826 non-confirming records for the yellow taxi, which accounts for 32% of the total Yellow Taxi Y2019 dataset.
In this part, we have seen how to create a Google data proc cluster, create external tables in HIVE by pointing to the data located on google cloud storage, perform exploratory data analysis and find non-confirming records. In the next part, we will see the remaining steps of creating main tables with valid records for detailed deep drive analysis.
Recommend
About Joyk
Aggregate valuable and interesting links.
Joyk means Joy of geeK