

Spring Boot Pet Clinic App: A Performance Study
source link: https://dzone.com/articles/spring-boot-pet-clinic-app-performance-study
Go to the source link to view the article. You can view the picture content, updated content and better typesetting reading experience. If the link is broken, please click the button below to view the snapshot at that time.


Spring pet clinic application is a sample application developed by the Spring Framework developers to demonstrate the capabilities of Spring Boot, Spring MVC, and Spring Data Framework. We set out to conduct a performance test on this application and see whether we can identify any performance bottlenecks.
Environment Setup
We cloned the Spring pet clinic application’s official Github repository and followed instructions to build a JAR file. Once the JAR file was ready, we launched the application on http://localhost:8080.
We launched the pet clinic application in the following environment:
- Ubuntu
- OpenJDK 11
- Embedded Tomcat 9
- HSQL Database
- AWS EC2 t3a.medium instance
Loading the Test Setup
To conduct this exercise, we used Redline13 – a cloud load testing tool. We decided to use RedLine13, as it provides distributed load testing capability in the cloud at a very low cost. Besides that, it takes a standard JMX script as input for testing. The Github repository of the Spring Petclinic application comes with a load testing JMX script. However, this script had a few problems. We fixed those problems in the JMX script and executed the following scenarios in our load test.
- Loading the Home page.
- View a list of veterinarians and their specialties.
- View pet owner's information.
- Update the information of the pet owner.
- Add a new pet owner to the system.
- View information pertaining to a pet.
- Update information pertaining to a pet.
- Add a new pet to the system.
- View information pertaining to a pet’s visitation history.
- Add information pertaining to a visit to the pet’s visitation history.
- List all pet owners.
- Find pet owner information by the last name.
We conducted the Load test with the following configuration:
- Duration: 30 minutes
- Number of Threads: 150/second
- Ramp-up period: 60 second(s)
Test Results
Here is the actual Redline13 test result report. We would like to point out a few interesting metrics that were reported by the Reline13 tool.
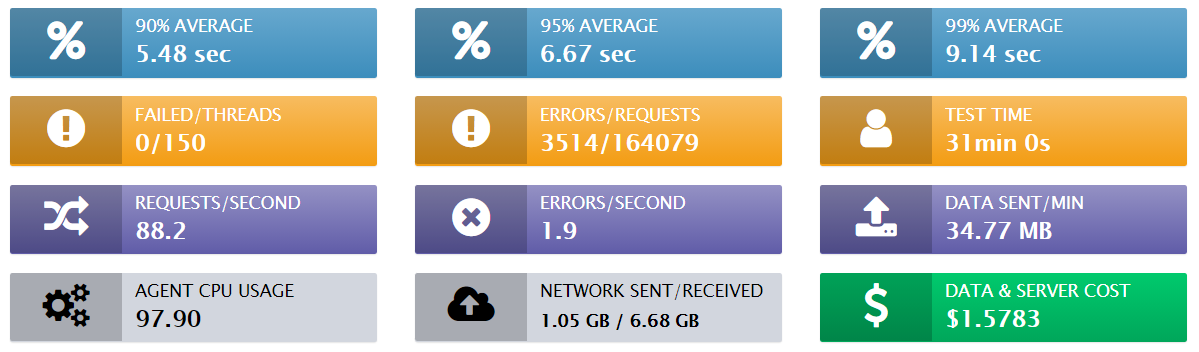
Fig: Redline13 Report Summary
Overall Response Time: 90 percentile average response time was 5.48 seconds, 95 percentile average response time was 6.67 seconds, and the 99 percentile average response time was 9.14 seconds. This is a quite poor response time especially for a vanilla pet clinic type of application. The primary reason for this poor response time could be due to the network. Our Redline13 load testing tool was set up in the AWS W. Virginia region, whereas the Spring Boot pet clinic application was deployed in AWS US-west1 (N. California) region. Since transactions had to be made across the country, response time could have been degraded.
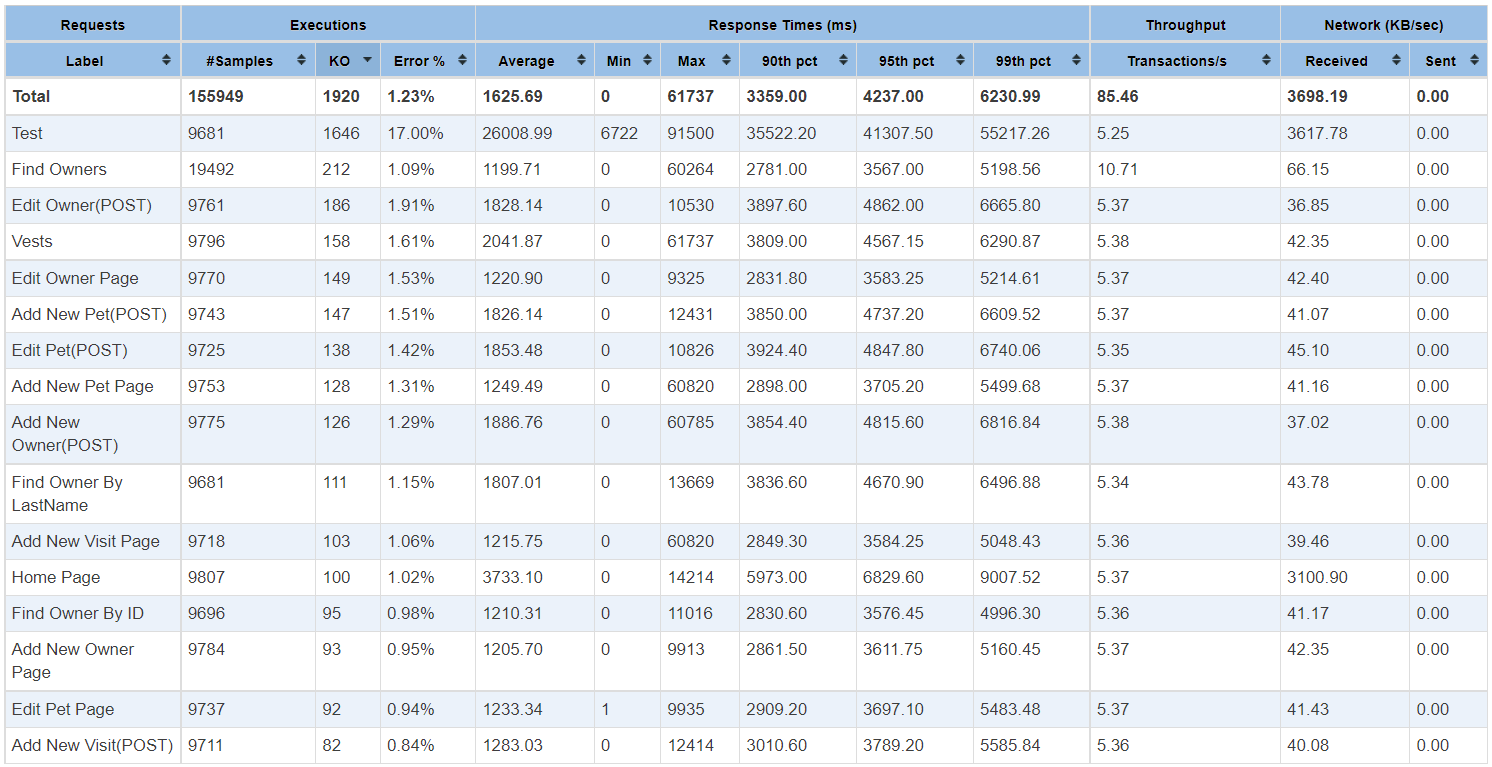
Page-level response time: Redline13 was also reporting individual page-level requests response time. The below table shows complete statistics for every single request, which has been executed.
Network Traffic: During the entire test run, we sent 1.05GB of data in the network and received 6.68GB of data back from the Spring Boot Petclinic application
CPU usage: Load agent CPU utilization for the test was "pegged" at 97.90% for nearly the entire duration. It appears that we were generating more amount of load from the load testing machine. As a general recommendation, it’s advised that load agent CPU utilization be kept around 70%-80%.
Performance Characteristics
After running the load test for 30 minutes, we ran the yCrash tool against the pet clinic application. yCrash captures various JVM and system-level artifacts such as GC log, thread dump, heap dump, netstat, vmstat, iostat, top, top -H,… from the application and analyzes them instantly. The yCrash tool will uncover performance problems in the application and report the root cause of them. Below are some of the interesting observations that the yCrash tool reported.
1. Garbage Collection
Garbage collection plays a key role in influencing the application’s performance characteristics. The pet clinic application’s garbage collection performance was excellent. Overall application’s garbage collection throughput was 99.378%. It means the application was spending 99.378% of its time in processing customer activity and only 0.622% of its time in processing the Garbage collection activities. This is an excellent GC throughput. Similarly, the application’s max pause time was 50ms and the average pause time was 10.5ms. Once again, this is an excellent GC pause time.
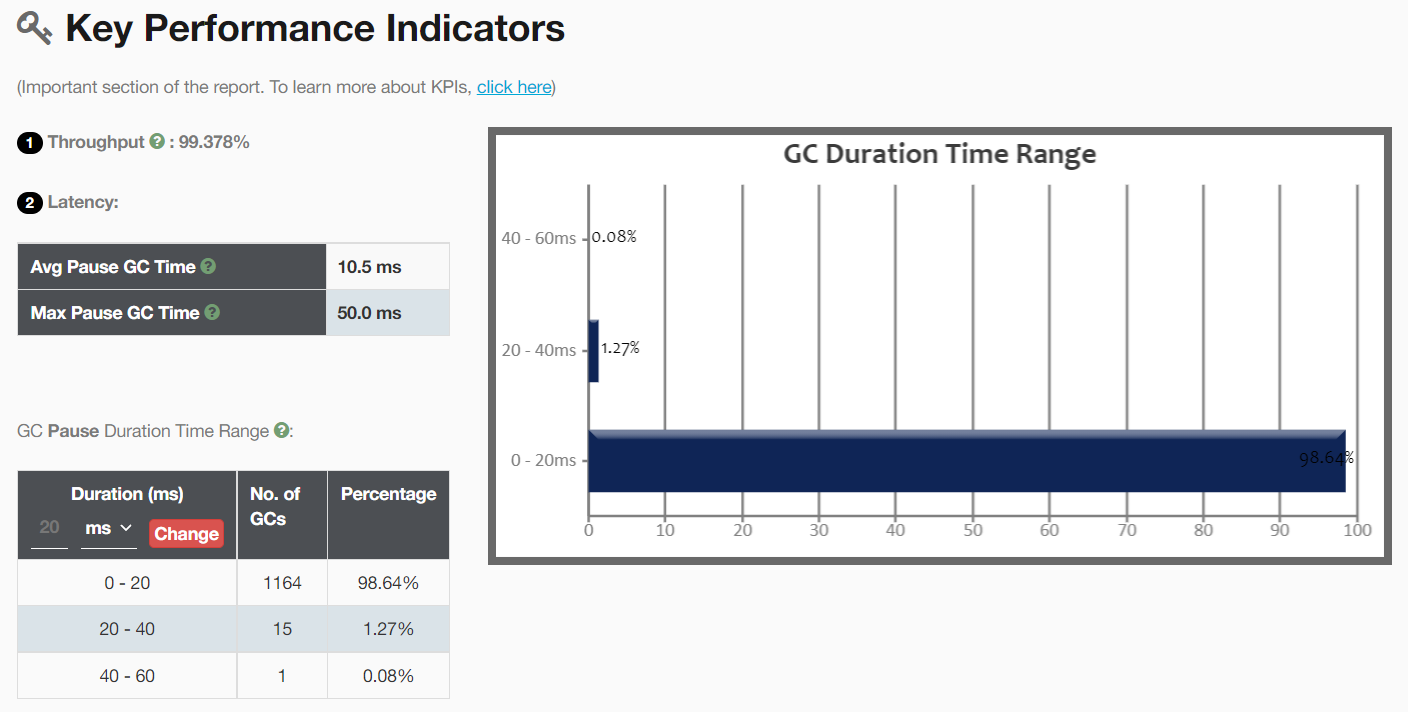
Fig: Garbage Collection KPI reported by the yCrash
2. Threads
The yCrash tool reported that the application had created 212 threads. In that 90% of threads i.e. 190 threads were in the TIMED_WAITING state. Basically, they weren’t doing anything.
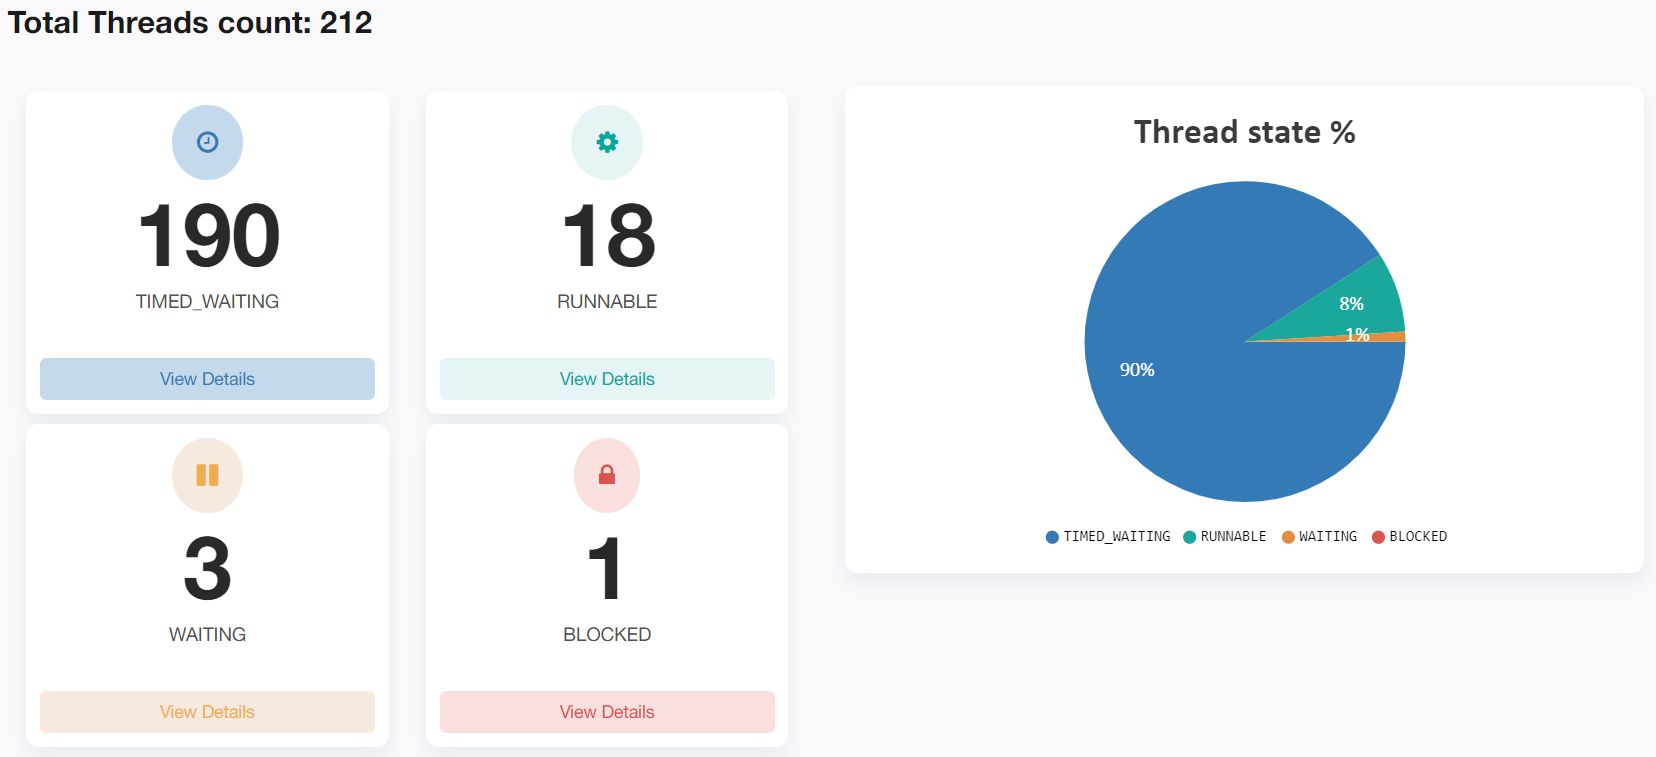
Fig: Thread states reported by the yCrash
Almost all of the TIMED_WAITING threads were from the tomcat container thread pool. Since we captured the thread dump towards the end of the test run, it might explain why most of the threads aren’t doing anything.
Thread report contains several sections such as Deadlock, thread groups, CPU consuming threads, Blocked threads transitive dependency graph, threads that are experiencing exception, threads call tree; it also painted the flamegraph, showing the concentration of execution of code path in one single concise view. Below is the screenshot of it:
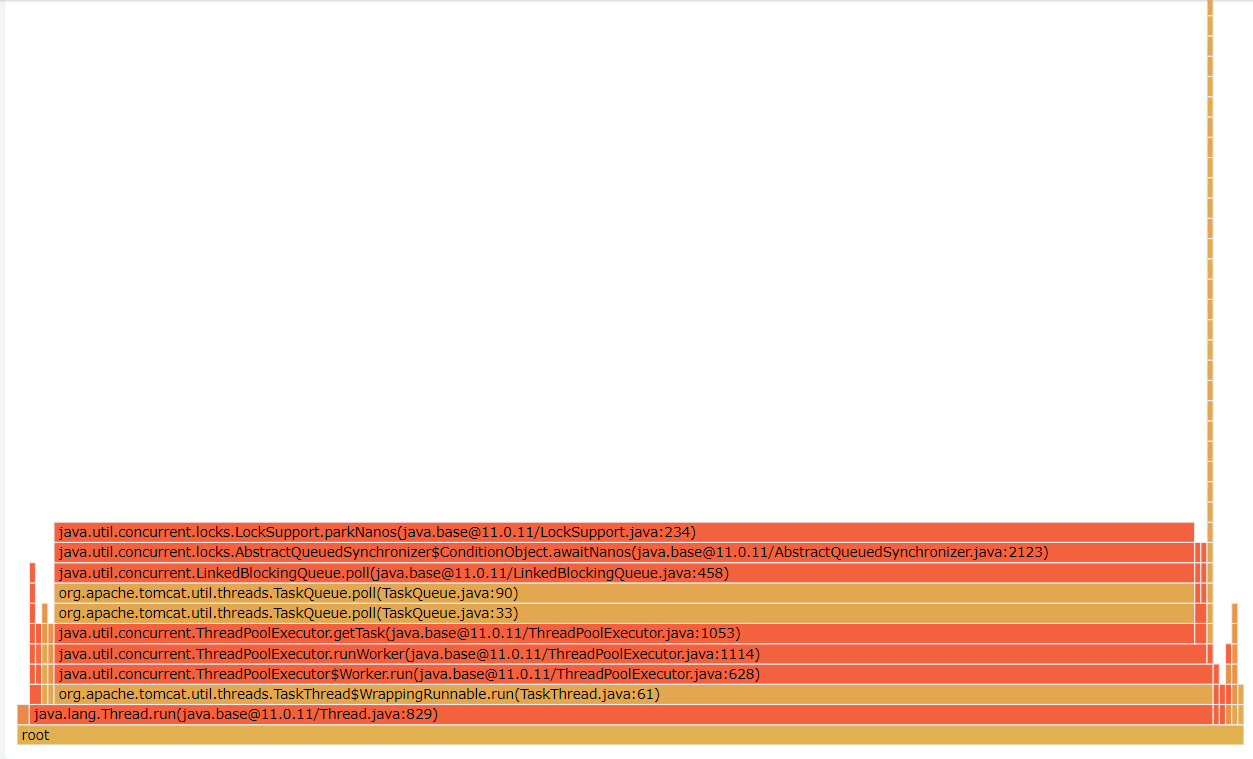
Fig: Flame graph showing the concentration of code path execution
3. Heap
Heap dump analysis reported by the yCrash tool indicated that the application is wasting 61% of memory because of inefficient programming.
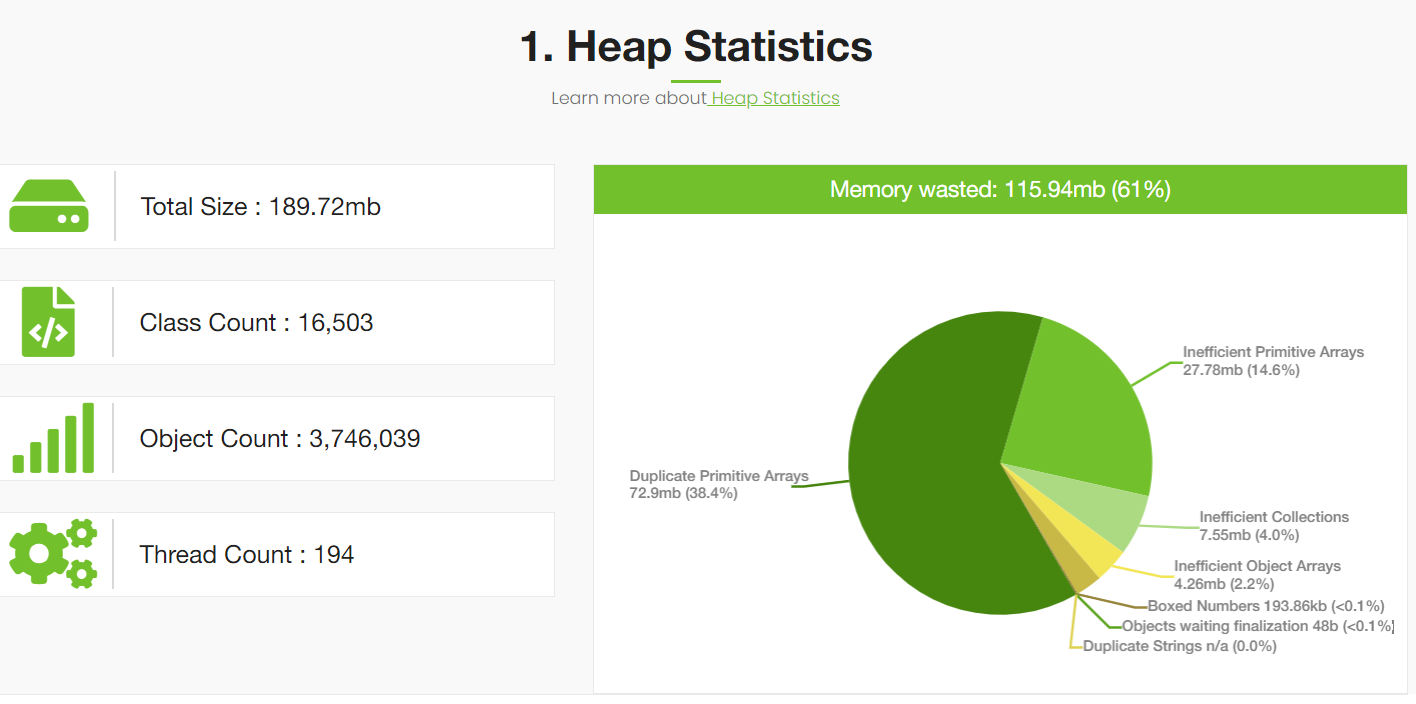
Fig: Memory wasted stats reported by yCrash
This memory wastage reporting is pretty much consistent with our earlier findings that we published almost 2 years back. Modern applications tend to waste a lot of memory because of inefficient programming practices. The Spring Boot pet clinic application is no exception to it. You can refer to our earlier report to see where all memory is wasted and how it can be avoided. We don’t want to repeat the same contents in this post.
4. Processes
Sometimes outages and degradation in your application can happen because of neighboring applications running on the same device or on the neighboring containers. Thus, the yCrash reports the resource consumption of all the neighboring applications.
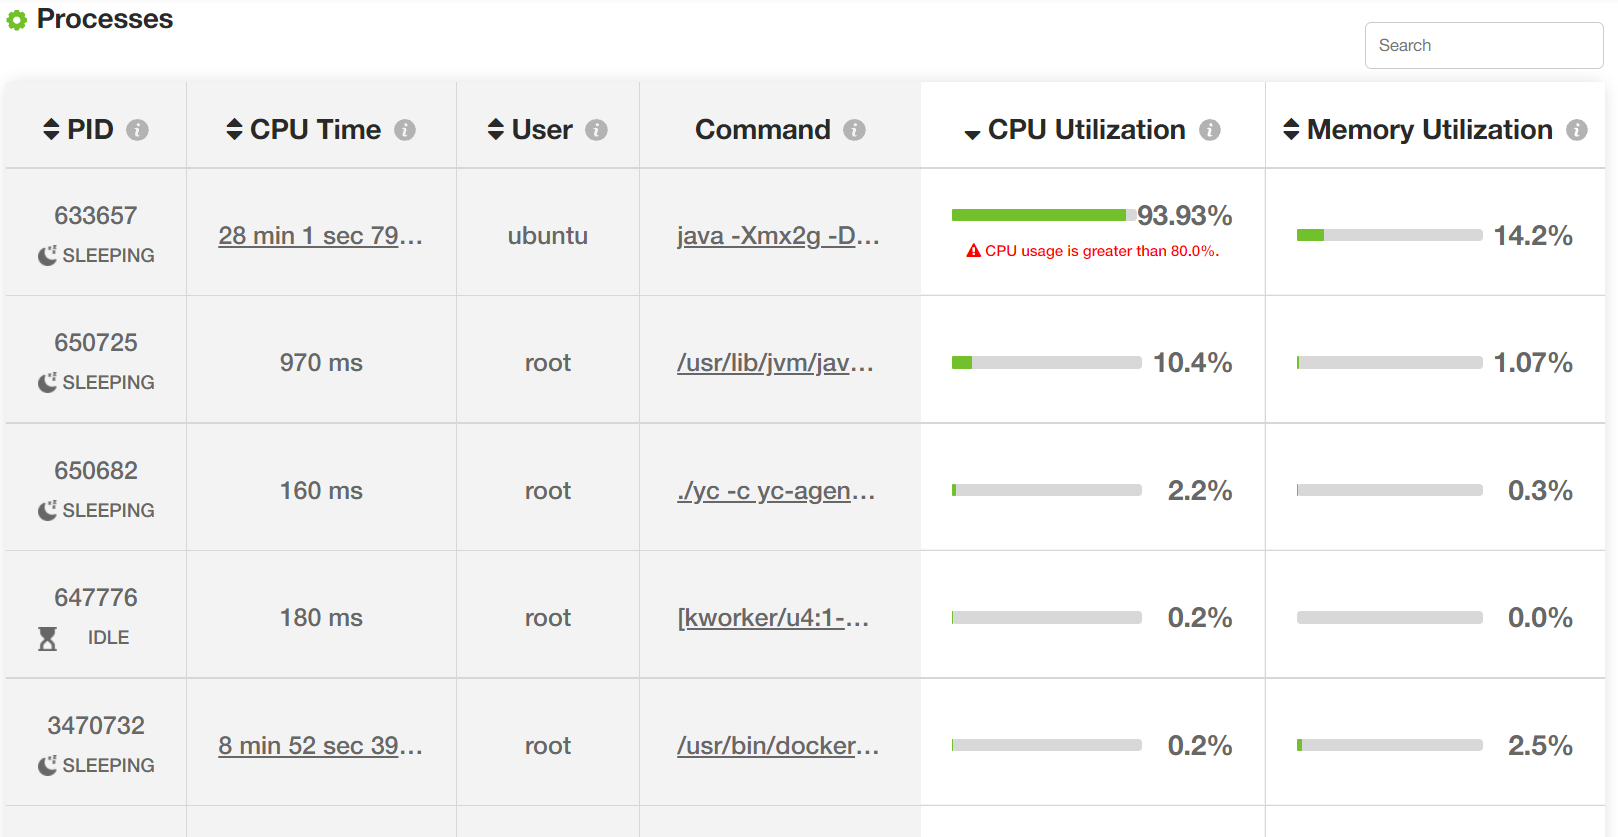
Fig: Resource consumption of all processes (Image trimmed).
Similarly, the yCrash tool also reports various device-level metrics such as the total number of processes running on the device, their states, overall memory/swap space utilization, 8 different types of CPU utilization, load average metrics, etc.
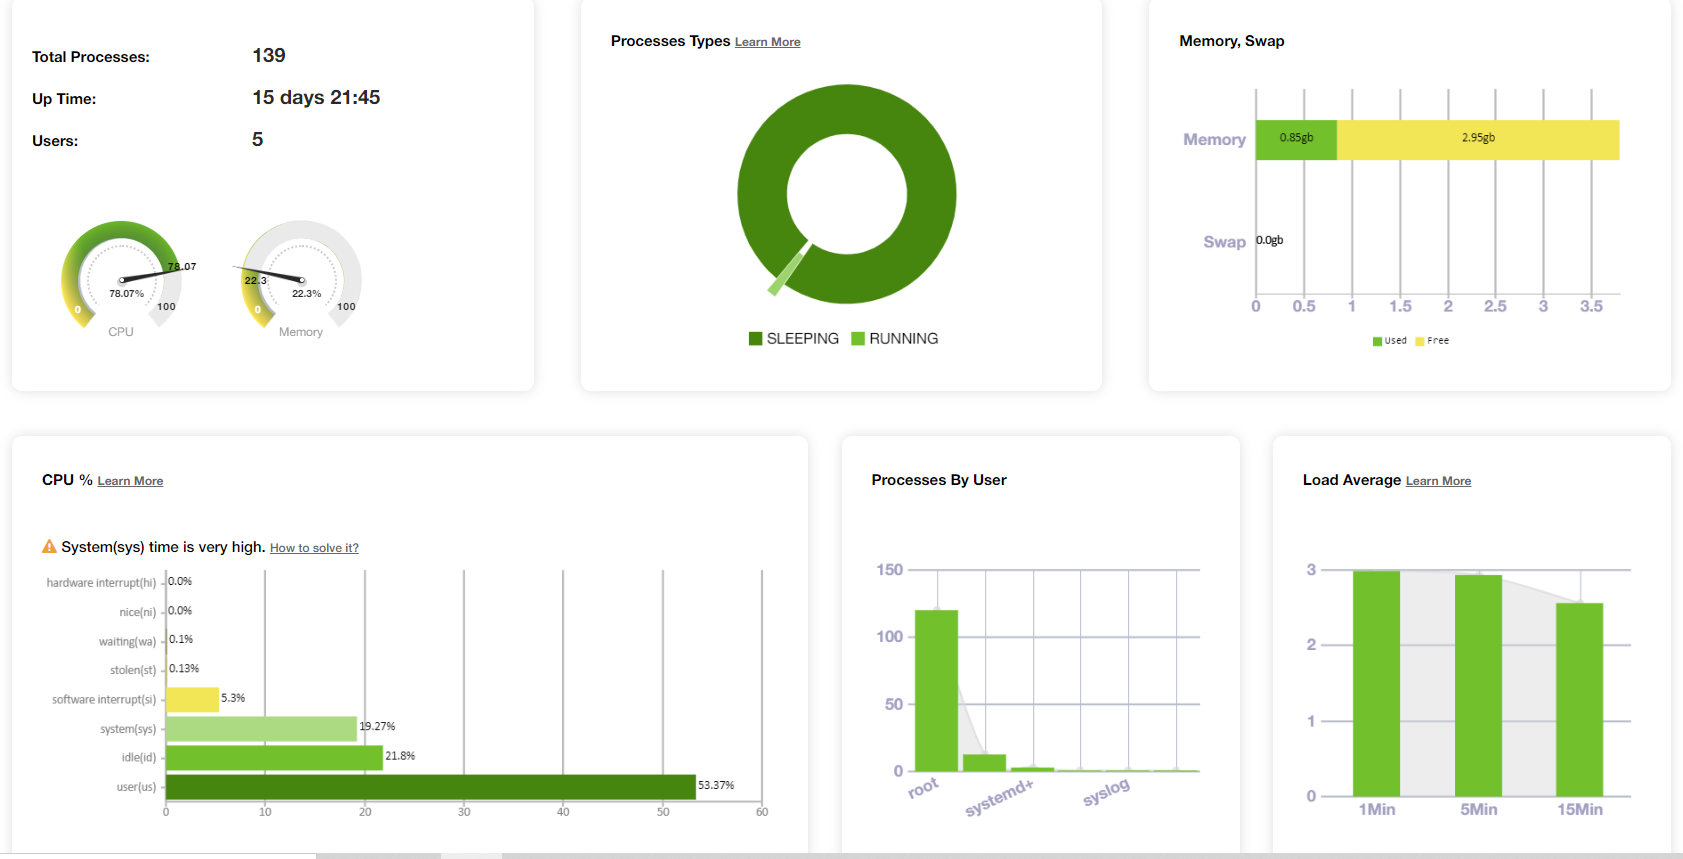
Fig: Overall host’s resource consumption
5. Storage
Sometimes outages can happen when there is a lack of disk space. The application writes to disk for logging or other purposes. The yCrash tool reports the storage space utilization on the device. Below, is the yCrash report on the storage:
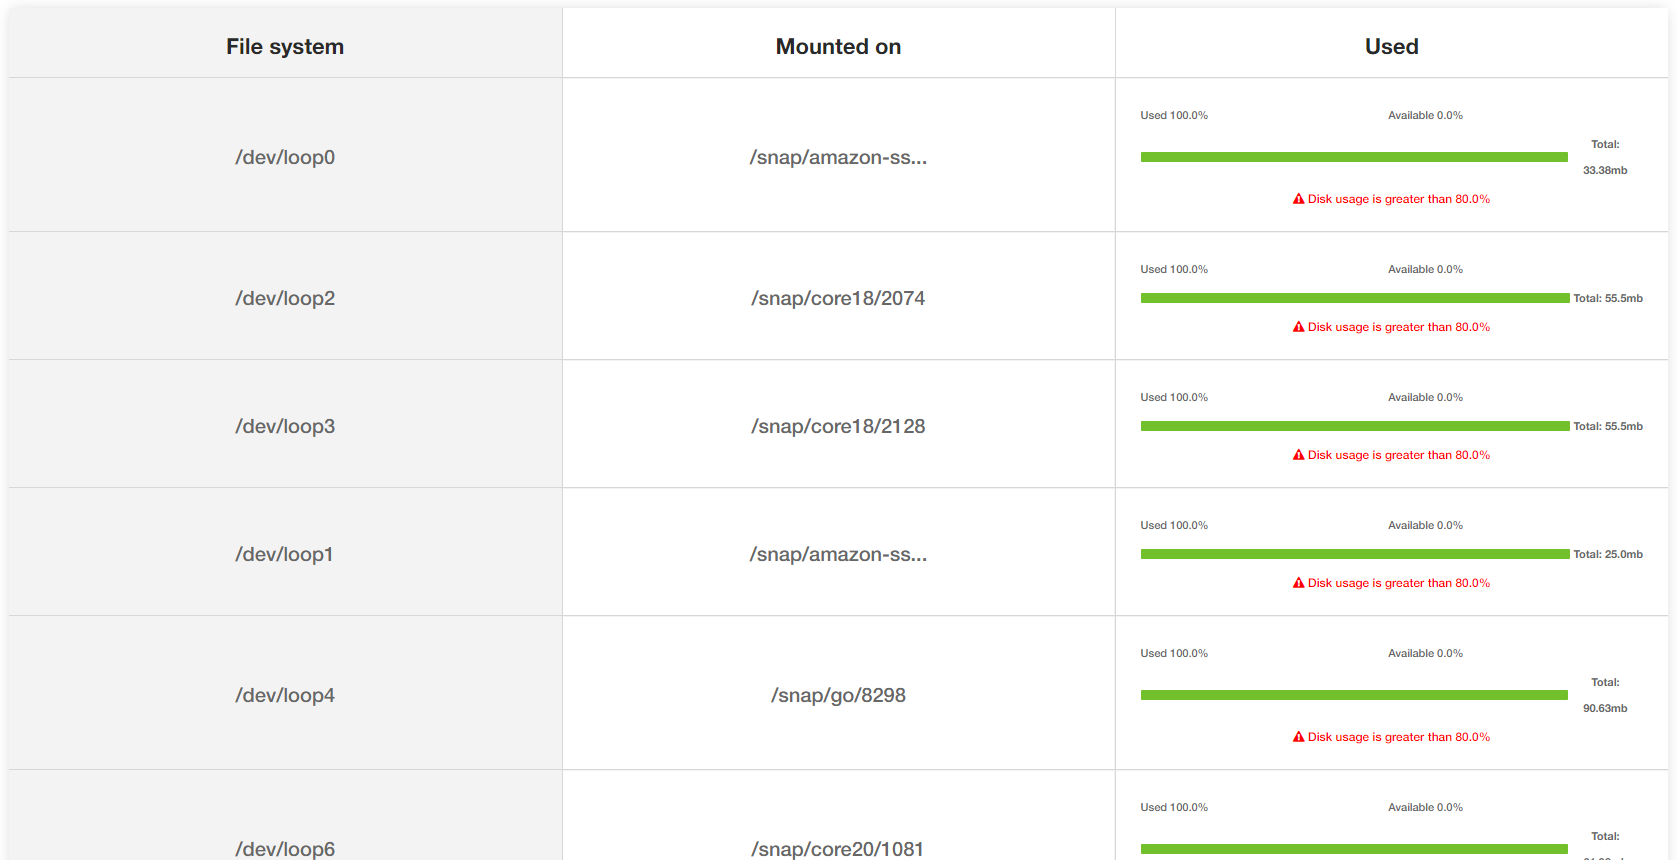
Fig: Storage utilization on the device
We were running the Spring Boot Pet clinic application on an EC2 with very limited disk space. Thus, the yCrash reported warnings on the file mounts which lacked disk space.
6. Network
The yCrash tool also reports the network level statistics such as what is the total number of TCP/IP connections, UDP connections, connections by the hosts, network ping time, TCP/IP connection states (such as ESTABLISHED, CLOSE_WAIT, etc.). Since the Spring Boot pet clinic application wasn’t making many network connections, therefore, we didn’t observe any network connectivity issue.
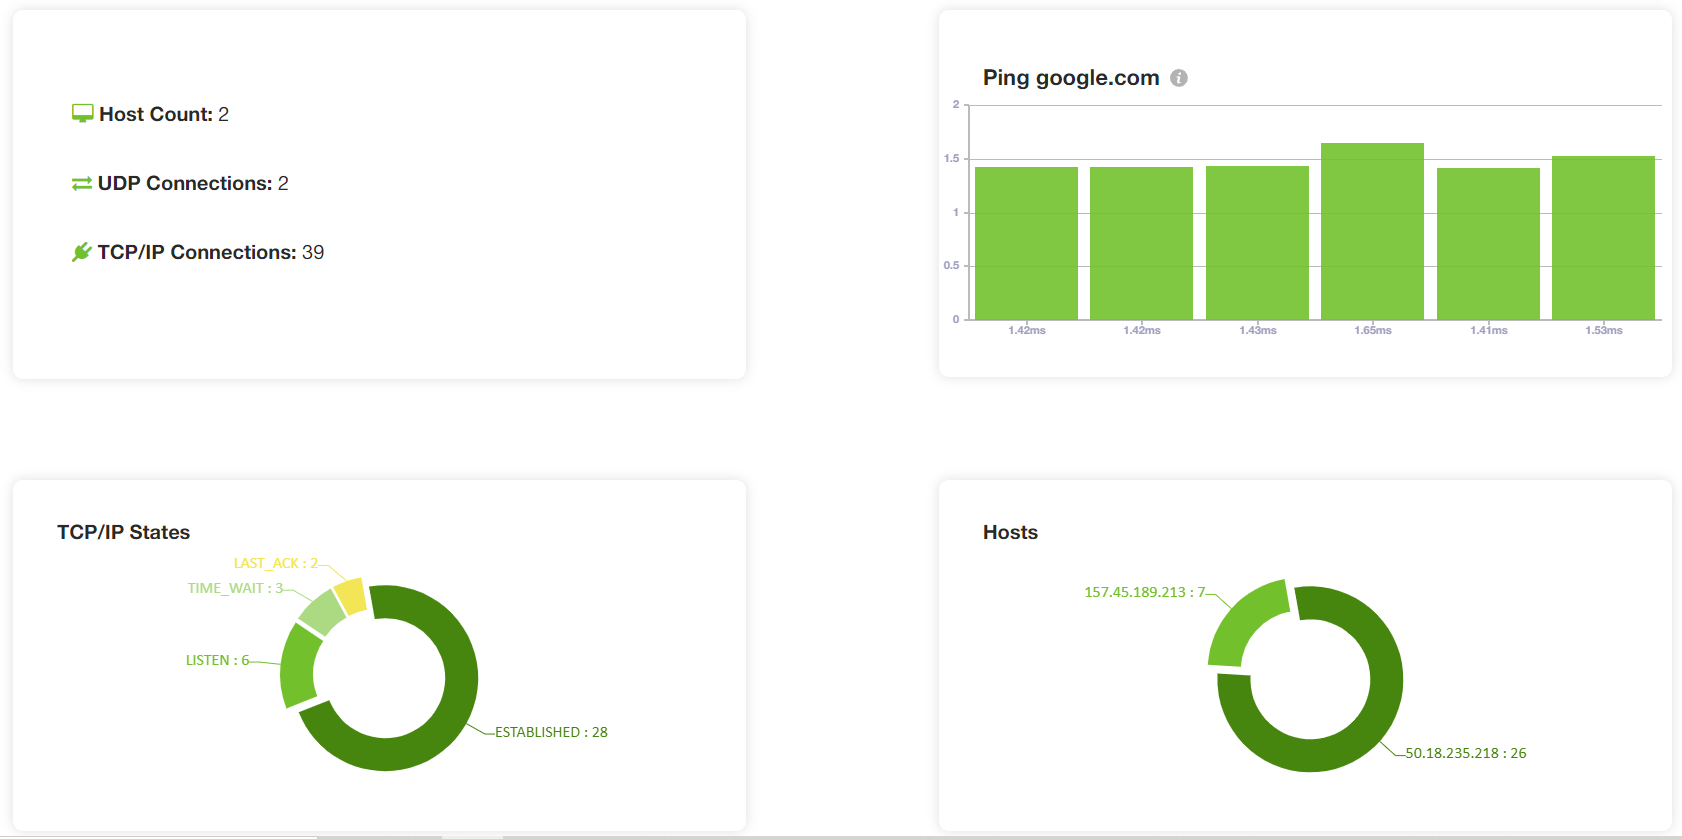
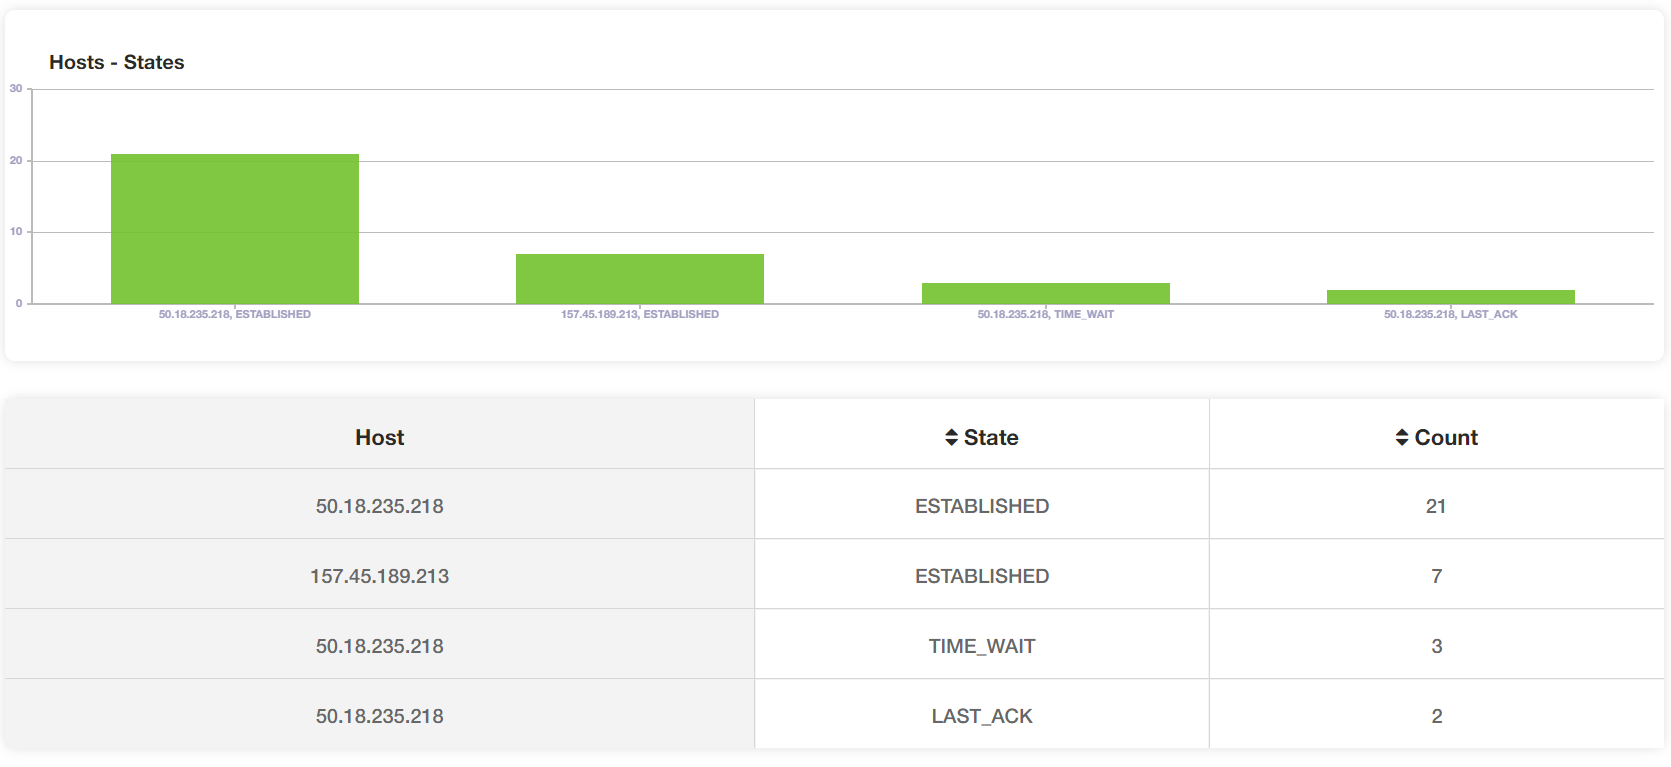
Fig: TCP connections by host and their states
7. Kernel
Performance problems or instability in the application can surface because of the issues in the Operating system as well. The yCrash reports the kernel’s log and kernel settings as well. If there is any network problem, memory problem, or read/write problems, they will be reported in the kernel log file.
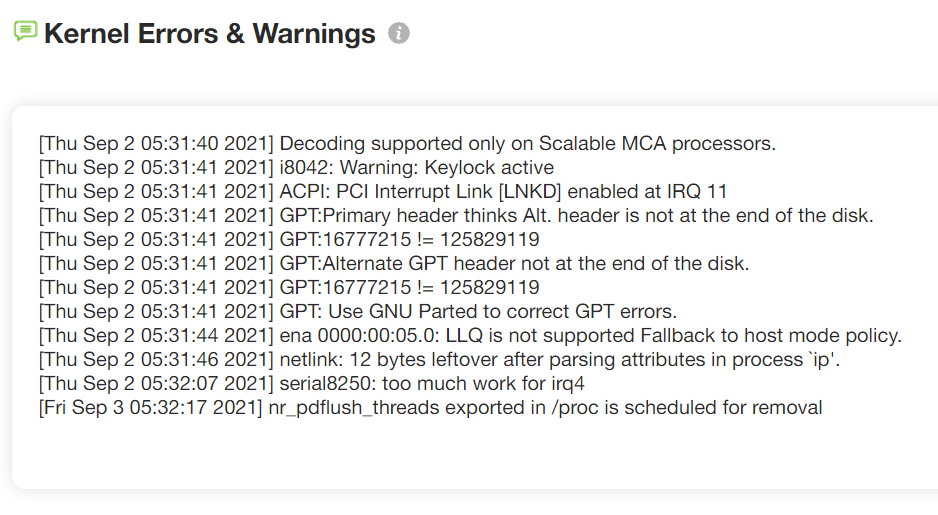
Fig: Kernel logs reported by yCrash
Above, is the screenshot of the kernel logs reported by yCrash. No major kernel-level problems were reported.
Conclusion
Except for 61% memory wastage no other major issues were uncovered from our testing, Of Course, other minor issues were observed like a lack of disk space and a spike in System CPU time. We hope you find this exercise interesting. Thanks for reading!
Recommend
About Joyk
Aggregate valuable and interesting links.
Joyk means Joy of geeK