

Full-Stack Observability Essentials
source link: https://dzone.com/refcardz/full-stack-observability-essentials
Go to the source link to view the article. You can view the picture content, updated content and better typesetting reading experience. If the link is broken, please click the button below to view the snapshot at that time.

Essentials to Full-Stack Observability
Full-stack observability is the ability to understand at any time what is happening across a technology stack. By collecting, correlating, and aggregating all telemetry in the components, it provides insight into the behavior, performance, and health of a system. Through full-stack observability, teams can deeply understand the dependencies across domains and system topology. Contrary to traditional monitoring systems, full-stack observability enables IT teams to proactively react, predict, and prevent problems using artificial intelligence and machine learning, which is all but a requirement considering that the amount of data collected would be nearly impossible otherwise. Presenting this data in the form of unified analytics and dashboards can give the observer a complete picture into the health of the system, for example, where issues occurred and solutions were introduced.
Telemetry (MELT)
To achieve observability of a system, we rely on the aggregation of telemetry data from four categories. These are the raw data that will feed the system — Metrics, Events, Logs, and Traces (or MELT):
- Metrics: A numerical representation of measurements over a period of time. They can be used to report on the health of a system. Examples of metrics include the amount of memory being used at a given time, the queue size of a message broker, or the number of errors per second.
- Events: Immutable time-stamped records of events over time. Usually emitted by the service due to actions in the code.
- Logs: Lines of written text describing an event that occurred at a given time, usually the result of a block of code being executed. Logs can be represented in plain text, structured text (like JSON), or binary code. They are especially useful to troubleshoot systems less prone to instrumentation, databases, or load balancers to name a few. The basic “Hello World” is usually the first log that any developer writes — and they tend to be more granular than an event.
- Traces: Represents the flow of a single transaction or request as it goes through a system. Traces should show the path that is followed, the latency each component inflicts on the way, and the relevant information associated with each component that might indicate bottlenecks or issues. These data streams should be able to answer questions easily and clearly about the availability and performance of a system.
Microservices
The single responsibility principle was first coined by Robert C. Martin and became the base of the microservices philosophy:
“Gather together the things that change for the same reasons. Separate those things that change for different reasons.”
A microservice architecture follows this approach by arranging an application into smaller, loosely coupled services that can be developed, deployed, and maintained independently. The services communicate with one another through APIs as building blocks of the overall system. This can provide more agile development that monoliths do not benefit from. Microservices can be developed and fixed separately while isolating other components from possible issues occurring that have a negative impact on the overall system. Microservices can give a development team freedom to select the best technology set for the problem at hand — and can be altered, enhanced, and scaled without having to cross other services’ borders.
Microservices, however, are not the holy grail that solves all problems, and companies can easily reach hundreds or thousands of microservices, making security, observability, and network policies more complex to address. That’s where service meshes come in, by enabling managed, observable, and secure communication between services. Service meshes remove the logic through governing the communication between microservices from the services and into an infrastructure layer.

Although not all service mesh implementations are as follows, most requests will be routed between microservices through proxies that will live in their own infrastructure, decoupling business logic from network function. The individual proxies sit beside the service and are sometimes called a “sidecar” for that same reason. All of these decoupled proxies together form a service mesh network. Without the service mesh, microservices must govern service-to-service communication, and not only can it become a hidden point of failure, but it also becomes more costly to maintain.
Service meshes can help bring visibility into the application layer without code changes, making it easier to configure collection of metrics; as all traffic goes through the proxies in the mesh, this enables the observer to have greater visibility into all service interactions. Each proxy will report on its portion of the interaction, providing metrics like inbound and outbound proxy traffic, service-level metrics. Access logs with service calls and distributed traces, which the mesh generates via information on every service within it, make it easier to follow a request across multiple services and proxies.
Since microservices are distributed by nature, they can be challenging to monitor and observe. Correlating logs from many different services and going through them to figure out where issues can occur is one of the main pain points in such an architecture.
Distributed Tracing
As mentioned earlier, distributed tracing enables development and DevOps teams to debug and monitor complex distributed systems such as microservices by tracking transactions from service to service, throughout the stack. This holistic approach empowers teams to make informed decisions when needed by combining server-side and client-side monitoring together with the power of visualization tools. This is end-to-end observability.
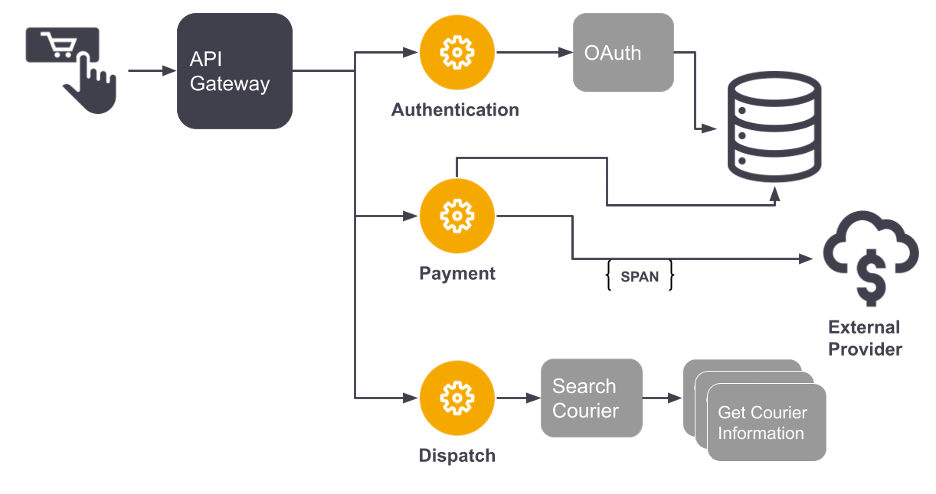
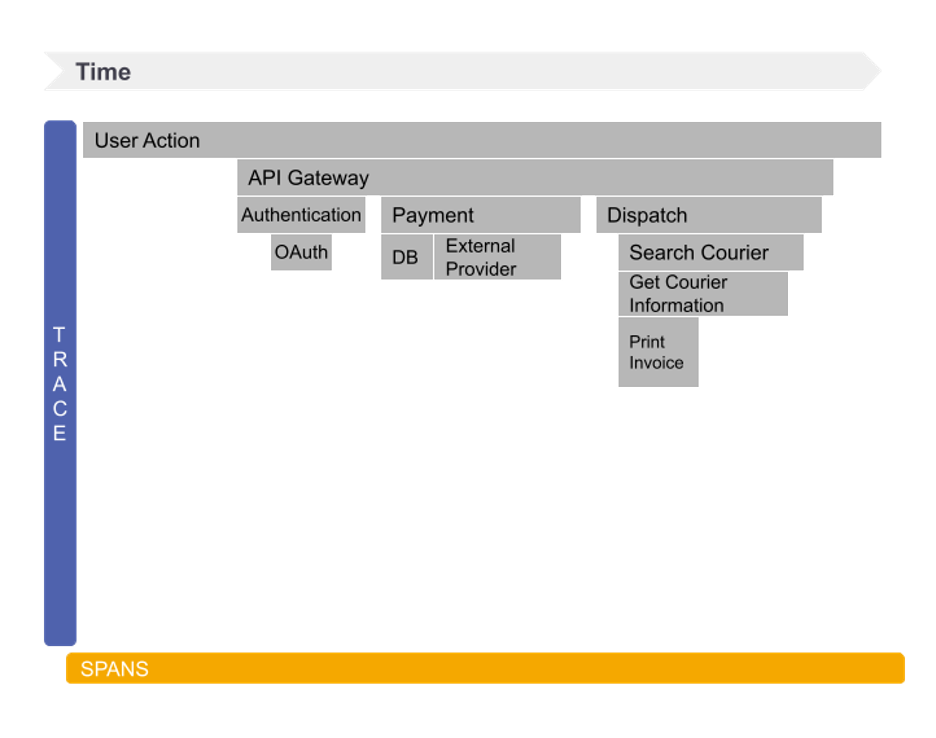
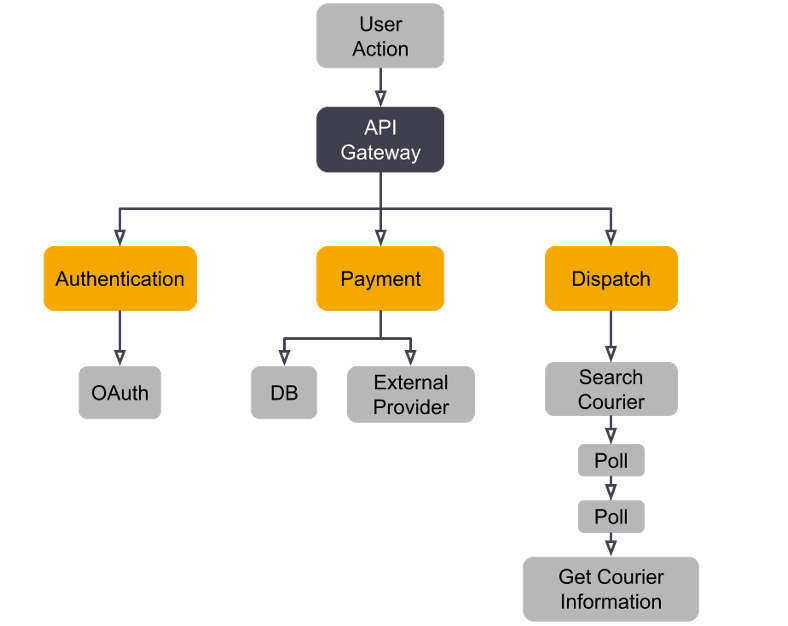
A distributed tracing system collects data as requests go from service to service, recording each segment as a span (or step) that contains the details and is combined into one trace. Once completed, a trace will represent the whole journey of a request as it flows through the system. The following image shows a flame chart, which is one of the preferred visualizations for traces. It shows the execution path from a system represented by Figure 5.
A span is, for example, the Search Courier action in the Dispatch microservice that has three child spans. By combining spans into a trace and exposing the child-parent relationship between them, it becomes possible to visualize the granularity of the trace, dependencies, and how long each dependency takes.
In practice, distributed tracing starts with a single request or transaction. Each request is marked with a unique ID that is often known as a trace or correlation ID that will identify, henceforth, that specific transaction by passing it in the request headers propagating trace context between subsequent requests.
Visualization and Reporting
Gathering and correlating all the data in a system is challenging, especially without the appropriate tools or techniques to visualize and process the telemetry in a meaningful manner, which is key. Being able to understand dependencies throughout the stack, as well as across services, processes, and hosts, gives observers and SRE teams the ability to predict and understand the topology of their service.
Creating a baseline for every system component, automating node discovery, and adding instrumentation to applications can help shift the focus from manual configuration and setup to proactive alerting and a reporting system based on the correlation of the data collected. In multi-cloud environments, applications can reach millions of components, which makes it especially challenging to understand the context between them. One way to visualize the relationships between these components is through topology maps.
Analyzing distributed traces is often one of the more effective ways to perform root cause analysis, for which there are some useful visualization aids that help profiling.
Flame or Icicle Charts
Flame or icicle charts help developers see the relationship between service calls and the impact on the overall single trace, like unusually high latency or errors and how they impact other calls and services. They represent each call on a distributed trace as a horizontal (see Figure 6) or vertical (see Figure 7) line that is time-stamped and contains details for each span.

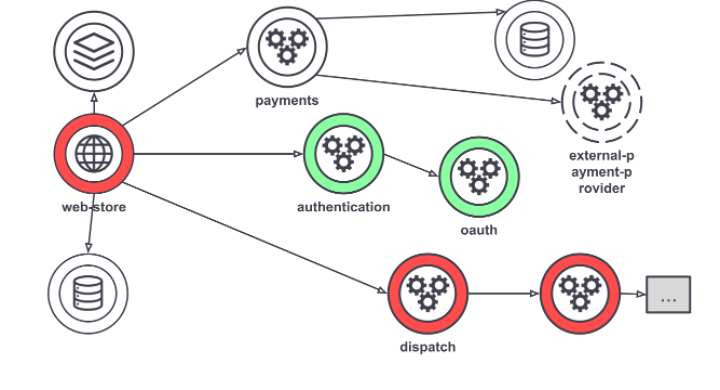
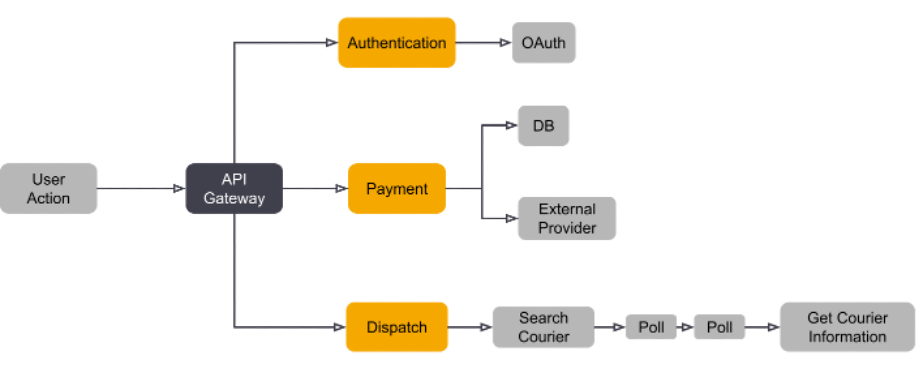
Trace Map
A trace map shows the connection between spans and allows one to quickly understand the relation between services.
Trace Tree
A trace tree is similar to a trace map but is represented vertically with the parent span as the root node.
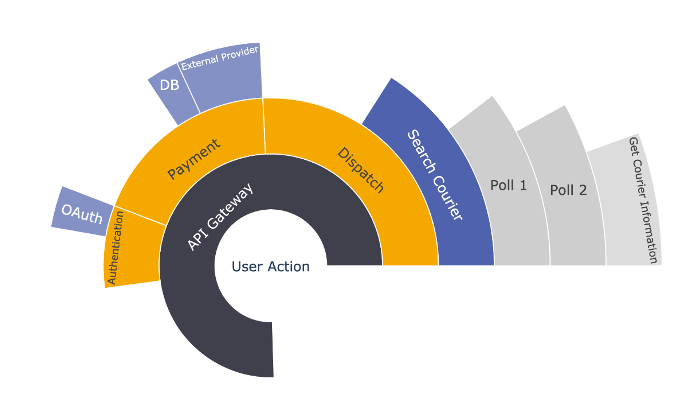
Sunburst Diagram
A sunburst burst diagram represents a trace using a set of rings and semi-rings. The circle is the parent span and the semirings fanned out represent the parent-child relationship between them.
Telemetry Querying
Storing all telemetry from a system in one place is very powerful; however, IT teams need to be able to interrogate this data in order to answer meaningful questions. Luckily, teams are able to rely on query languages (like SQL, Kusto, etc.) for analysis. The intention of those query languages is to provide a read-only query request that will process the data and return a result. That result can then be used to create visualizations, conduct troubleshooting, perform business analysis, etc.
This is an example of a SQL query that will return the slowest operations within the last hour:
SELECT service,
span_name,
ROUND(
approx_percentile(0.95, percentile_agg(duration_ms))::numeric,
3
) as duration_p95,
ROUND(avg(duration_ms)::numeric, 3) as duration_avg
FROM span
WHERE start_time > NOW() - INTERVAL '1 hour'
AND parent_span_id = 0
GROUP BY service,
span_name
ORDER BY duration_p95 DESC
LIMIT 10
And the result would be:
service
span_name
duration_p95
duration_avg
frontend
/cart/checkout
25000
dispatch
/calculateVat
10000
auth
/login
frontend
/
frontend
/product/{id}
frontend
/cart
checkout
/generateInvoice
frontend
/setCurrency
payment
/getPaymentPage
dispatch
/getAvailableCourier
Based on this information, we can immediately verify that there is a performance issue in the frontend service for the /cart/checkout endpoint, because although the average can be considered good (500 ms), at least 5% of the users will have a poor experience (~25 seconds). Having the ability to use querying languages to crunch this data and to correlate it is very powerful. In the example above, we could cross the information of the slowest operations in the problematic endpoint with metrics like CPU usage, memory consumption, etc. Combining OpenTelemetry with the flexibility of a powerful query language allows users to gain more value from the telemetry stored.
Recommend
About Joyk
Aggregate valuable and interesting links.
Joyk means Joy of geeK