

Blazing Performance with Flame Graphs
source link: https://www.slideshare.net/brendangregg/blazing-performance-with-flame-graphs
Go to the source link to view the article. You can view the picture content, updated content and better typesetting reading experience. If the link is broken, please click the button below to view the snapshot at that time.

Blazing Performance with Flame Graphs
1. Blazing Performance with Flame Graphs Brendan Gregg
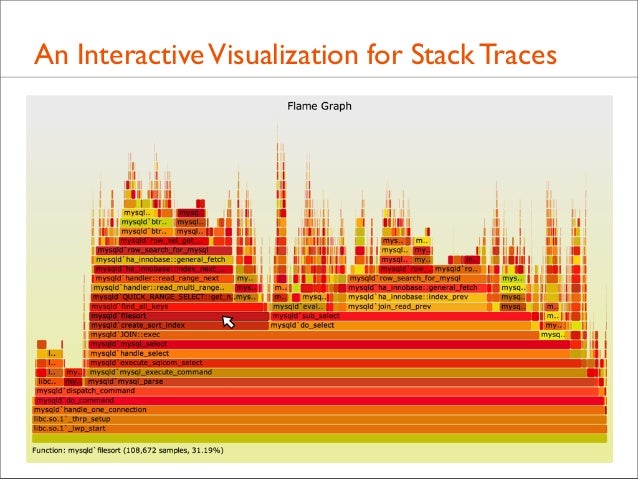
2. An Interactive Visualization for Stack Traces
3. My Previous Visualizations Include • Latency Heat Maps (and other heat map types), including:
• Quotes from LISA'13 yesterday: •
"Heat maps are a wonderful thing, use them" – Caskey Dickson
•
"If you do distributed systems, you need this" – Theo Schlossnagle
• I did heat maps and visualizations in my LISA'10 talk
4. Audience • This is for developers, sysadmins, support staff, and performance engineers
• This is a skill-up for everyone: beginners to experts • This helps analyze all software: kernels and applications
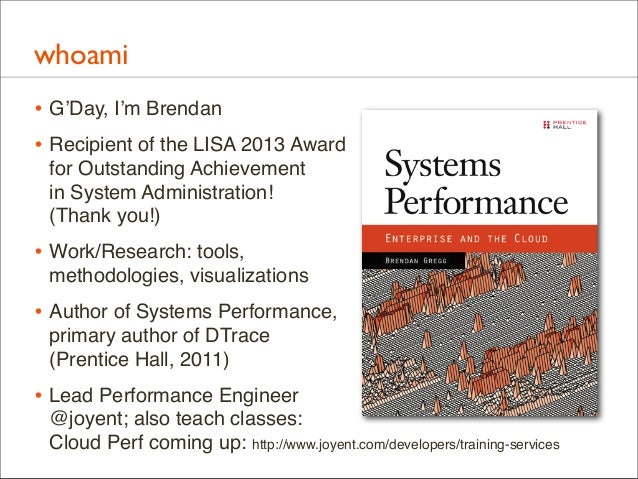
5. whoami • G’Day, I’m Brendan • Recipient of the LISA 2013 Award for Outstanding Achievement in System Administration! (Thank you!)
• Work/Research: tools, methodologies, visualizations
• Author of Systems Performance, primary author of DTrace (Prentice Hall, 2011)
• Lead Performance Engineer @joyent; also teach classes: Cloud Perf coming up: http://www.joyent.com/developers/training-services
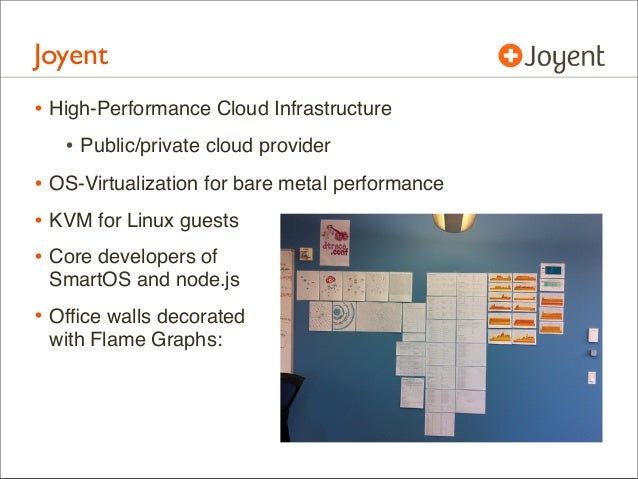
6. Joyent • High-Performance Cloud Infrastructure • Public/private cloud provider • OS-Virtualization for bare metal performance • KVM for Linux guests • Core developers of SmartOS and node.js
• Office walls decorated with Flame Graphs:
7. Agenda: Two Talks in One • 1. CPU Flame Graphs • Example • Background • Flame Graphs • Generation • Types: CPU • 2. Advanced Flame Graphs • Types: Memory, I/O, Off-CPU, Hot/Cold, Wakeup • Developments • SVG demos: https://github.com/brendangregg/FlameGraph/demos
8. CPU Flame Graphs
9. Example
10. Example • As a short example, I’ll describe the real world performance issue that led me to create flame graphs
• Then I’ll explain them in detail
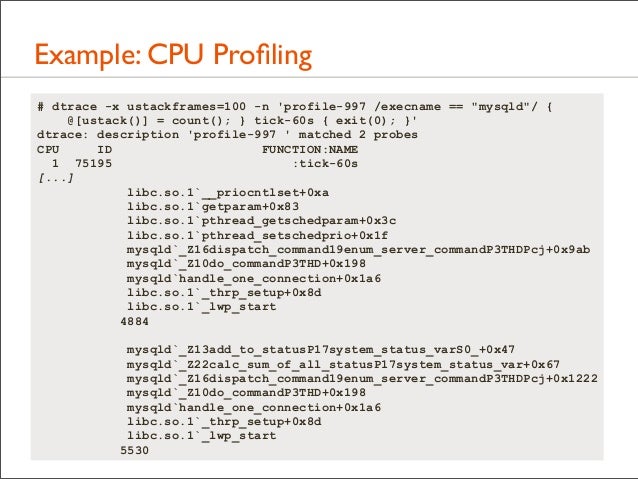
11. Example: The Problem • A production MySQL database had poor performance • It was a heavy CPU consumer, so I used a CPU profiler to see why. It sampled stack traces at timed intervals
• The profiler condensed its output by only printing unique stacks along with their occurrence counts, sorted by count
• The following shows the profiler command and the two most frequently sampled stacks...
12. Example: CPU Profiling # dtrace -x ustackframes=100 -n 'profile-997 /execname == "mysqld"/ { @[ustack()] = count(); } tick-60s { exit(0); }' dtrace: description 'profile-997 ' matched 2 probes CPU ID FUNCTION:NAME 1 75195 :tick-60s [...] libc.so.1`__priocntlset+0xa libc.so.1`getparam+0x83 libc.so.1`pthread_getschedparam+0x3c libc.so.1`pthread_setschedprio+0x1f mysqld`_Z16dispatch_command19enum_server_commandP3THDPcj+0x9ab mysqld`_Z10do_commandP3THD+0x198 mysqld`handle_one_connection+0x1a6 libc.so.1`_thrp_setup+0x8d libc.so.1`_lwp_start 4884 mysqld`_Z13add_to_statusP17system_status_varS0_+0x47 mysqld`_Z22calc_sum_of_all_statusP17system_status_var+0x67 mysqld`_Z16dispatch_command19enum_server_commandP3THDPcj+0x1222 mysqld`_Z10do_commandP3THD+0x198 mysqld`handle_one_connection+0x1a6 libc.so.1`_thrp_setup+0x8d libc.so.1`_lwp_start 5530
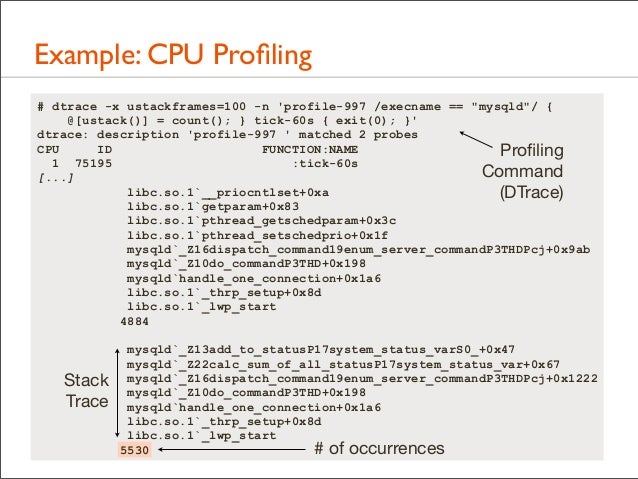
13. Example: CPU Profiling # dtrace -x ustackframes=100 -n 'profile-997 /execname == "mysqld"/ { @[ustack()] = count(); } tick-60s { exit(0); }' dtrace: description 'profile-997 ' matched 2 probes CPU ID FUNCTION:NAME Profiling 1 75195 :tick-60s Command [...] libc.so.1`__priocntlset+0xa (DTrace) libc.so.1`getparam+0x83 libc.so.1`pthread_getschedparam+0x3c libc.so.1`pthread_setschedprio+0x1f mysqld`_Z16dispatch_command19enum_server_commandP3THDPcj+0x9ab mysqld`_Z10do_commandP3THD+0x198 mysqld`handle_one_connection+0x1a6 libc.so.1`_thrp_setup+0x8d libc.so.1`_lwp_start 4884
Stack Trace
mysqld`_Z13add_to_statusP17system_status_varS0_+0x47 mysqld`_Z22calc_sum_of_all_statusP17system_status_var+0x67 mysqld`_Z16dispatch_command19enum_server_commandP3THDPcj+0x1222 mysqld`_Z10do_commandP3THD+0x198 mysqld`handle_one_connection+0x1a6 libc.so.1`_thrp_setup+0x8d libc.so.1`_lwp_start 5530 # of occurrences
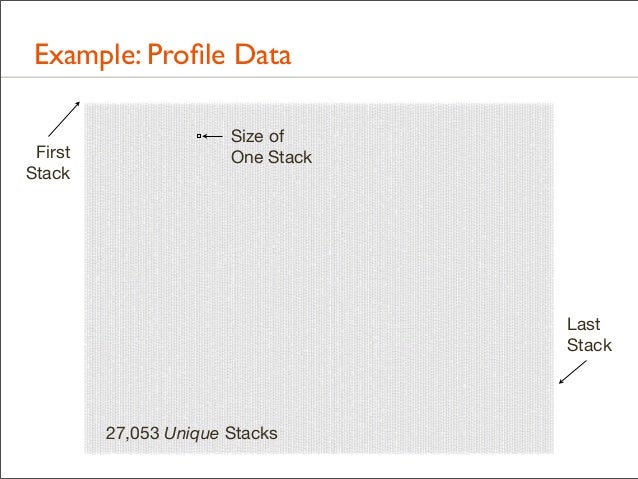
14. Example: Profile Data • Over 500,000 lines were elided from that output (“[...]”) • Full output looks like this...
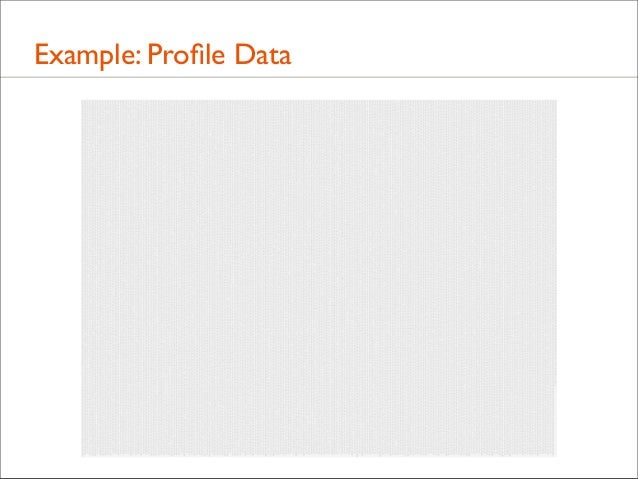
15. Example: Profile Data
60 seconds of on-CPU MySQL
16. Example: Profile Data First Stack
Size of One Stack
Last Stack
27,053 Unique Stacks MySQL 60 seconds of on-CPU
17. Example: Profile Data • The most frequent stack, printed last, shows CPU usage in add_to_status(), which is from the “show status” command. Is that to blame?
• Hard to tell – it only accounts for < 2% of the samples • I wanted a way to quickly understand stack trace profile data, without browsing 500,000+ lines of output
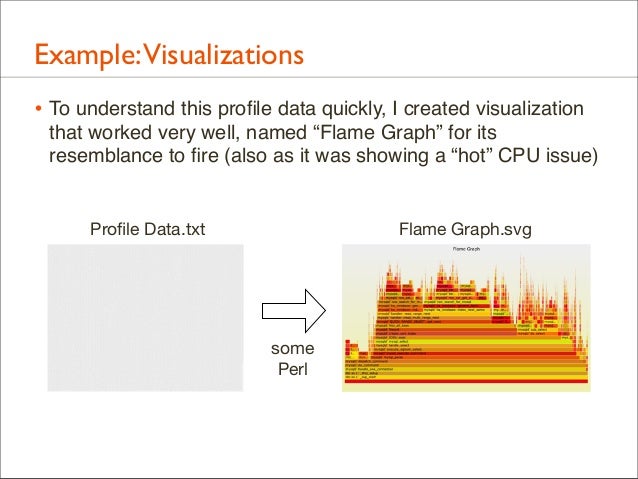
18. Example:Visualizations • To understand this profile data quickly, I created visualization that worked very well, named “Flame Graph” for its resemblance to fire (also as it was showing a “hot” CPU issue)
Profile Data.txt
Flame Graph.svg
some Perl
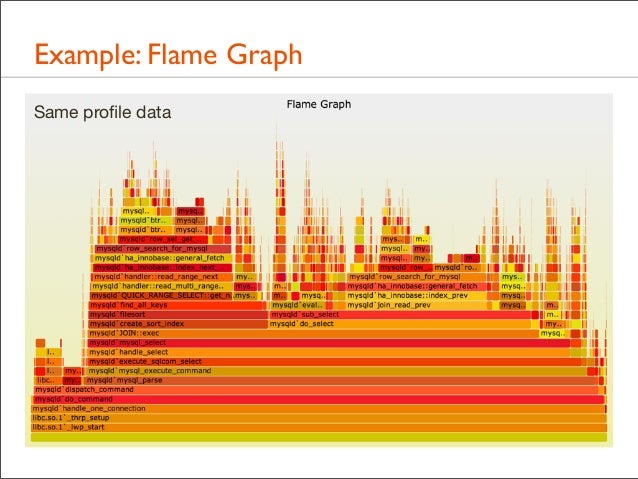
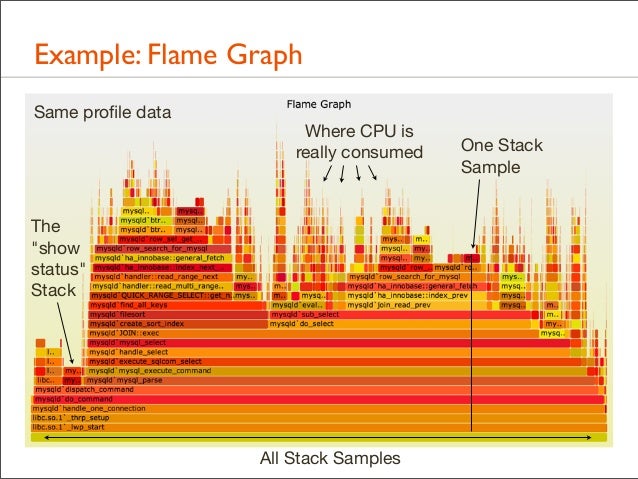
19. Example: Flame Graph Same profile data
20. Example: Flame Graph Same profile data
Where CPU is really consumed
The "show status" Stack
All Stack Samples
One Stack Sample
21. Example: Flame Graph • All data in one picture • Interactive using JavaScript and a browser: mouse overs • Stack elements that are frequent can be seen, read, and compared visually. Frame width is relative to sample count
• CPU usage was now understood properly and quickly, leading to a 40% performance win
22. Background
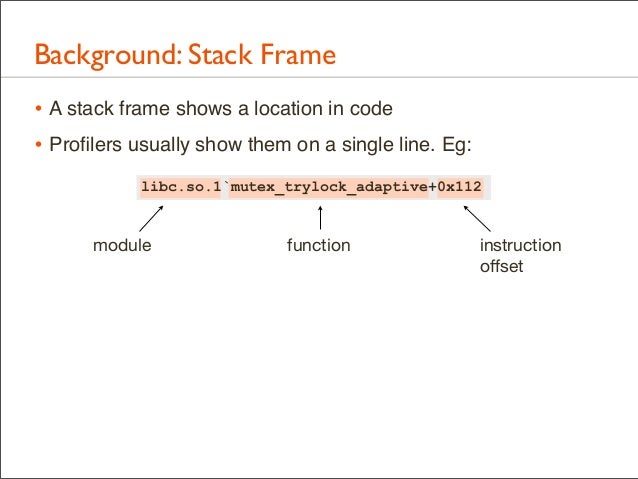
23. Background: Stack Frame • A stack frame shows a location in code • Profilers usually show them on a single line. Eg: libc.so.1`mutex_trylock_adaptive+0x112
module
function
instruction offset
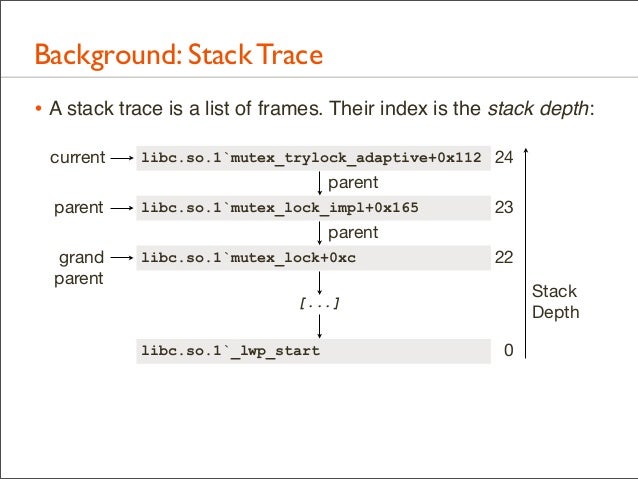
24. Background: Stack Trace • A stack trace is a list of frames. Their index is the stack depth: current
libc.so.1`mutex_trylock_adaptive+0x112 24
parent parent
libc.so.1`mutex_lock_impl+0x165
23
parent grand parent
libc.so.1`mutex_lock+0xc
22 Stack Depth
[...] libc.so.1`_lwp_start
0
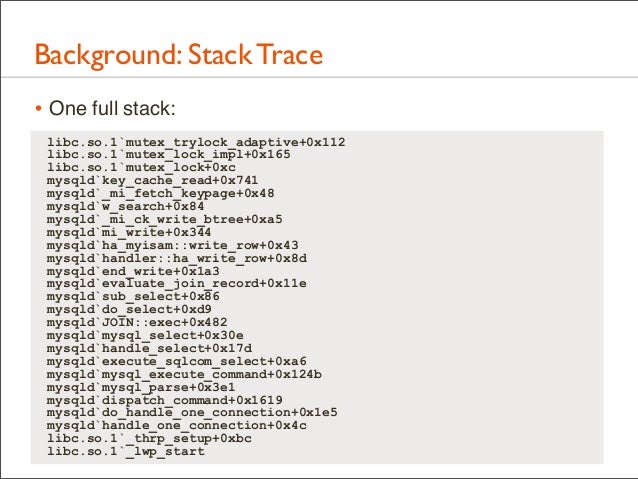
25. Background: Stack Trace • One full stack: libc.so.1`mutex_trylock_adaptive+0x112 libc.so.1`mutex_lock_impl+0x165 libc.so.1`mutex_lock+0xc mysqld`key_cache_read+0x741 mysqld`_mi_fetch_keypage+0x48 mysqld`w_search+0x84 mysqld`_mi_ck_write_btree+0xa5 mysqld`mi_write+0x344 mysqld`ha_myisam::write_row+0x43 mysqld`handler::ha_write_row+0x8d mysqld`end_write+0x1a3 mysqld`evaluate_join_record+0x11e mysqld`sub_select+0x86 mysqld`do_select+0xd9 mysqld`JOIN::exec+0x482 mysqld`mysql_select+0x30e mysqld`handle_select+0x17d mysqld`execute_sqlcom_select+0xa6 mysqld`mysql_execute_command+0x124b mysqld`mysql_parse+0x3e1 mysqld`dispatch_command+0x1619 mysqld`do_handle_one_connection+0x1e5 mysqld`handle_one_connection+0x4c libc.so.1`_thrp_setup+0xbc libc.so.1`_lwp_start
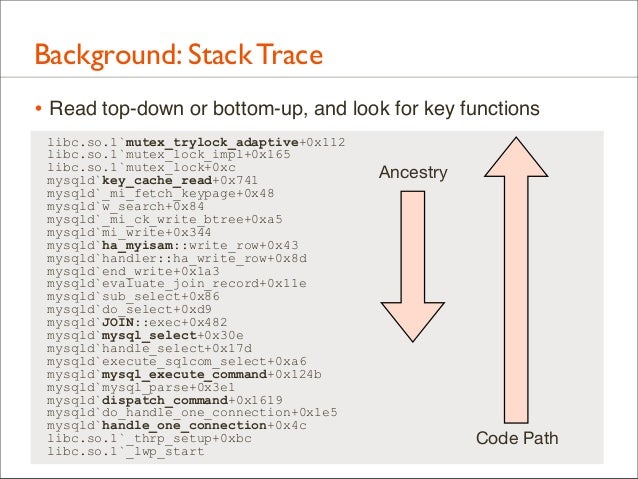
26. Background: Stack Trace • Read top-down or bottom-up, and look for key functions libc.so.1`mutex_trylock_adaptive+0x112 libc.so.1`mutex_lock_impl+0x165 libc.so.1`mutex_lock+0xc mysqld`key_cache_read+0x741 mysqld`_mi_fetch_keypage+0x48 mysqld`w_search+0x84 mysqld`_mi_ck_write_btree+0xa5 mysqld`mi_write+0x344 mysqld`ha_myisam::write_row+0x43 mysqld`handler::ha_write_row+0x8d mysqld`end_write+0x1a3 mysqld`evaluate_join_record+0x11e mysqld`sub_select+0x86 mysqld`do_select+0xd9 mysqld`JOIN::exec+0x482 mysqld`mysql_select+0x30e mysqld`handle_select+0x17d mysqld`execute_sqlcom_select+0xa6 mysqld`mysql_execute_command+0x124b mysqld`mysql_parse+0x3e1 mysqld`dispatch_command+0x1619 mysqld`do_handle_one_connection+0x1e5 mysqld`handle_one_connection+0x4c libc.so.1`_thrp_setup+0xbc libc.so.1`_lwp_start
Ancestry
Code Path
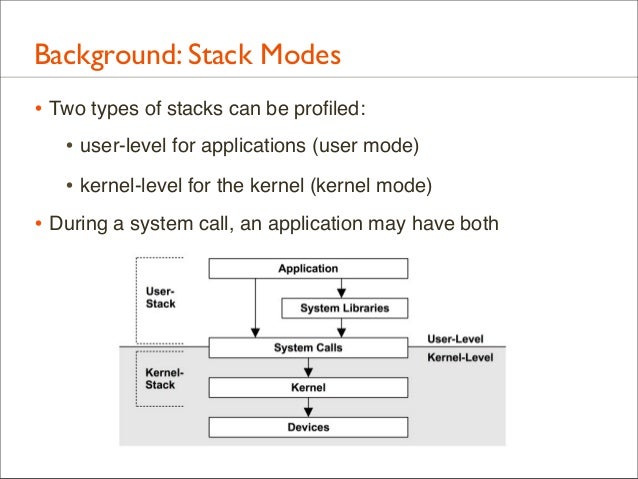
27. Background: Stack Modes • Two types of stacks can be profiled: • user-level for applications (user mode) • kernel-level for the kernel (kernel mode) • During a system call, an application may have both
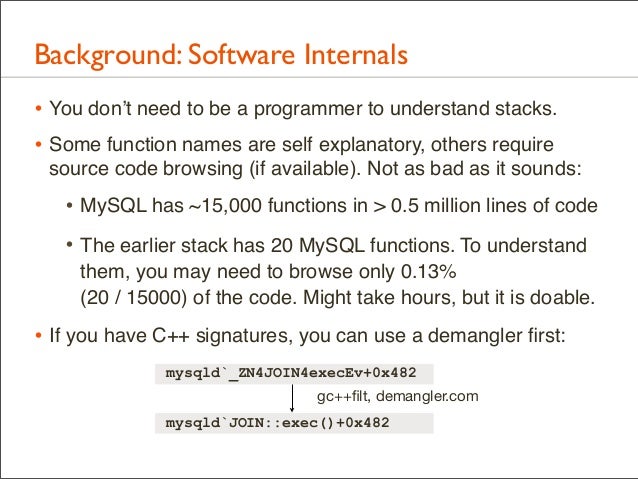
28. Background: Software Internals • You don’t need to be a programmer to understand stacks. • Some function names are self explanatory, others require source code browsing (if available). Not as bad as it sounds:
• MySQL has ~15,000 functions in > 0.5 million lines of code • The earlier stack has 20 MySQL functions. To understand them, you may need to browse only 0.13% (20 / 15000) of the code. Might take hours, but it is doable.
• If you have C++ signatures, you can use a demangler first: mysqld`_ZN4JOIN4execEv+0x482 gc++filt, demangler.com mysqld`JOIN::exec()+0x482
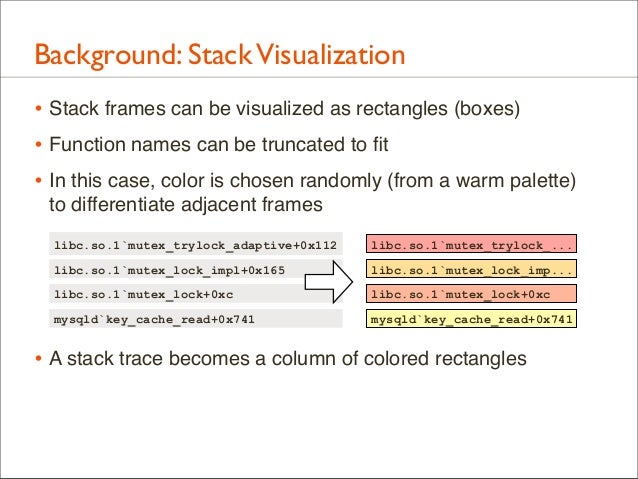
29. Background: Stack Visualization • Stack frames can be visualized as rectangles (boxes) • Function names can be truncated to fit • In this case, color is chosen randomly (from a warm palette) to differentiate adjacent frames libc.so.1`mutex_trylock_adaptive+0x112
libc.so.1`mutex_trylock_...
libc.so.1`mutex_lock_impl+0x165
libc.so.1`mutex_lock_imp...
libc.so.1`mutex_lock+0xc
libc.so.1`mutex_lock+0xc
mysqld`key_cache_read+0x741
mysqld`key_cache_read+0x741
• A stack trace becomes a column of colored rectangles
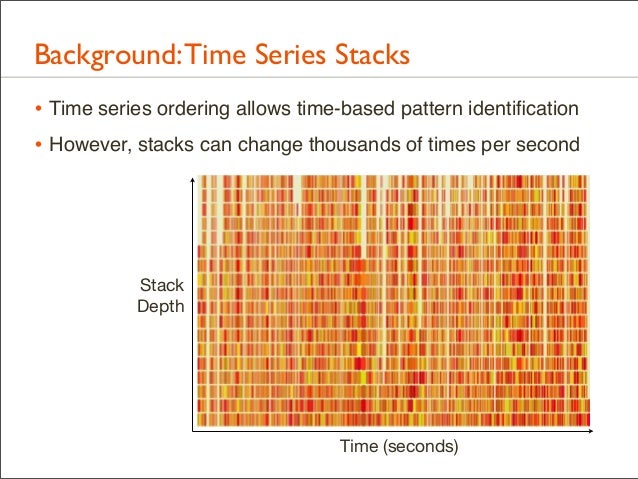
30. Background: Time Series Stacks • Time series ordering allows time-based pattern identification • However, stacks can change thousands of times per second
Stack Depth
Time (seconds)
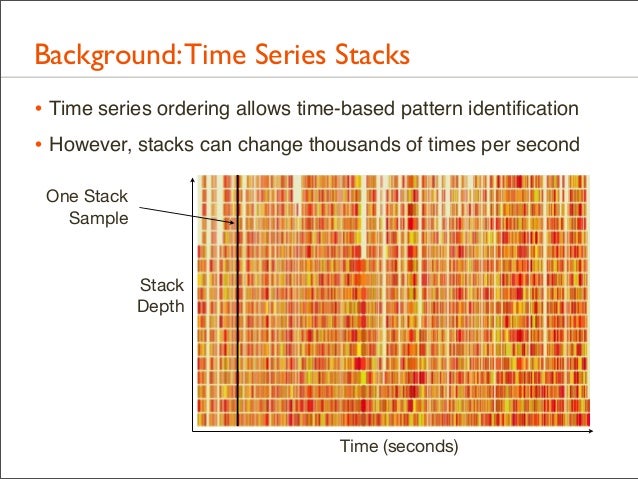
31. Background: Time Series Stacks • Time series ordering allows time-based pattern identification • However, stacks can change thousands of times per second One Stack Sample
Stack Depth
Time (seconds)
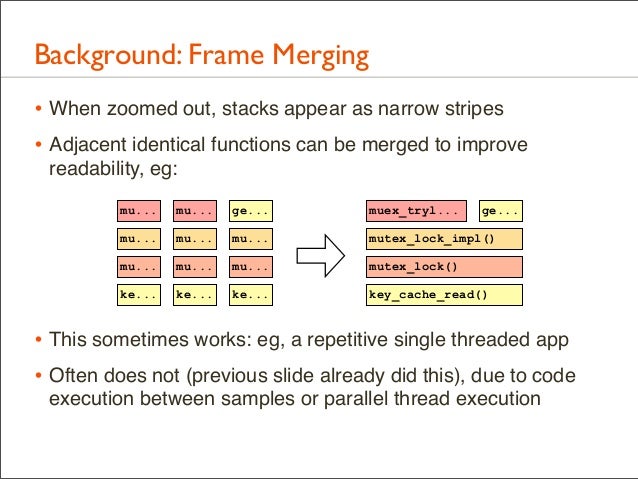
32. Background: Frame Merging • When zoomed out, stacks appear as narrow stripes • Adjacent identical functions can be merged to improve readability, eg: mu...
mu...
ge...
muex_tryl...
ge...
mu...
mu...
mu...
mutex_lock_impl()
mu...
mu...
mu...
mutex_lock()
ke...
ke...
ke...
key_cache_read()
• This sometimes works: eg, a repetitive single threaded app • Often does not (previous slide already did this), due to code execution between samples or parallel thread execution
33. Background: Frame Merging • Time-series ordering isn’t necessary for the primary use case: identify the most common (“hottest”) code path or paths
• By using a different x-axis sort order, frame merging can be greatly improved...
34. Flame Graphs
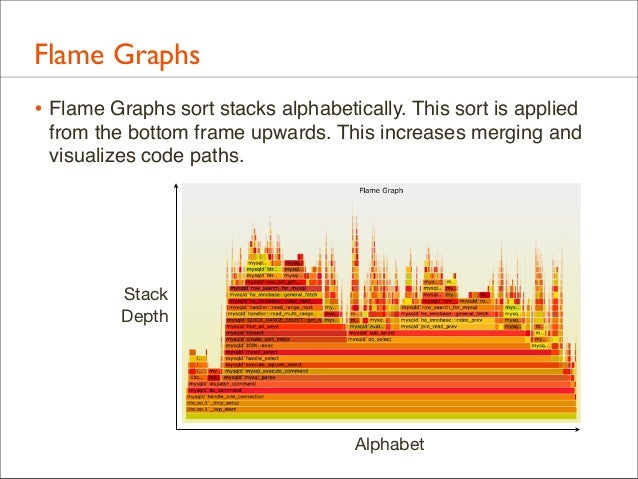
35. Flame Graphs • Flame Graphs sort stacks alphabetically. This sort is applied from the bottom frame upwards. This increases merging and visualizes code paths.
Stack Depth
Alphabet
36. Flame Graphs: Definition • Each box represents a function (a merged stack frame) • y-axis shows stack depth • top function led directly to the profiling event • everything beneath it is ancestry (explains why) • x-axis spans the sample population, sorted alphabetically • Box width is proportional to the total time a function was profiled directly or its children were profiled
• All threads can be shown in the same Flame Graph (the default), or as separate per-thread Flame Graphs
• Flame Graphs can be interactive: mouse over for details
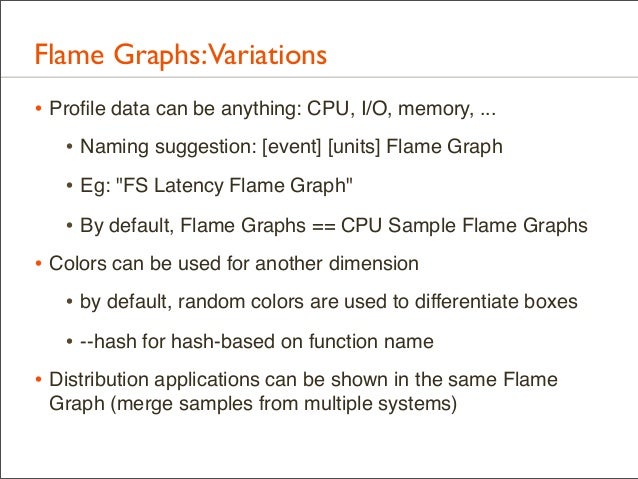
37. Flame Graphs:Variations • Profile data can be anything: CPU, I/O, memory, ... • Naming suggestion: [event] [units] Flame Graph • Eg: "FS Latency Flame Graph" • By default, Flame Graphs == CPU Sample Flame Graphs • Colors can be used for another dimension • by default, random colors are used to differentiate boxes • --hash for hash-based on function name • Distribution applications can be shown in the same Flame Graph (merge samples from multiple systems)
38. Flame Graphs: A Simple Example • A CPU Sample Flame Graph: f() d()
e()
c()
h()
b()
g()
a()
• I’ll illustrate how these are read by posing various questions
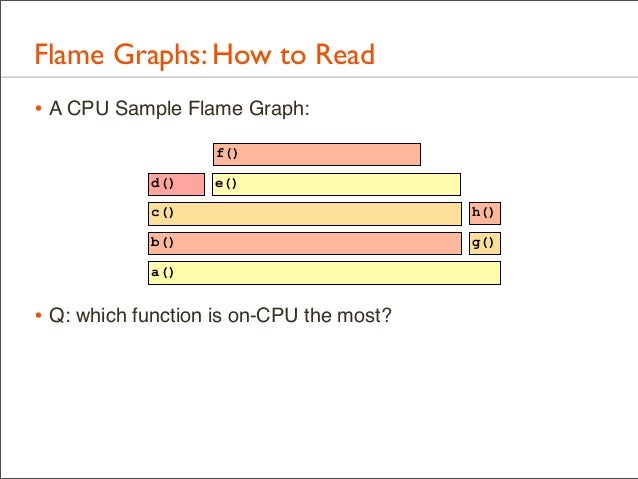
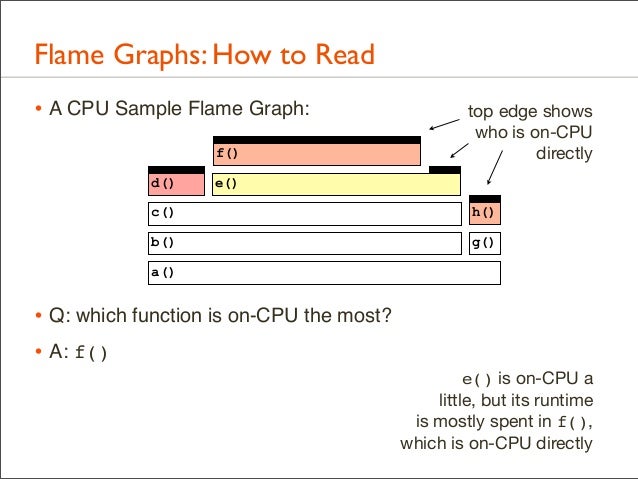
39. Flame Graphs: How to Read • A CPU Sample Flame Graph: f() d()
e()
c()
h()
b()
g()
a()
• Q: which function is on-CPU the most?
40. Flame Graphs: How to Read • A CPU Sample Flame Graph: f() d()
top edge shows who is on-CPU directly
e()
c()
h()
b()
g()
a()
• Q: which function is on-CPU the most? • A: f() e() is on-CPU a little, but its runtime is mostly spent in f(), which is on-CPU directly
41. Flame Graphs: How to Read • A CPU Sample Flame Graph: f() d()
e()
c()
h()
b()
g()
a()
• Q: why is f() on-CPU?
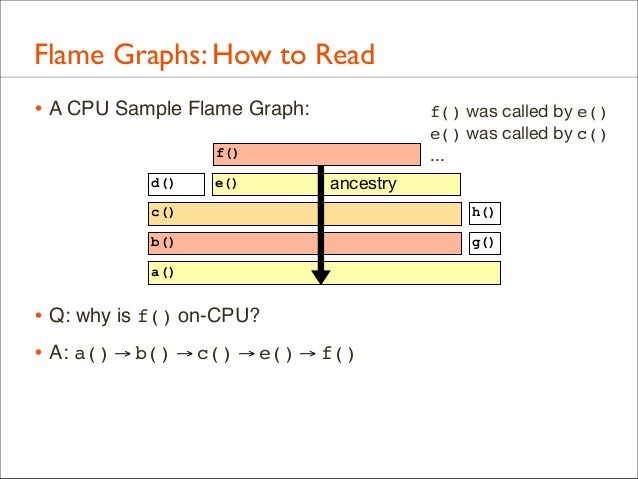
42. Flame Graphs: How to Read • A CPU Sample Flame Graph:
f() was called by e() e() was called by c() ...
f() d()
e()
ancestry
c()
h()
b()
g()
a()
• Q: why is f() on-CPU? • A: a() → b() → c() → e() → f()
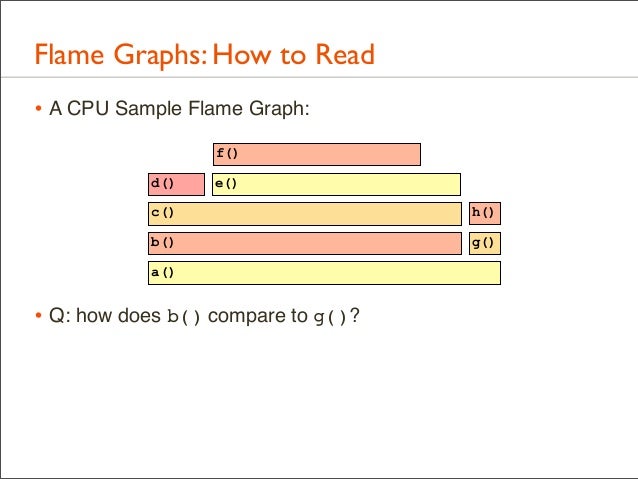
43. Flame Graphs: How to Read • A CPU Sample Flame Graph: f() d()
e()
c()
h()
b()
g()
a()
• Q: how does b() compare to g()?
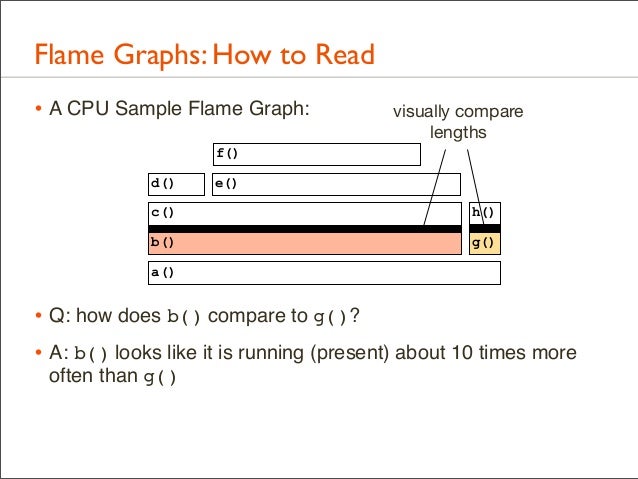
44. Flame Graphs: How to Read • A CPU Sample Flame Graph:
visually compare lengths
f() d()
e()
c()
h()
b()
g()
a()
• Q: how does b() compare to g()? • A: b() looks like it is running (present) about 10 times more often than g()
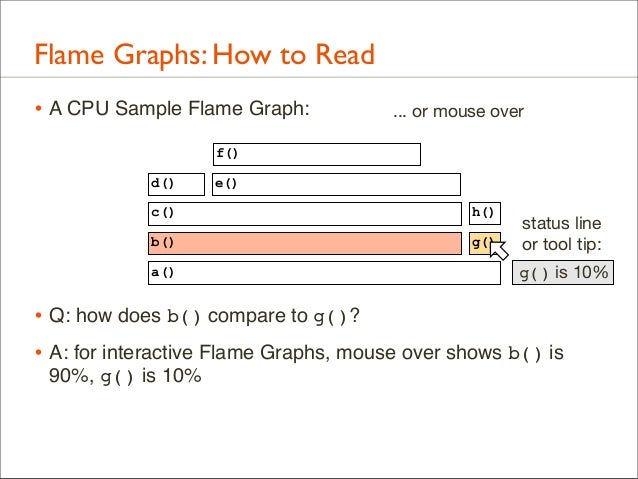
45. Flame Graphs: How to Read • A CPU Sample Flame Graph:
... or mouse over
f() d()
e()
c()
h()
b()
g()
a()
status line or tool tip: b() is 90%
• Q: how does b() compare to g()? • A: for interactive Flame Graphs, mouse over shows b() is 90%, g() is 10%
46. Flame Graphs: How to Read • A CPU Sample Flame Graph:
... or mouse over
f() d()
e()
c()
h()
b()
g()
a()
status line or tool tip: g() is 10%
• Q: how does b() compare to g()? • A: for interactive Flame Graphs, mouse over shows b() is 90%, g() is 10%
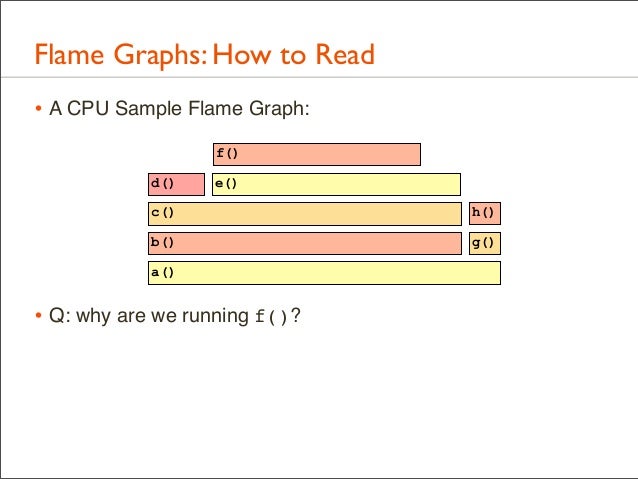
47. Flame Graphs: How to Read • A CPU Sample Flame Graph: f() d()
e()
c()
h()
b()
g()
a()
• Q: why are we running f()?
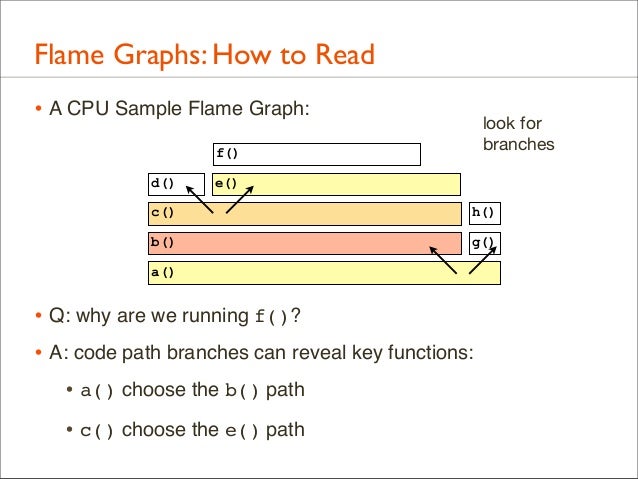
48. Flame Graphs: How to Read • A CPU Sample Flame Graph:
look for branches
f() d()
e()
c()
h()
b()
g()
a()
• Q: why are we running f()? • A: code path branches can reveal key functions: • a() choose the b() path • c() choose the e() path
49. Flame Graphs: Example 1 • Customer alerting software periodically checks a log, however, it is taking too long (minutes).
• It includes grep(1) of an ~18 Mbyte log file, which takes around 10 minutes!
• grep(1) appears to be on-CPU for this time. Why?
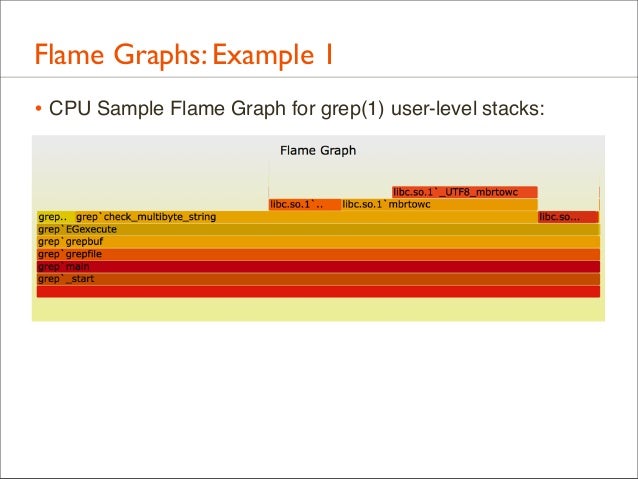
50. Flame Graphs: Example 1 • CPU Sample Flame Graph for grep(1) user-level stacks:
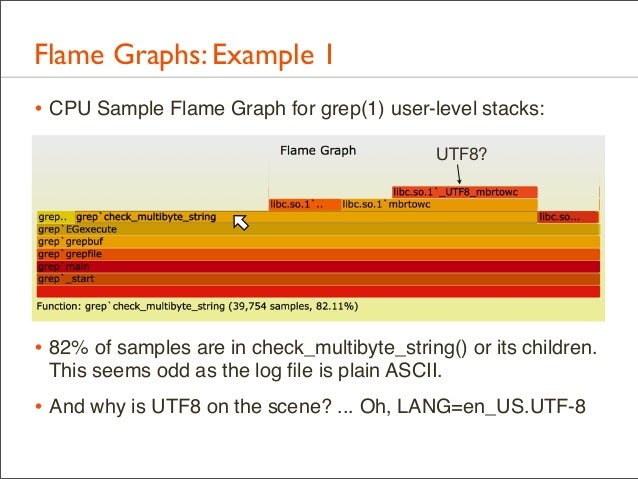
51. Flame Graphs: Example 1 • CPU Sample Flame Graph for grep(1) user-level stacks: UTF8?
• 82% of samples are in check_multibyte_string() or its children. This seems odd as the log file is plain ASCII.
• And why is UTF8 on the scene? ... Oh, LANG=en_US.UTF-8
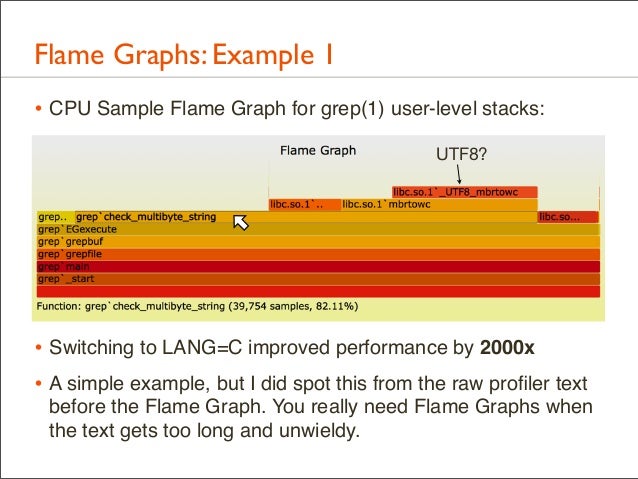
52. Flame Graphs: Example 1 • CPU Sample Flame Graph for grep(1) user-level stacks: UTF8?
• Switching to LANG=C improved performance by 2000x • A simple example, but I did spot this from the raw profiler text before the Flame Graph. You really need Flame Graphs when the text gets too long and unwieldy.
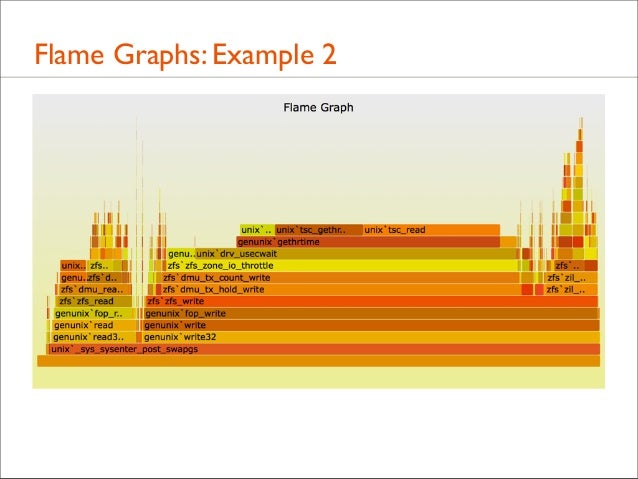
53. Flame Graphs: Example 2 • A potential customer benchmarks disk I/O on a cloud instance. The performance is not as fast as hoped.
• The host has new hardware and software. Issues with the new type of disks is suspected.
54. Flame Graphs: Example 2 • A potential customer benchmarks disk I/O on a cloud instance. The performance is not as fast as hoped.
• The host has new hardware and software. Issues with the new type of disks is suspected.
• I take a look, and notice CPU time in the kernel is modest. • I’d normally assume this was I/O overheads and not profile it yet, instead beginning with I/O latency analysis.
• But Flame Graphs make it easy, and it may be useful to see what code paths (illumos kernel) are on the table.
55. Flame Graphs: Example 2
56. Flame Graphs: Example 2
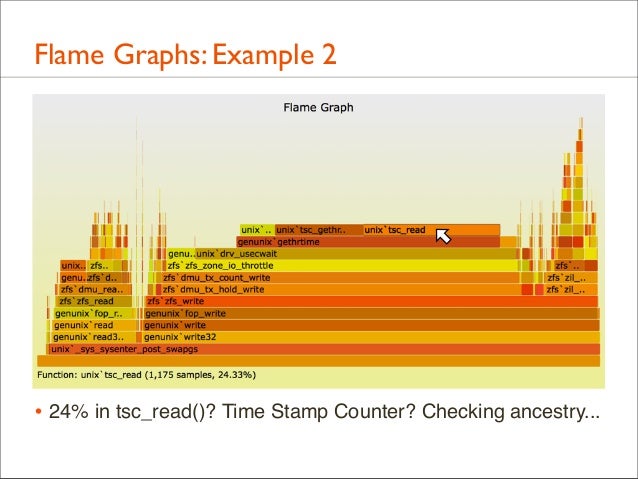
• 24% in tsc_read()? Time Stamp Counter? Checking ancestry...
57. Flame Graphs: Example 2
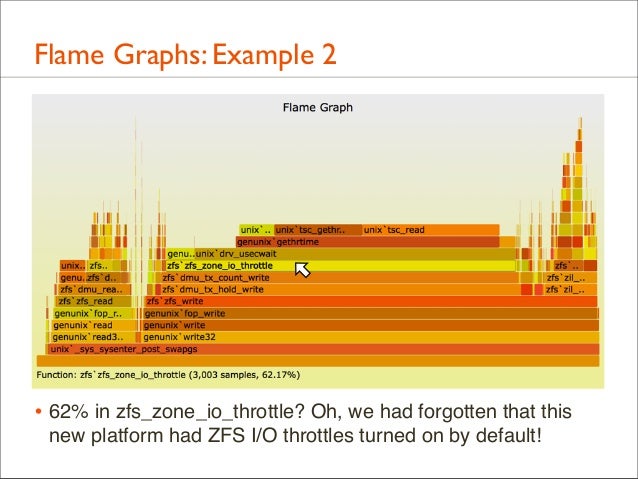
• 62% in zfs_zone_io_throttle? Oh, we had forgotten that this new platform had ZFS I/O throttles turned on by default!
58. Flame Graphs: Example 3 • Application performance is about half that of a competitor • Everything is believed identical (H/W, application, config, workload) except for the OS and kernel
• Application is CPU busy, nearly 100% in user-mode. How can the kernel cause a 2x delta when the app isn't in kernel-mode?
• Flame graphs on both platforms for user-mode were created: • Linux, using perf • SmartOS, using DTrace • Added flamegraph.pl --hash option for consistent function colors (not random), aiding comparisons
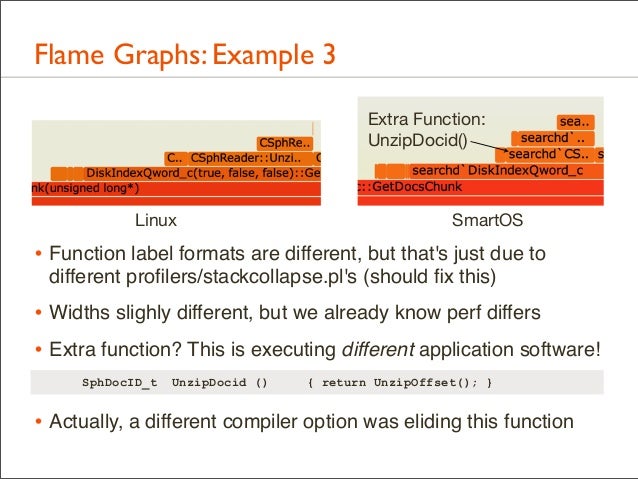
59. Flame Graphs: Example 3 Extra Function: UnzipDocid()
Linux
SmartOS
• Function label formats are different, but that's just due to different profilers/stackcollapse.pl's (should fix this)
• Widths slighly different, but we already know perf differs • Extra function? This is executing different application software! SphDocID_t
UnzipDocid ()
{ return UnzipOffset(); }
• Actually, a different compiler option was eliding this function
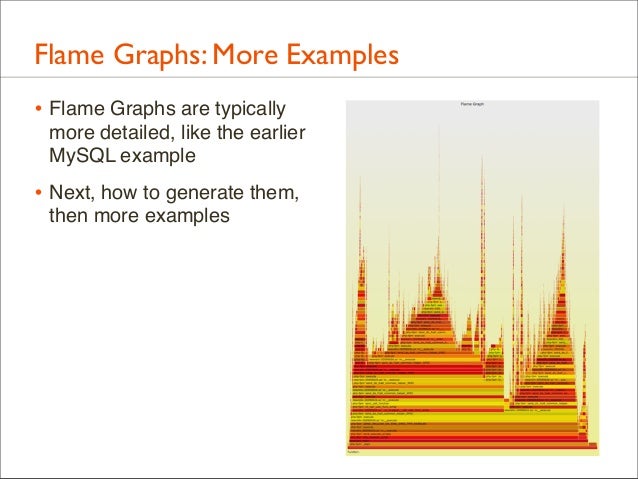
60. Flame Graphs: More Examples • Flame Graphs are typically more detailed, like the earlier MySQL example
• Next, how to generate them, then more examples
61. Generation
62. Generation • I’ll describe the original Perl version I wrote and shared on github:
•
https://github.com/brendangregg/FlameGraph
• There are other great Flame Graph implementations with different features and usage, which I’ll cover in the last section
63. Generation: Steps • 1. Profile event of interest • 2. stackcollapse.pl • 3. flamegraph.pl
64. Generation: Overview • Full command line example. This uses DTrace for CPU profiling of the kernel: # dtrace -x stackframes=100 -n 'profile-997 /arg0/ { @[stack()] = count(); } tick-60s { exit(0); }' -o out.stacks # stackcollapse.pl < out.stacks > out.folded # flamegraph.pl < out.folded > out.svg
• Then, open out.svg in a browser • Intermediate files could be avoided (piping), but they can be handy for some manual processing if needed (eg, using vi)
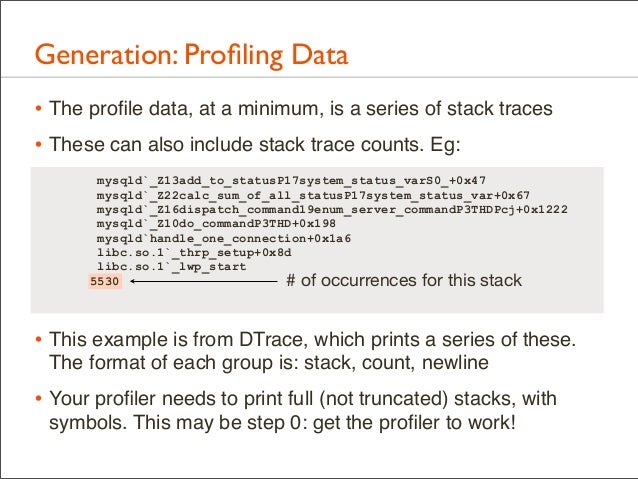
65. Generation: Profiling Data • The profile data, at a minimum, is a series of stack traces • These can also include stack trace counts. Eg: mysqld`_Z13add_to_statusP17system_status_varS0_+0x47 mysqld`_Z22calc_sum_of_all_statusP17system_status_var+0x67 mysqld`_Z16dispatch_command19enum_server_commandP3THDPcj+0x1222 mysqld`_Z10do_commandP3THD+0x198 mysqld`handle_one_connection+0x1a6 libc.so.1`_thrp_setup+0x8d libc.so.1`_lwp_start 5530 # of occurrences for this stack
• This example is from DTrace, which prints a series of these. The format of each group is: stack, count, newline
• Your profiler needs to print full (not truncated) stacks, with symbols. This may be step 0: get the profiler to work!
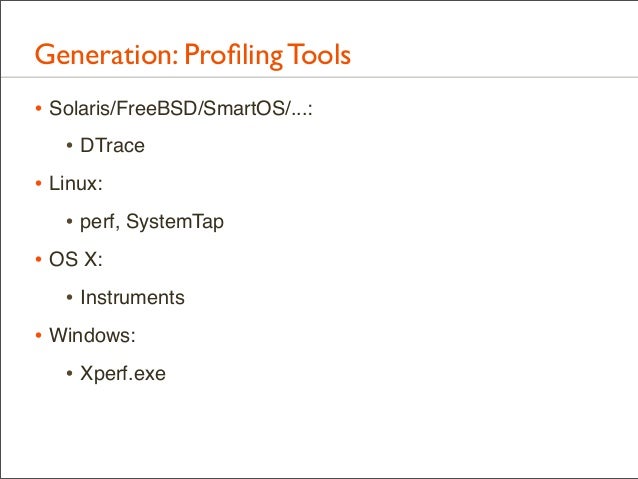
66. Generation: Profiling Tools • Solaris/FreeBSD/SmartOS/...: • DTrace • Linux: • perf, SystemTap • OS X: • Instruments • Windows: • Xperf.exe
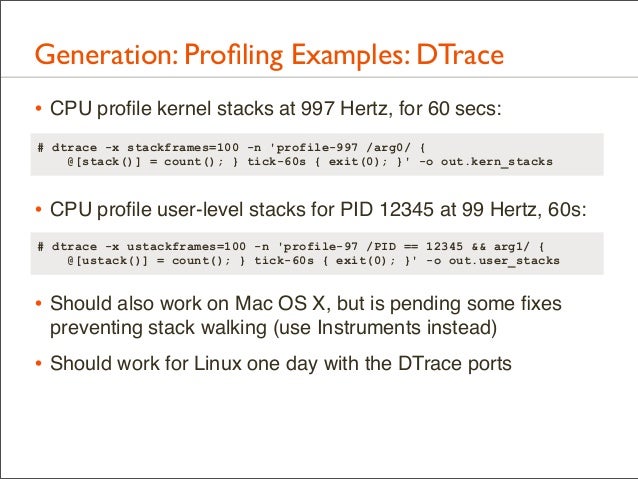
67. Generation: Profiling Examples: DTrace • CPU profile kernel stacks at 997 Hertz, for 60 secs: # dtrace -x stackframes=100 -n 'profile-997 /arg0/ { @[stack()] = count(); } tick-60s { exit(0); }' -o out.kern_stacks
• CPU profile user-level stacks for PID 12345 at 99 Hertz, 60s: # dtrace -x ustackframes=100 -n 'profile-97 /PID == 12345 && arg1/ { @[ustack()] = count(); } tick-60s { exit(0); }' -o out.user_stacks
• Should also work on Mac OS X, but is pending some fixes preventing stack walking (use Instruments instead)
• Should work for Linux one day with the DTrace ports
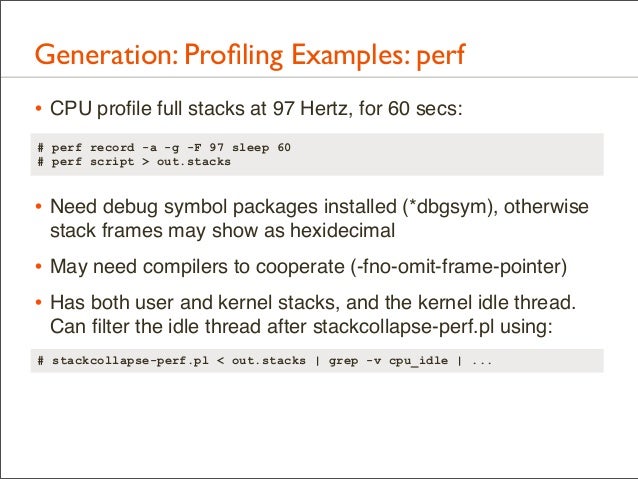
68. Generation: Profiling Examples: perf • CPU profile full stacks at 97 Hertz, for 60 secs: # perf record -a -g -F 97 sleep 60 # perf script > out.stacks
• Need debug symbol packages installed (*dbgsym), otherwise stack frames may show as hexidecimal
• May need compilers to cooperate (-fno-omit-frame-pointer) • Has both user and kernel stacks, and the kernel idle thread. Can filter the idle thread after stackcollapse-perf.pl using: # stackcollapse-perf.pl < out.stacks | grep -v cpu_idle | ...
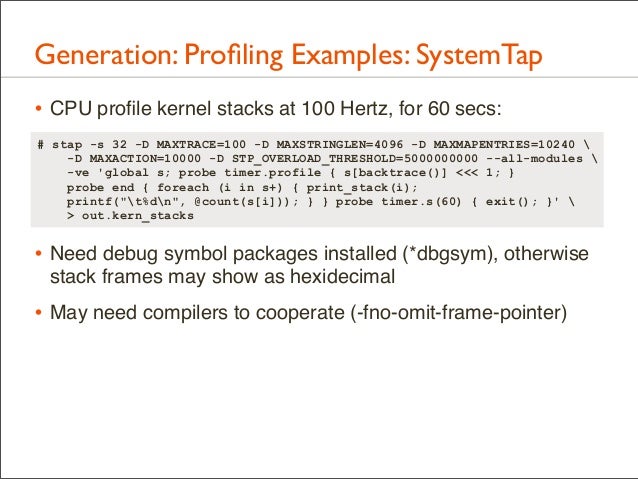
69. Generation: Profiling Examples: SystemTap • CPU profile kernel stacks at 100 Hertz, for 60 secs: # stap -s 32 -D MAXTRACE=100 -D MAXSTRINGLEN=4096 -D MAXMAPENTRIES=10240 -D MAXACTION=10000 -D STP_OVERLOAD_THRESHOLD=5000000000 --all-modules -ve 'global s; probe timer.profile { s[backtrace()] <<< 1; } probe end { foreach (i in s+) { print_stack(i); printf("t%dn", @count(s[i])); } } probe timer.s(60) { exit(); }' > out.kern_stacks
• Need debug symbol packages installed (*dbgsym), otherwise stack frames may show as hexidecimal
• May need compilers to cooperate (-fno-omit-frame-pointer)
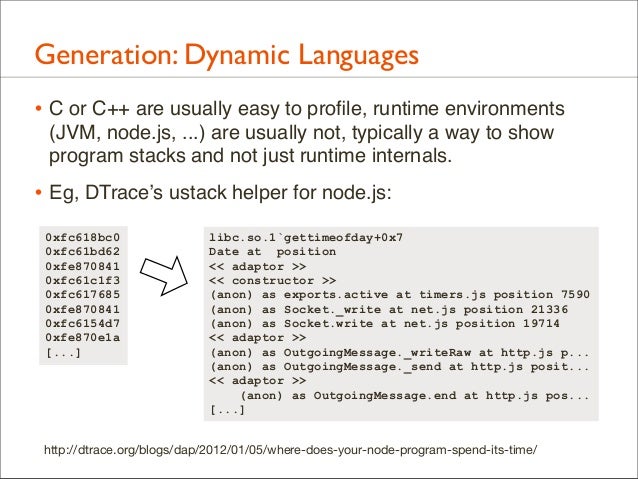
70. Generation: Dynamic Languages • C or C++ are usually easy to profile, runtime environments (JVM, node.js, ...) are usually not, typically a way to show program stacks and not just runtime internals.
• Eg, DTrace’s ustack helper for node.js: 0xfc618bc0 0xfc61bd62 0xfe870841 0xfc61c1f3 0xfc617685 0xfe870841 0xfc6154d7 0xfe870e1a [...]
libc.so.1`gettimeofday+0x7 Date at position << adaptor >> << constructor >> (anon) as exports.active at timers.js position 7590 (anon) as Socket._write at net.js position 21336 (anon) as Socket.write at net.js position 19714 << adaptor >> (anon) as OutgoingMessage._writeRaw at http.js p... (anon) as OutgoingMessage._send at http.js posit... << adaptor >> (anon) as OutgoingMessage.end at http.js pos... [...]
http://dtrace.org/blogs/dap/2012/01/05/where-does-your-node-program-spend-its-time/
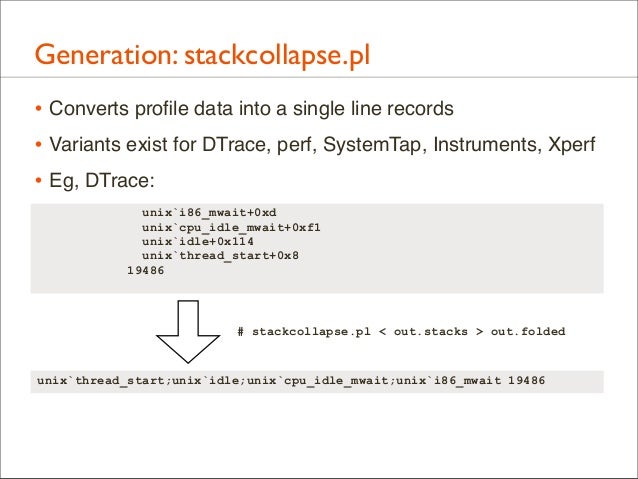
71. Generation: stackcollapse.pl • Converts profile data into a single line records • Variants exist for DTrace, perf, SystemTap, Instruments, Xperf • Eg, DTrace: unix`i86_mwait+0xd unix`cpu_idle_mwait+0xf1 unix`idle+0x114 unix`thread_start+0x8 19486
# stackcollapse.pl < out.stacks > out.folded
unix`thread_start;unix`idle;unix`cpu_idle_mwait;unix`i86_mwait 19486
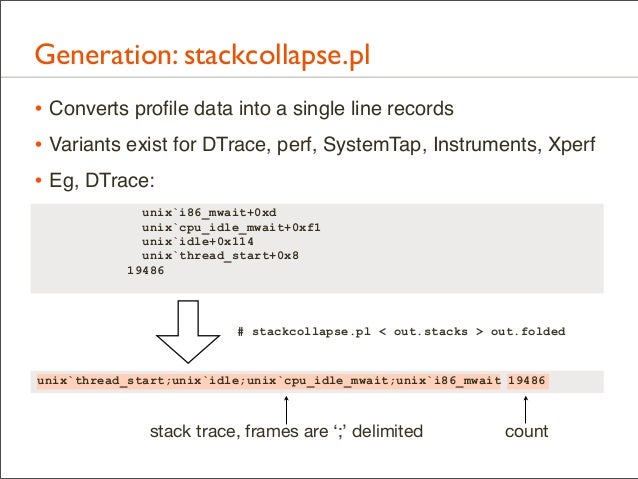
72. Generation: stackcollapse.pl • Converts profile data into a single line records • Variants exist for DTrace, perf, SystemTap, Instruments, Xperf • Eg, DTrace: unix`i86_mwait+0xd unix`cpu_idle_mwait+0xf1 unix`idle+0x114 unix`thread_start+0x8 19486
# stackcollapse.pl < out.stacks > out.folded
unix`thread_start;unix`idle;unix`cpu_idle_mwait;unix`i86_mwait 19486
stack trace, frames are ‘;’ delimited
count
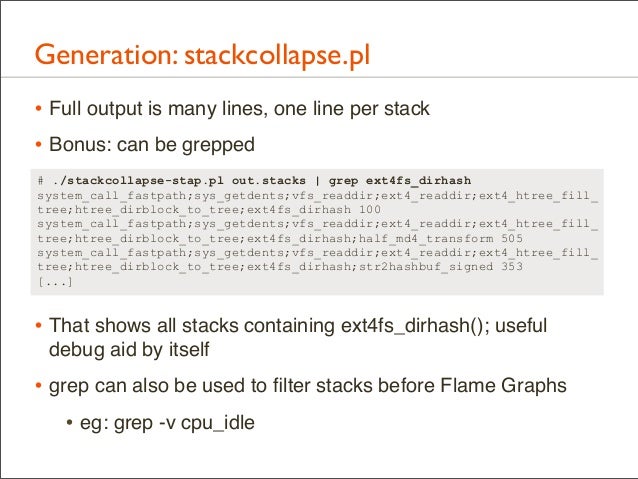
73. Generation: stackcollapse.pl • Full output is many lines, one line per stack • Bonus: can be grepped # ./stackcollapse-stap.pl out.stacks | grep ext4fs_dirhash system_call_fastpath;sys_getdents;vfs_readdir;ext4_readdir;ext4_htree_fill_ tree;htree_dirblock_to_tree;ext4fs_dirhash 100 system_call_fastpath;sys_getdents;vfs_readdir;ext4_readdir;ext4_htree_fill_ tree;htree_dirblock_to_tree;ext4fs_dirhash;half_md4_transform 505 system_call_fastpath;sys_getdents;vfs_readdir;ext4_readdir;ext4_htree_fill_ tree;htree_dirblock_to_tree;ext4fs_dirhash;str2hashbuf_signed 353 [...]
• That shows all stacks containing ext4fs_dirhash(); useful debug aid by itself
• grep can also be used to filter stacks before Flame Graphs • eg: grep -v cpu_idle
74. Generation: Final Output • Desires: • Full control of output • High density detail • Portable: easily viewable • Interactive
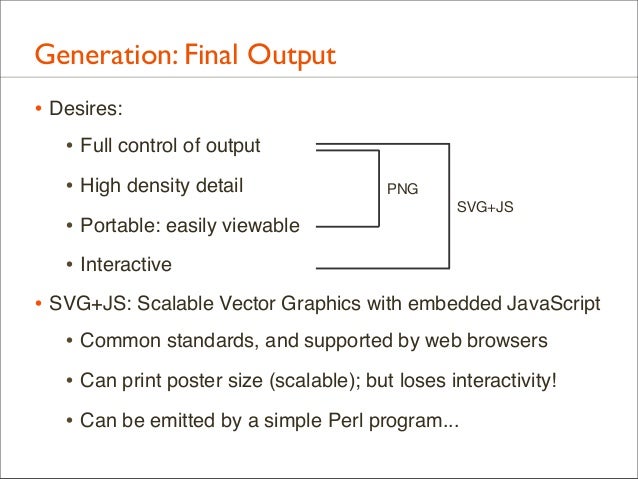
75. Generation: Final Output • Desires: • Full control of output • High density detail • Portable: easily viewable
PNG SVG+JS
• Interactive • SVG+JS: Scalable Vector Graphics with embedded JavaScript • Common standards, and supported by web browsers • Can print poster size (scalable); but loses interactivity! • Can be emitted by a simple Perl program...
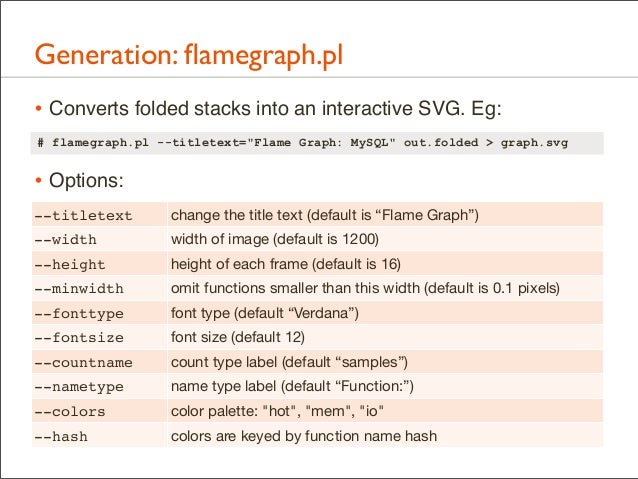
76. Generation: flamegraph.pl • Converts folded stacks into an interactive SVG. Eg: # flamegraph.pl --titletext="Flame Graph: MySQL" out.folded > graph.svg
• Options: --titletext
change the title text (default is “Flame Graph”)
--width
width of image (default is 1200)
--height
height of each frame (default is 16)
--minwidth
omit functions smaller than this width (default is 0.1 pixels)
--fonttype
font type (default “Verdana”)
--fontsize
font size (default 12)
--countname
count type label (default “samples”)
--nametype
name type label (default “Function:”)
--colors
color palette: "hot", "mem", "io"
--hash
colors are keyed by function name hash
77. Types
78. Types • CPU • Memory • Off-CPU • More
79. CPU
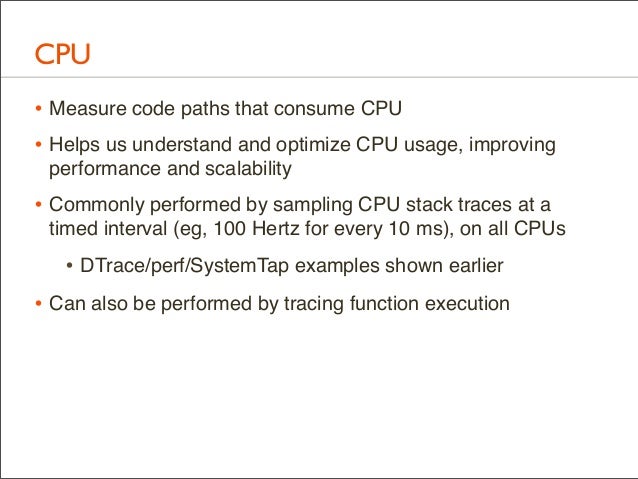
80. CPU • Measure code paths that consume CPU • Helps us understand and optimize CPU usage, improving performance and scalability
• Commonly performed by sampling CPU stack traces at a timed interval (eg, 100 Hertz for every 10 ms), on all CPUs
• DTrace/perf/SystemTap examples shown earlier • Can also be performed by tracing function execution
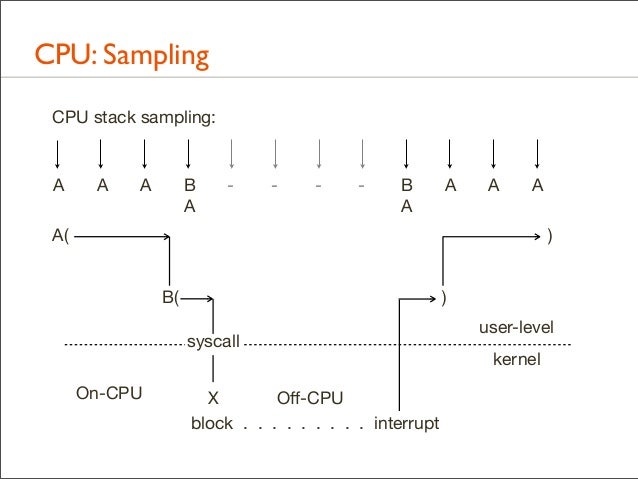
81. CPU: Sampling CPU stack sampling:
A
A
A
B A
-
-
-
-
B A
A
A
A
A(
) B(
) syscall
On-CPU
X Off-CPU block . . . . . . . . . interrupt
user-level kernel
82. CPU: Tracing CPU function tracing:
A(
B(
B)
A)
A(
) B(
) syscall
On-CPU
X Off-CPU block . . . . . . . . . interrupt
user-level kernel
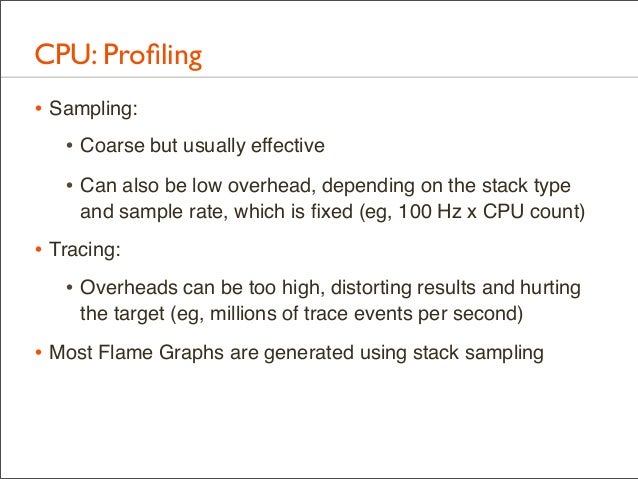
83. CPU: Profiling • Sampling: • Coarse but usually effective • Can also be low overhead, depending on the stack type and sample rate, which is fixed (eg, 100 Hz x CPU count)
• Tracing: • Overheads can be too high, distorting results and hurting the target (eg, millions of trace events per second)
• Most Flame Graphs are generated using stack sampling
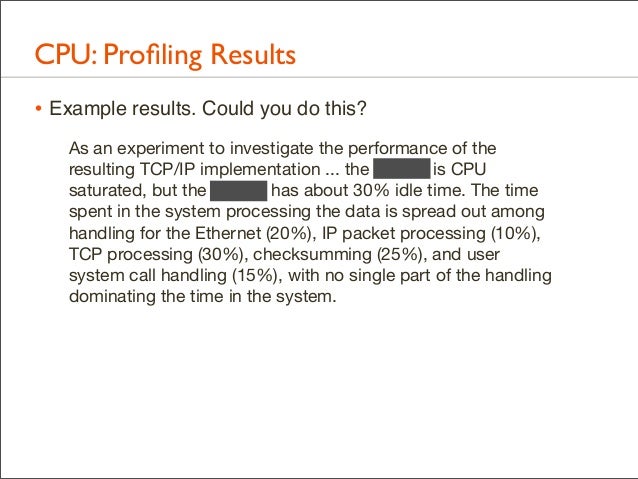
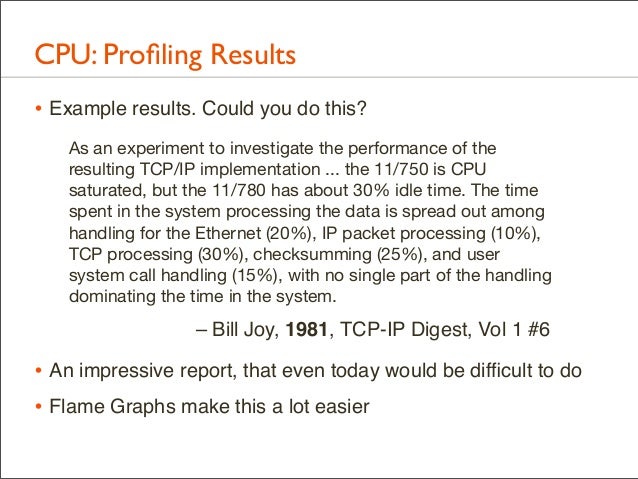
84. CPU: Profiling Results • Example results. Could you do this? As an experiment to investigate the performance of the resulting TCP/IP implementation ... the 11/750 is CPU saturated, but the 11/780 has about 30% idle time. The time spent in the system processing the data is spread out among handling for the Ethernet (20%), IP packet processing (10%), TCP processing (30%), checksumming (25%), and user system call handling (15%), with no single part of the handling dominating the time in the system.
85. CPU: Profiling Results • Example results. Could you do this? As an experiment to investigate the performance of the resulting TCP/IP implementation ... the 11/750 is CPU saturated, but the 11/780 has about 30% idle time. The time spent in the system processing the data is spread out among handling for the Ethernet (20%), IP packet processing (10%), TCP processing (30%), checksumming (25%), and user system call handling (15%), with no single part of the handling dominating the time in the system.
– Bill Joy, 1981, TCP-IP Digest, Vol 1 #6
• An impressive report, that even today would be difficult to do • Flame Graphs make this a lot easier
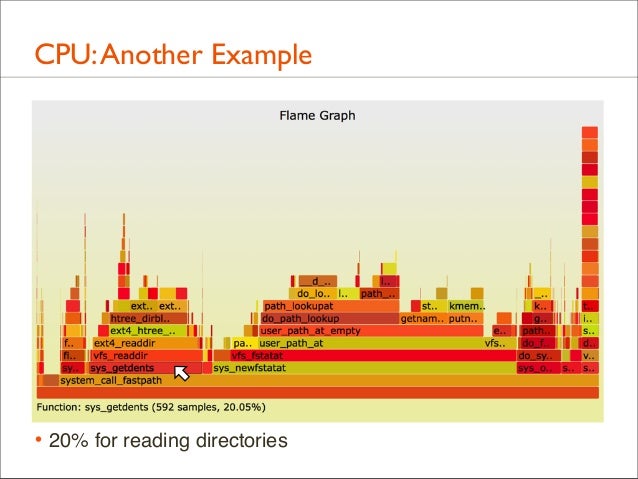
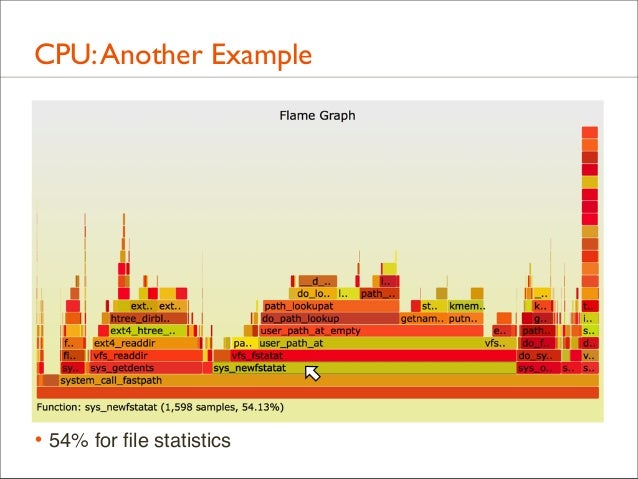
86. CPU: Another Example • A file system is archived using tar(1). • The files and directories are cached, and the run time is mostly on-CPU in the kernel (Linux). Where exactly?
87. CPU: Another Example
88. CPU: Another Example
• 20% for reading directories
89. CPU: Another Example
• 54% for file statistics
90. CPU: Another Example
• Also good for learning kernel internals: browse the active code
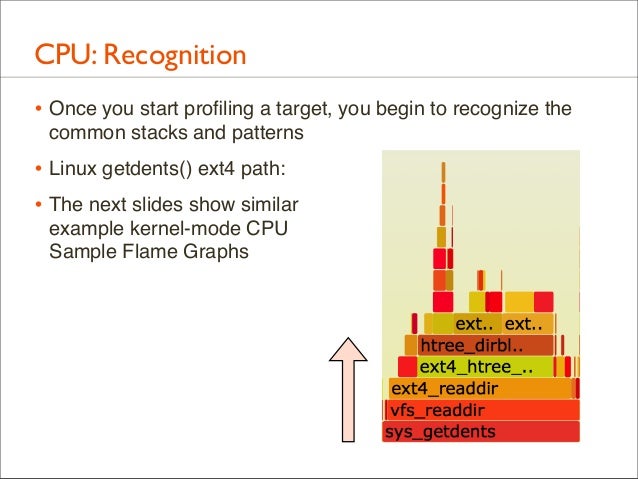
91. CPU: Recognition • Once you start profiling a target, you begin to recognize the common stacks and patterns
• Linux getdents() ext4 path: • The next slides show similar example kernel-mode CPU Sample Flame Graphs
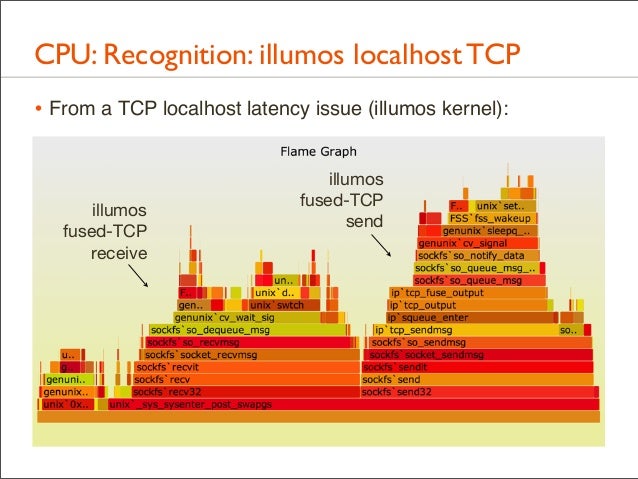
92. CPU: Recognition: illumos localhost TCP • From a TCP localhost latency issue (illumos kernel):
illumos fused-TCP receive
illumos fused-TCP send
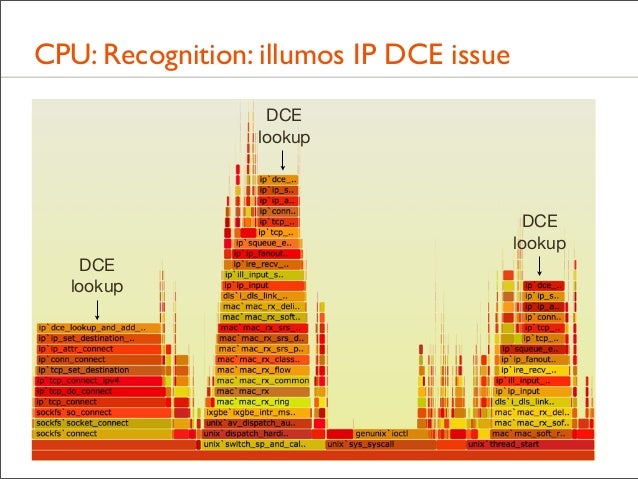
93. CPU: Recognition: illumos IP DCE issue DCE lookup
DCE lookup DCE lookup
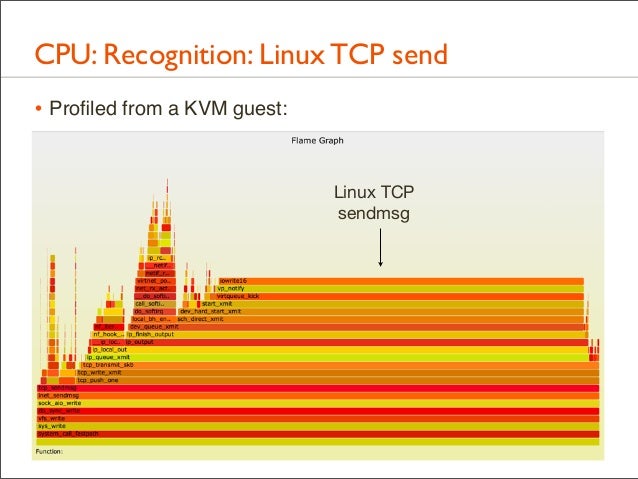
94. CPU: Recognition: Linux TCP send • Profiled from a KVM guest: Linux TCP sendmsg
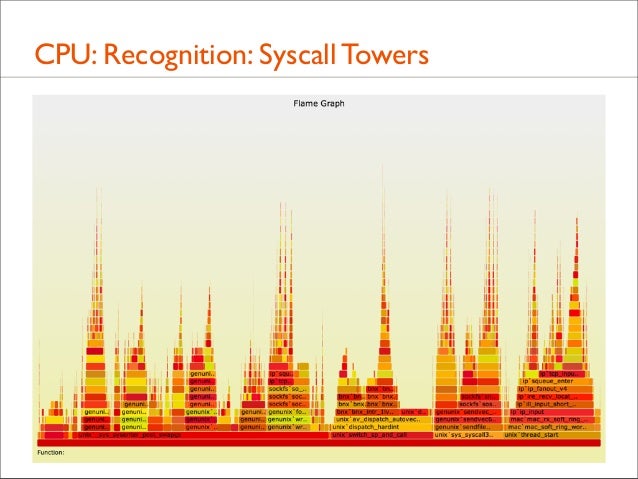
95. CPU: Recognition: Syscall Towers
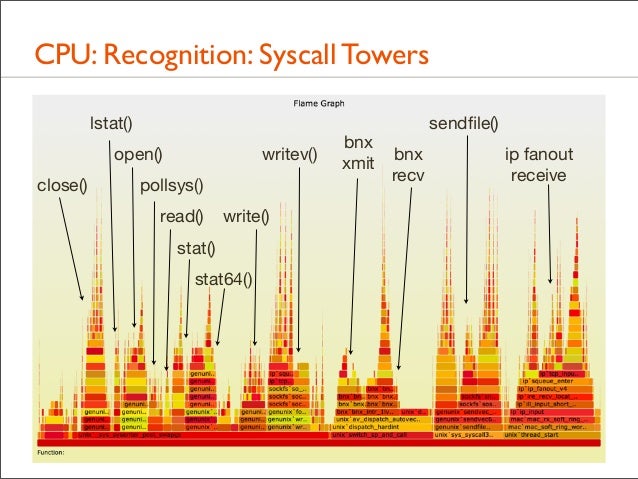
96. CPU: Recognition: Syscall Towers lstat() open() close()
writev()
pollsys() read()
write()
stat() stat64()
bnx xmit
sendfile() bnx recv
ip fanout receive
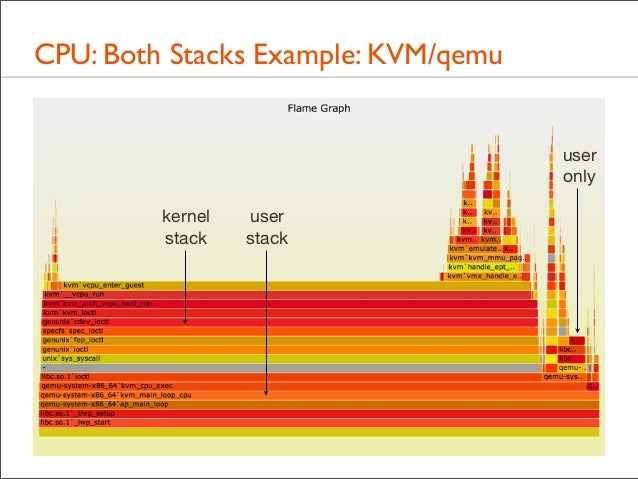
97. CPU: Both Stacks • Apart from showing either user- or kernel-level stacks, both can be included by stacking kernel on top of user
• Linux perf does this by default • DTrace can by aggregating @[stack(), ustack()] • The different stacks can be highlighted in different ways: • different colors or hues • separator: flamegraph.pl will color gray any functions called "-", which can be inserted as stack separators
• Kernel stacks are only present during syscalls or interrupts
98. CPU: Both Stacks Example: KVM/qemu user only kernel stack
user stack
99. Advanced Flame Graphs
100. Other Targets • Apart from CPU samples, stack traces can be collected for any event; eg:
• disk, network, or FS I/O • CPU events, including cache misses • lock contention and holds • memory allocation • Other values, instead of sample counts, can also be used: • latency • bytes • The next sections demonstrate memory allocation, I/O tracing, and then all blocking types via off-CPU tracing
101. Memory
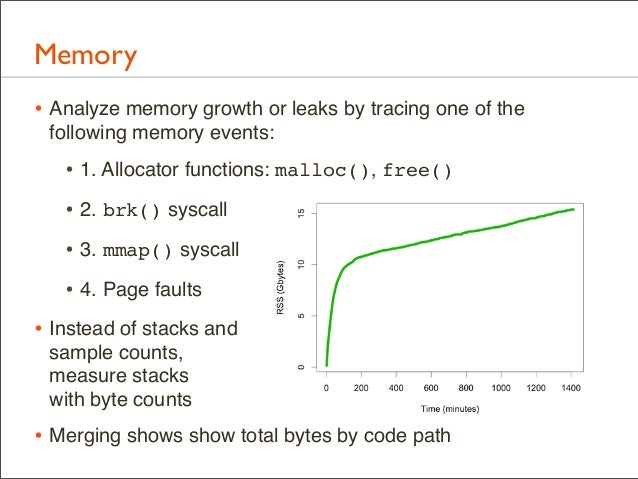
102. Memory • Analyze memory growth or leaks by tracing one of the following memory events:
• 1. Allocator functions: malloc(), free() • 2. brk() syscall • 3. mmap() syscall • 4. Page faults • Instead of stacks and sample counts, measure stacks with byte counts
• Merging shows show total bytes by code path
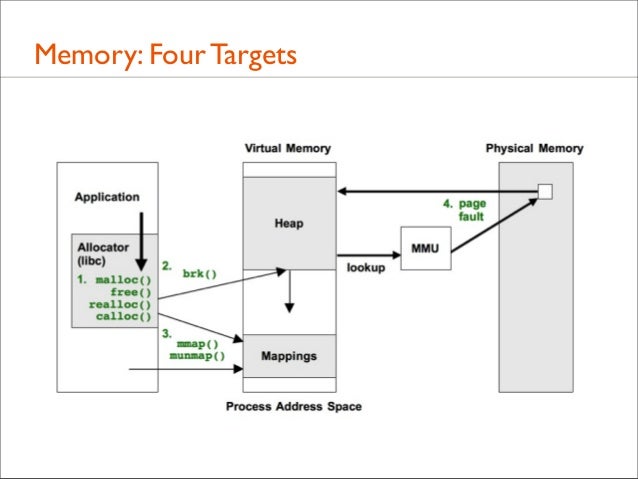
103. Memory: Four Targets
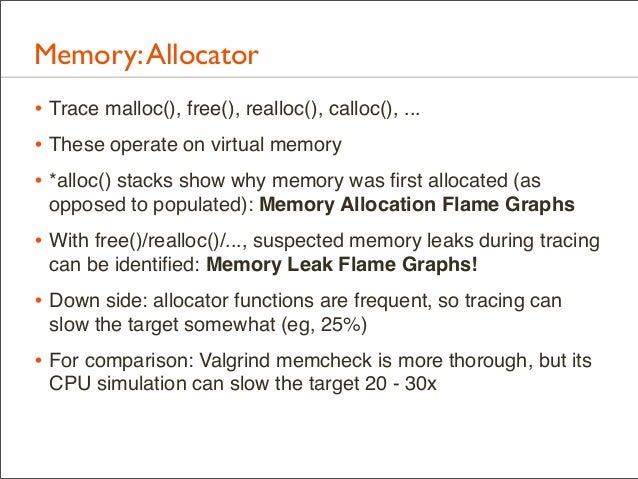
104. Memory: Allocator • Trace malloc(), free(), realloc(), calloc(), ... • These operate on virtual memory • *alloc() stacks show why memory was first allocated (as opposed to populated): Memory Allocation Flame Graphs
• With free()/realloc()/..., suspected memory leaks during tracing can be identified: Memory Leak Flame Graphs!
• Down side: allocator functions are frequent, so tracing can slow the target somewhat (eg, 25%)
• For comparison: Valgrind memcheck is more thorough, but its CPU simulation can slow the target 20 - 30x
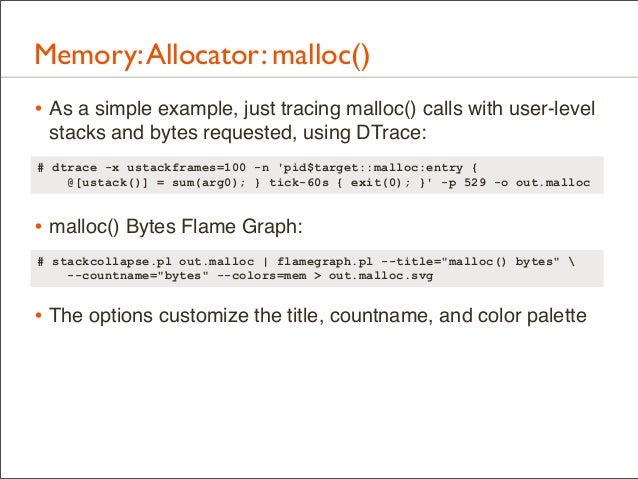
105. Memory: Allocator: malloc() • As a simple example, just tracing malloc() calls with user-level stacks and bytes requested, using DTrace: # dtrace -x ustackframes=100 -n 'pid$target::malloc:entry { @[ustack()] = sum(arg0); } tick-60s { exit(0); }' -p 529 -o out.malloc
• malloc() Bytes Flame Graph: # stackcollapse.pl out.malloc | flamegraph.pl --title="malloc() bytes" --countname="bytes" --colors=mem > out.malloc.svg
• The options customize the title, countname, and color palette
106. Memory: Allocator: malloc()
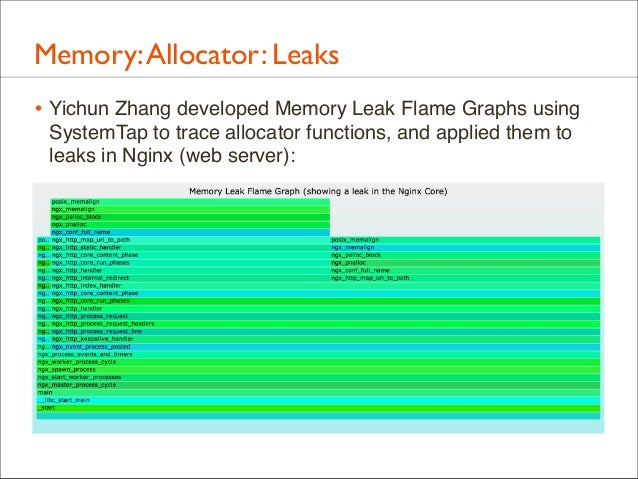
107. Memory: Allocator: Leaks • Yichun Zhang developed Memory Leak Flame Graphs using SystemTap to trace allocator functions, and applied them to leaks in Nginx (web server):
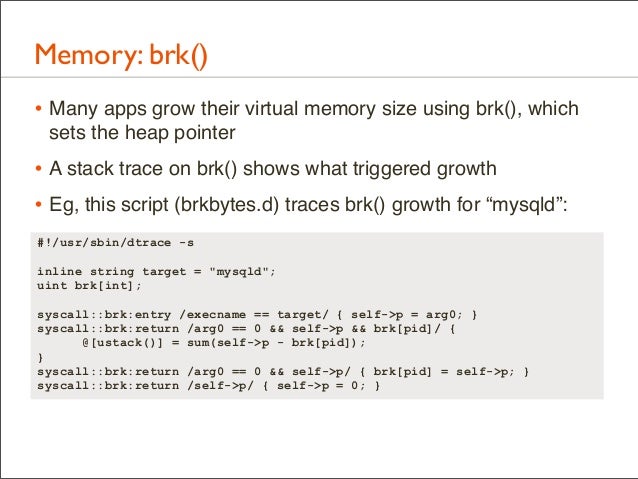
108. Memory: brk() • Many apps grow their virtual memory size using brk(), which sets the heap pointer
• A stack trace on brk() shows what triggered growth • Eg, this script (brkbytes.d) traces brk() growth for “mysqld”: #!/usr/sbin/dtrace -s inline string target = "mysqld"; uint brk[int]; syscall::brk:entry /execname == target/ { self->p = arg0; } syscall::brk:return /arg0 == 0 && self->p && brk[pid]/ { @[ustack()] = sum(self->p - brk[pid]); } syscall::brk:return /arg0 == 0 && self->p/ { brk[pid] = self->p; } syscall::brk:return /self->p/ { self->p = 0; }
109. Memory: brk(): Heap Expansion # ./brkbytes.d -n 'tick-60s { exit(0); }' > out.brk # stackcollapse.pl out.brk | flamegraph.pl --countname="bytes" --title="Heap Expansion Flame Graph" --colors=mem > out.brk.svg
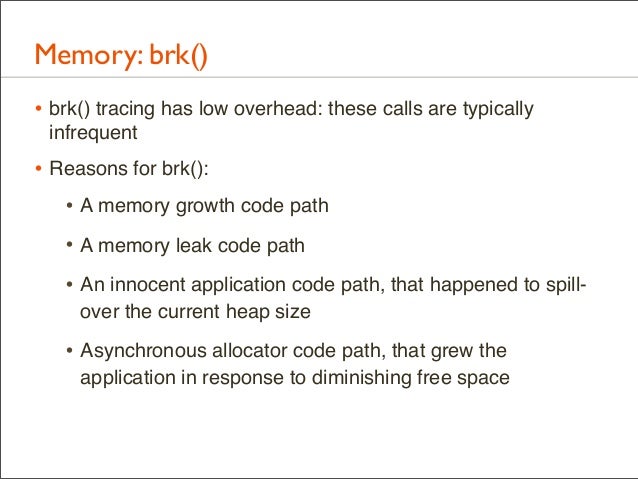
110. Memory: brk() • brk() tracing has low overhead: these calls are typically infrequent
• Reasons for brk(): • A memory growth code path • A memory leak code path • An innocent application code path, that happened to spillover the current heap size
• Asynchronous allocator code path, that grew the application in response to diminishing free space
111. Memory: mmap() • mmap() may be used by the application or it’s user-level allocator to map in large regions of virtual memory
• It may be followed by munmap() to free the area, which can also be traced
• Eg, mmap() tracing, similar to brk tracing, to show bytes and the stacks responsible: # dtrace -n 'syscall::mmap:entry /execname == "mysqld"/ { @[ustack()] = sum(arg1); }' -o out.mmap # stackcollapse.pl out.mmap | flamegraph.pl --countname="bytes" --title="mmap() bytes Flame Graph" --colors=mem > out.mmap.svg
• This should be low overhead – depends on the frequency
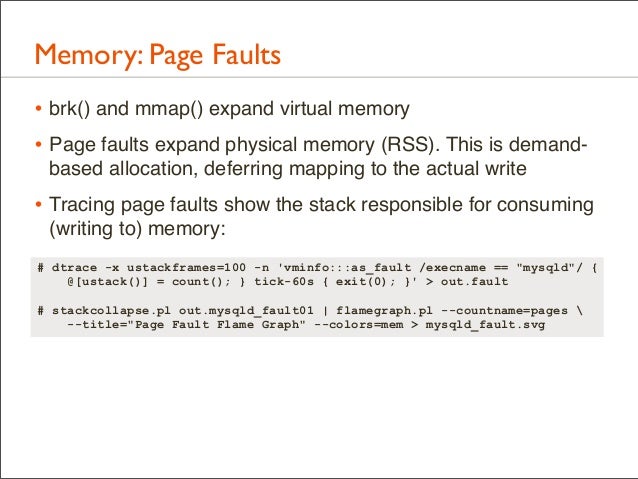
112. Memory: Page Faults • brk() and mmap() expand virtual memory • Page faults expand physical memory (RSS). This is demandbased allocation, deferring mapping to the actual write
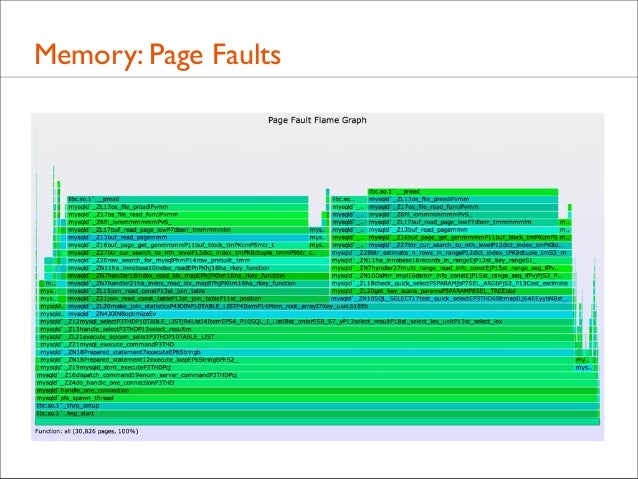
• Tracing page faults show the stack responsible for consuming (writing to) memory: # dtrace -x ustackframes=100 -n 'vminfo:::as_fault /execname == "mysqld"/ { @[ustack()] = count(); } tick-60s { exit(0); }' > out.fault # stackcollapse.pl out.mysqld_fault01 | flamegraph.pl --countname=pages --title="Page Fault Flame Graph" --colors=mem > mysqld_fault.svg
113. Memory: Page Faults
114. I/O
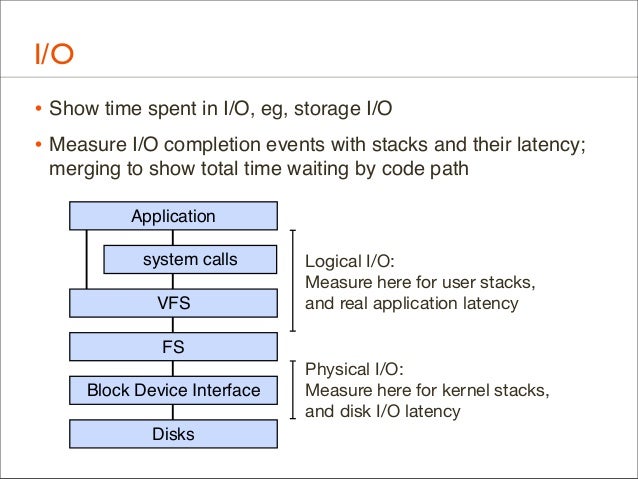
115. I/O • Show time spent in I/O, eg, storage I/O • Measure I/O completion events with stacks and their latency; merging to show total time waiting by code path Application system calls VFS
Logical I/O: Measure here for user stacks, and real application latency
FS Block Device Interface Disks
Physical I/O: Measure here for kernel stacks, and disk I/O latency
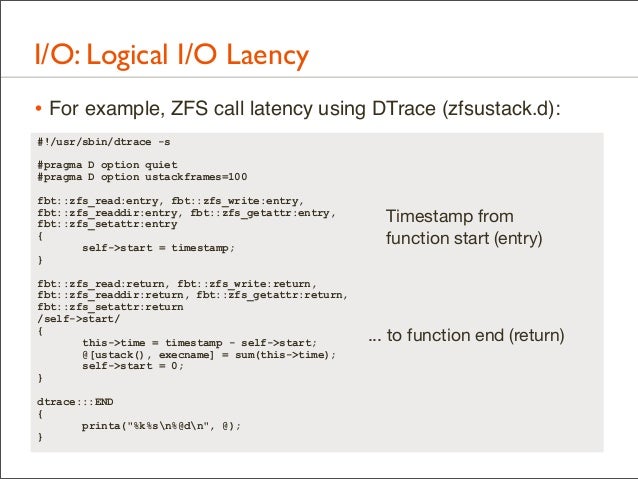
116. I/O: Logical I/O Laency • For example, ZFS call latency using DTrace (zfsustack.d): #!/usr/sbin/dtrace -s #pragma D option quiet #pragma D option ustackframes=100 fbt::zfs_read:entry, fbt::zfs_write:entry, fbt::zfs_readdir:entry, fbt::zfs_getattr:entry, fbt::zfs_setattr:entry { self->start = timestamp; } fbt::zfs_read:return, fbt::zfs_write:return, fbt::zfs_readdir:return, fbt::zfs_getattr:return, fbt::zfs_setattr:return /self->start/ { this->time = timestamp - self->start; @[ustack(), execname] = sum(this->time); self->start = 0; } dtrace:::END { printa("%k%sn%@dn", @); }
Timestamp from function start (entry)
... to function end (return)
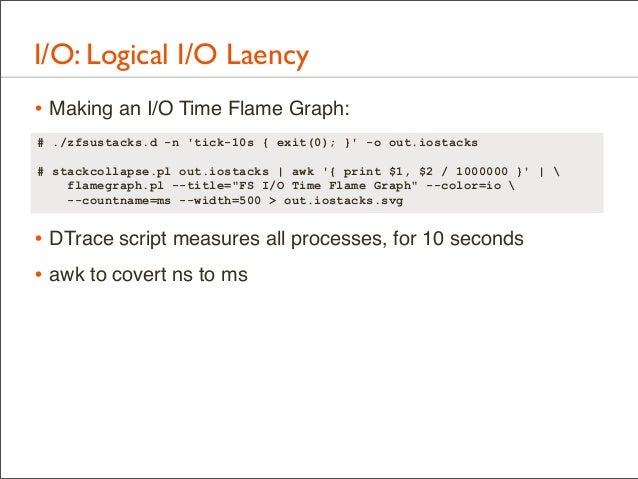
117. I/O: Logical I/O Laency • Making an I/O Time Flame Graph: # ./zfsustacks.d -n 'tick-10s { exit(0); }' -o out.iostacks # stackcollapse.pl out.iostacks | awk '{ print $1, $2 / 1000000 }' | flamegraph.pl --title="FS I/O Time Flame Graph" --color=io --countname=ms --width=500 > out.iostacks.svg
• DTrace script measures all processes, for 10 seconds • awk to covert ns to ms
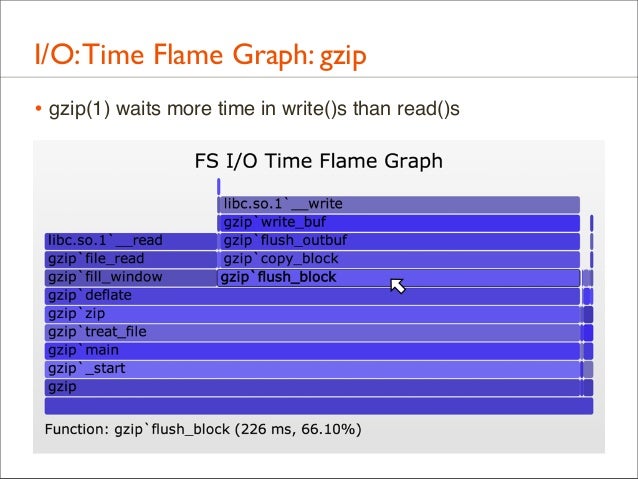
118. I/O: Time Flame Graph: gzip • gzip(1) waits more time in write()s than read()s
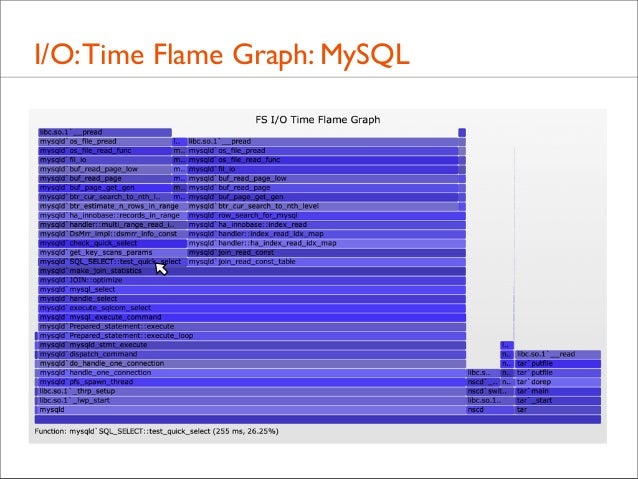
119. I/O: Time Flame Graph: MySQL
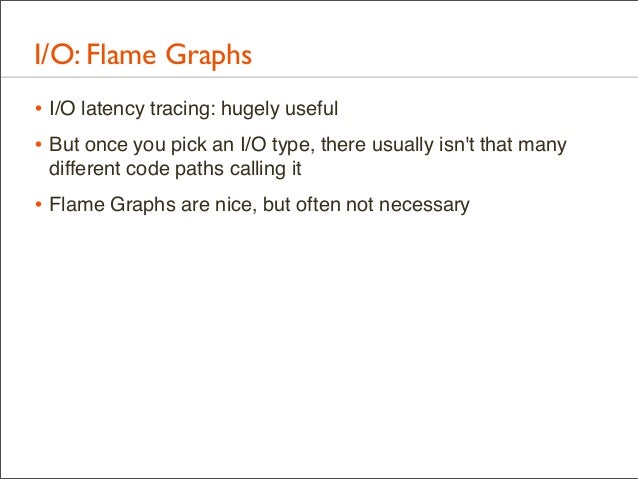
120. I/O: Flame Graphs • I/O latency tracing: hugely useful • But once you pick an I/O type, there usually isn't that many different code paths calling it
• Flame Graphs are nice, but often not necessary
121. Off-CPU
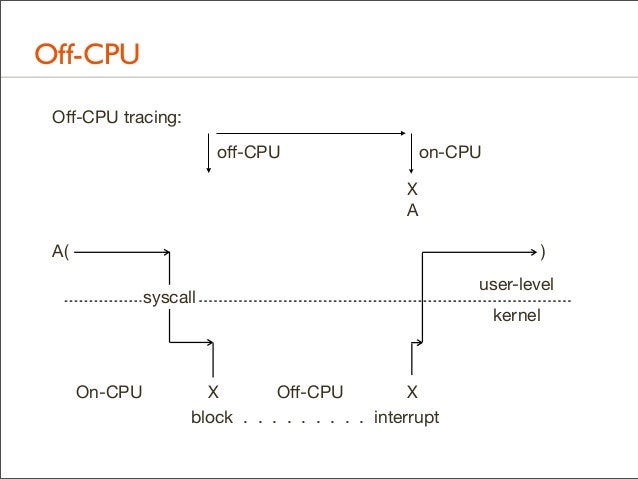
122. Off-CPU Off-CPU tracing: off-CPU
on-CPU X A
A(
) syscall
On-CPU
X Off-CPU X block . . . . . . . . . interrupt
user-level kernel
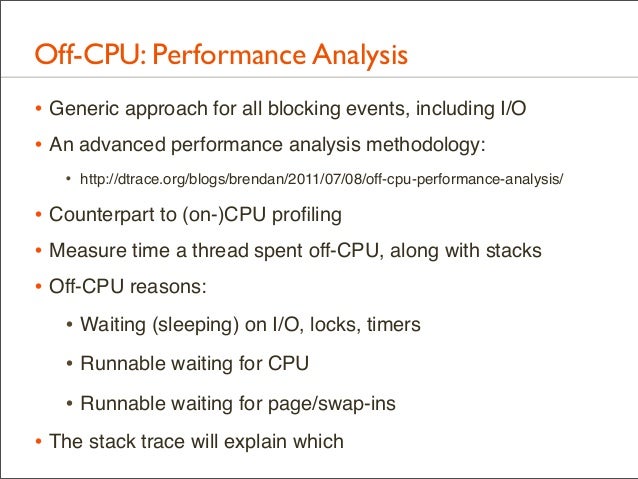
123. Off-CPU: Performance Analysis • Generic approach for all blocking events, including I/O • An advanced performance analysis methodology: •
http://dtrace.org/blogs/brendan/2011/07/08/off-cpu-performance-analysis/
• Counterpart to (on-)CPU profiling • Measure time a thread spent off-CPU, along with stacks • Off-CPU reasons: • Waiting (sleeping) on I/O, locks, timers • Runnable waiting for CPU • Runnable waiting for page/swap-ins • The stack trace will explain which
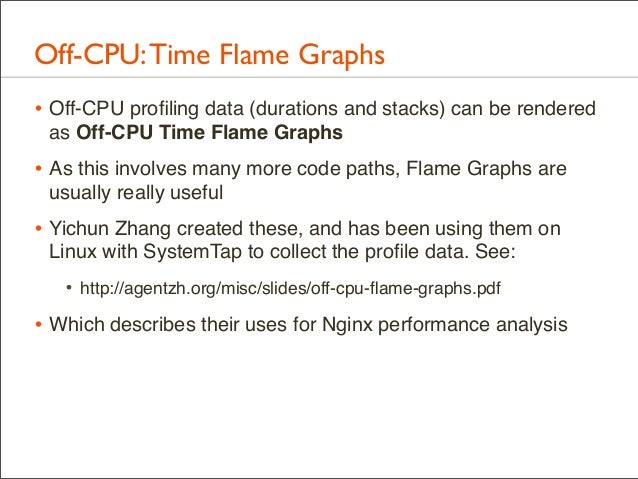
124. Off-CPU: Time Flame Graphs • Off-CPU profiling data (durations and stacks) can be rendered as Off-CPU Time Flame Graphs
• As this involves many more code paths, Flame Graphs are usually really useful
• Yichun Zhang created these, and has been using them on Linux with SystemTap to collect the profile data. See:
•
http://agentzh.org/misc/slides/off-cpu-flame-graphs.pdf
• Which describes their uses for Nginx performance analysis
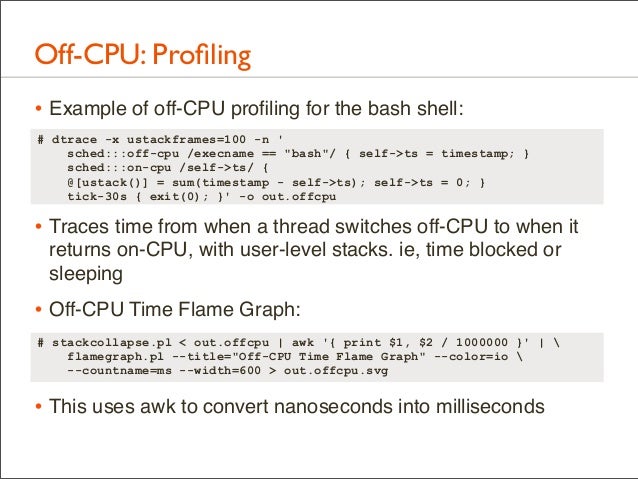
125. Off-CPU: Profiling • Example of off-CPU profiling for the bash shell: # dtrace -x ustackframes=100 -n ' sched:::off-cpu /execname == "bash"/ { self->ts = timestamp; } sched:::on-cpu /self->ts/ { @[ustack()] = sum(timestamp - self->ts); self->ts = 0; } tick-30s { exit(0); }' -o out.offcpu
• Traces time from when a thread switches off-CPU to when it returns on-CPU, with user-level stacks. ie, time blocked or sleeping
• Off-CPU Time Flame Graph: # stackcollapse.pl < out.offcpu | awk '{ print $1, $2 / 1000000 }' | flamegraph.pl --title="Off-CPU Time Flame Graph" --color=io --countname=ms --width=600 > out.offcpu.svg
• This uses awk to convert nanoseconds into milliseconds
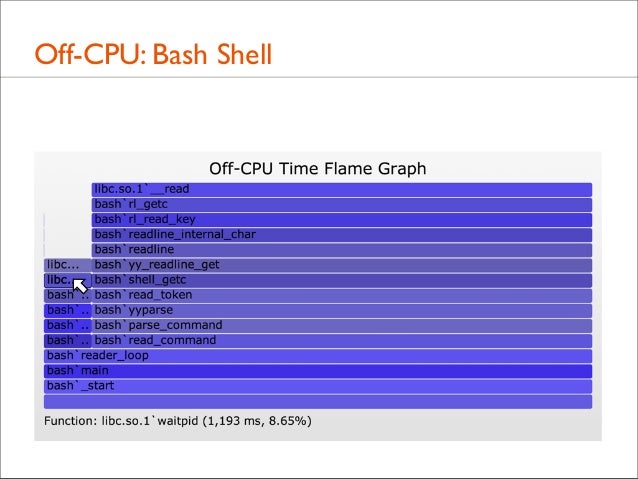
126. Off-CPU: Bash Shell
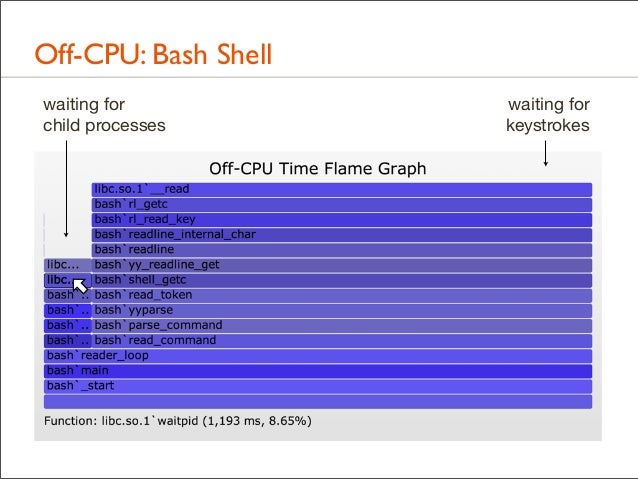
127. Off-CPU: Bash Shell waiting for child processes
waiting for keystrokes
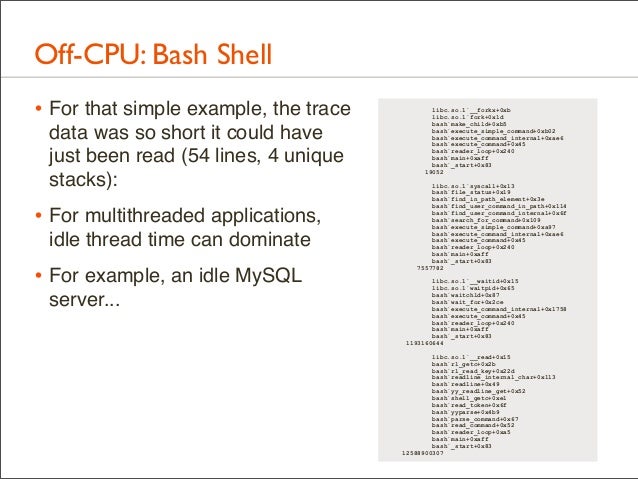
128. Off-CPU: Bash Shell • For that simple example, the trace data was so short it could have just been read (54 lines, 4 unique stacks):
• For multithreaded applications, idle thread time can dominate
• For example, an idle MySQL server...
libc.so.1`__forkx+0xb libc.so.1`fork+0x1d bash`make_child+0xb5 bash`execute_simple_command+0xb02 bash`execute_command_internal+0xae6 bash`execute_command+0x45 bash`reader_loop+0x240 bash`main+0xaff bash`_start+0x83 19052 libc.so.1`syscall+0x13 bash`file_status+0x19 bash`find_in_path_element+0x3e bash`find_user_command_in_path+0x114 bash`find_user_command_internal+0x6f bash`search_for_command+0x109 bash`execute_simple_command+0xa97 bash`execute_command_internal+0xae6 bash`execute_command+0x45 bash`reader_loop+0x240 bash`main+0xaff bash`_start+0x83 7557782 libc.so.1`__waitid+0x15 libc.so.1`waitpid+0x65 bash`waitchld+0x87 bash`wait_for+0x2ce bash`execute_command_internal+0x1758 bash`execute_command+0x45 bash`reader_loop+0x240 bash`main+0xaff bash`_start+0x83 1193160644 libc.so.1`__read+0x15 bash`rl_getc+0x2b bash`rl_read_key+0x22d bash`readline_internal_char+0x113 bash`readline+0x49 bash`yy_readline_get+0x52 bash`shell_getc+0xe1 bash`read_token+0x6f bash`yyparse+0x4b9 bash`parse_command+0x67 bash`read_command+0x52 bash`reader_loop+0xa5 bash`main+0xaff bash`_start+0x83 12588900307
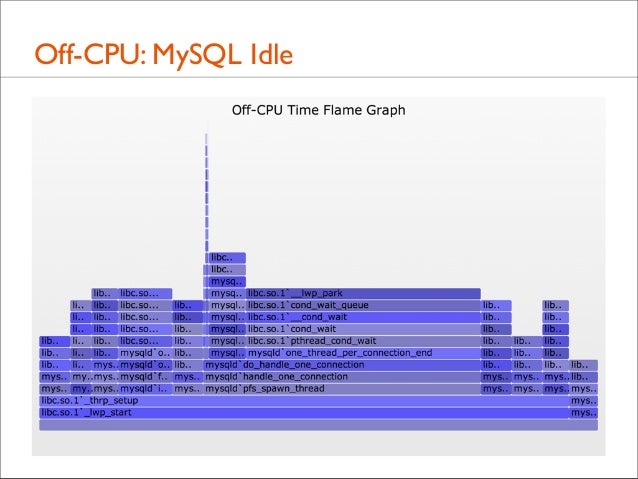
129. Off-CPU: MySQL Idle
130. Off-CPU: MySQL Idle
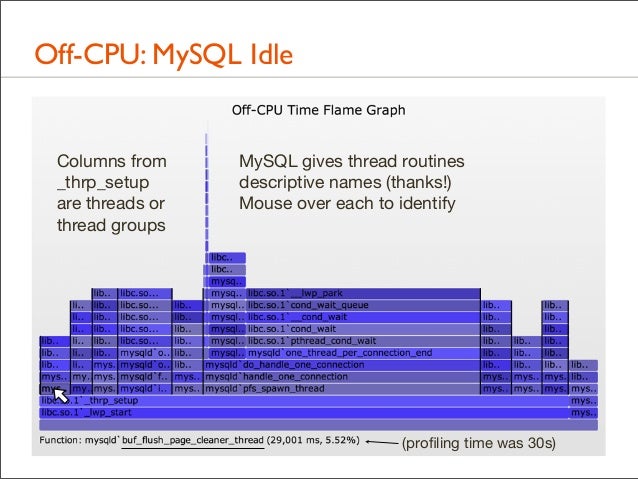
Columns from _thrp_setup are threads or thread groups
MySQL gives thread routines descriptive names (thanks!) Mouse over each to identify
(profiling time was 30s)
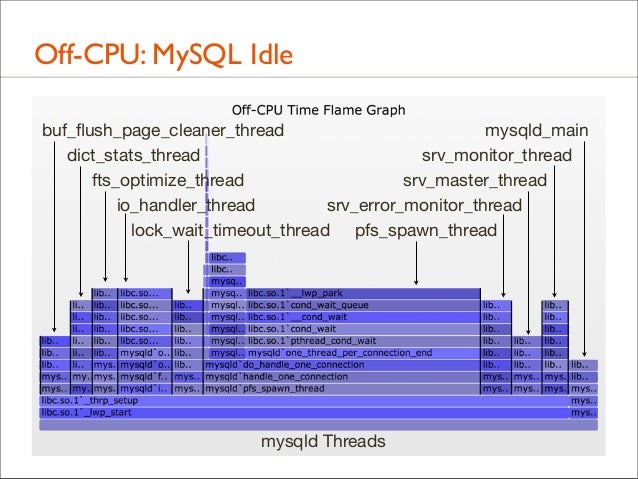
131. Off-CPU: MySQL Idle buf_flush_page_cleaner_thread mysqld_main dict_stats_thread srv_monitor_thread fts_optimize_thread srv_master_thread io_handler_thread srv_error_monitor_thread lock_wait_timeout_thread pfs_spawn_thread
mysqld Threads
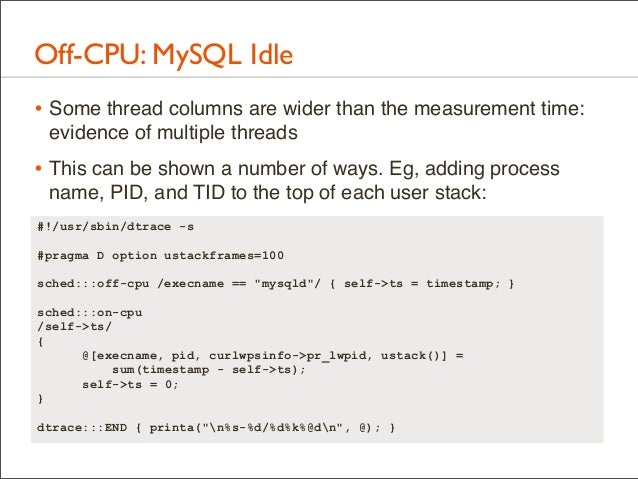
132. Off-CPU: MySQL Idle • Some thread columns are wider than the measurement time: evidence of multiple threads
• This can be shown a number of ways. Eg, adding process name, PID, and TID to the top of each user stack: #!/usr/sbin/dtrace -s #pragma D option ustackframes=100 sched:::off-cpu /execname == "mysqld"/ { self->ts = timestamp; } sched:::on-cpu /self->ts/ { @[execname, pid, curlwpsinfo->pr_lwpid, ustack()] = sum(timestamp - self->ts); self->ts = 0; } dtrace:::END { printa("n%s-%d/%d%k%@dn", @); }
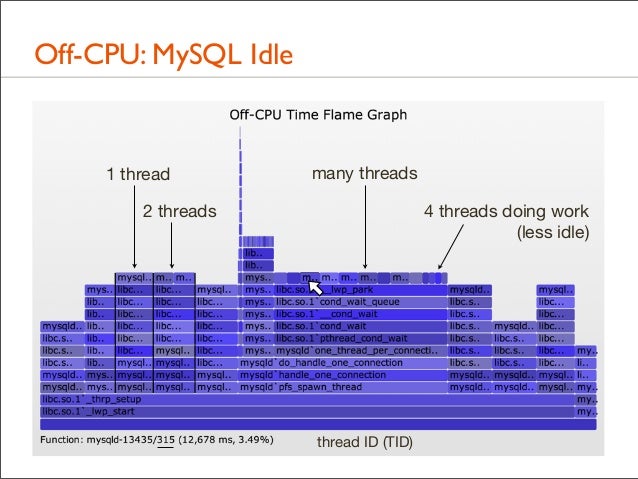
133. Off-CPU: MySQL Idle
1 thread
many threads
2 threads
4 threads doing work (less idle)
thread ID (TID)
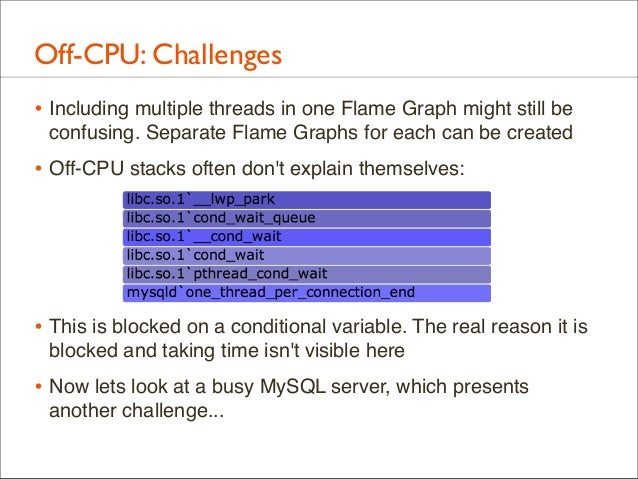
134. Off-CPU: Challenges • Including multiple threads in one Flame Graph might still be confusing. Separate Flame Graphs for each can be created
• Off-CPU stacks often don't explain themselves:
• This is blocked on a conditional variable. The real reason it is blocked and taking time isn't visible here
• Now lets look at a busy MySQL server, which presents another challenge...
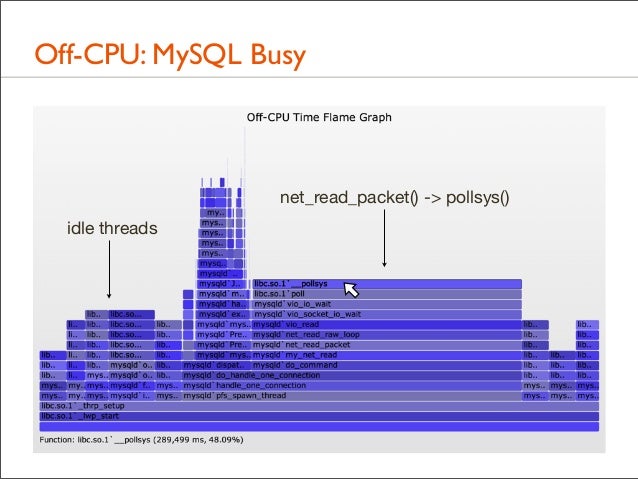
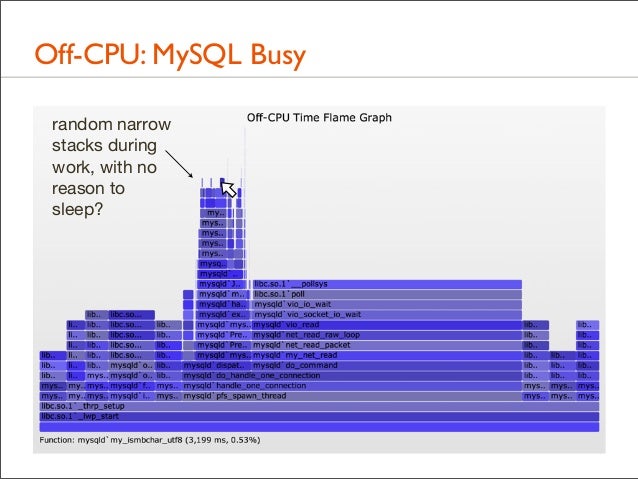
135. Off-CPU: MySQL Busy
net_read_packet() -> pollsys() idle threads
136. Off-CPU: MySQL Busy random narrow stacks during work, with no reason to sleep?
137. Off-CPU: MySQL Busy • Those were user-level stacks only. The kernel-level stack, which can be included, will usually explain what happened
• eg, involuntary context switch due to time slice expired • Those paths are likely hot in the CPU Sample Flame Graph
138. Hot/Cold
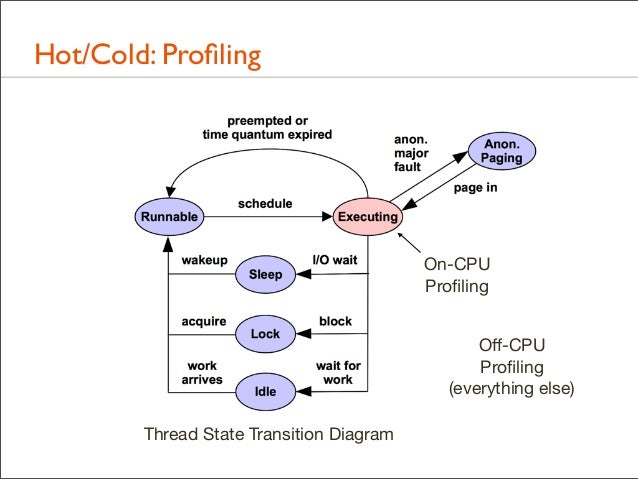
139. Hot/Cold: Profiling
On-CPU Profiling Off-CPU Profiling (everything else) Thread State Transition Diagram
140. Hot/Cold: Profiling • Profiling both on-CPU and off-CPU stacks shows everything • In my LISA'12 talk I called this the Stack Profile Method: profile all stacks
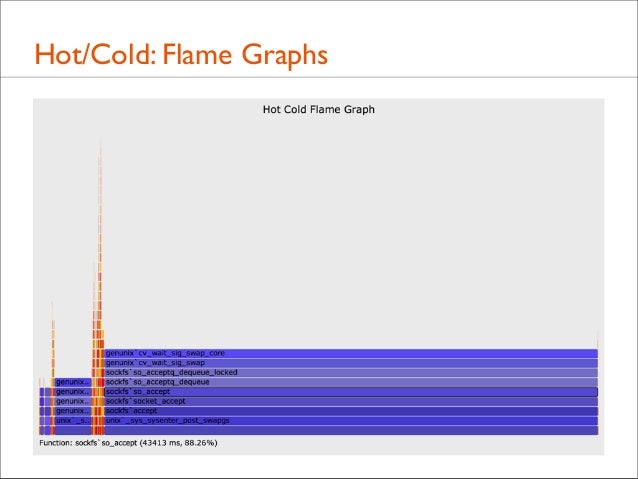
• Both on-CPU ("hot") and off-CPU ("cold") stacks can be included in the same Flame Graph, colored differently: Hot Cold Flame Graphs!
• Merging multiple threads gets even weirder. Creating a separate graph per-thread makes much more sense, as comparisons to see how a thread's time is divided between on- and off-CPU activity
• For example, a single web server thread with kernel stacks...
141. Hot/Cold: Flame Graphs
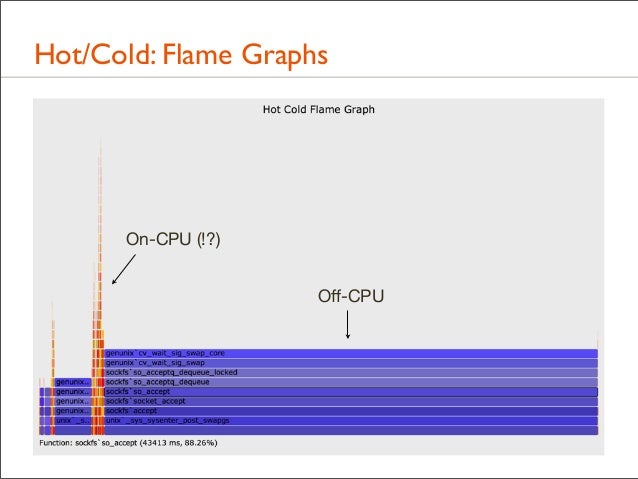
142. Hot/Cold: Flame Graphs
On-CPU (!?) Off-CPU
143. Hot/Cold: Challenges • Sadly, this often doesn't work well for two reasons: • 1. On-CPU time columns get compressed by off-CPU time • Previous example dominated by the idle path – waiting for a new connection – which is not very interesting!
• Works better with zoomable Flame Graphs, but then we've lost the ability to see key details on first glance
• Pairs of on-CPU and off-CPU Flame Graphs may be the best approach, giving both the full width
• 2. Has the same challenge from off-CPU Flame Graphs: real reason for blocking may not be visible
144. State of the Art • That was the end of Flame Graphs, but I can't stop here – we're so close
• On + Off-CPU Flame Graphs can attack any issue • 1. The compressed problem is solvable via one or more of: • zoomable Flame Graphs • separate on- and off-CPU Flame Graphs • per-thread Flame Graphs • 2. How do we show the real reason for blocking?
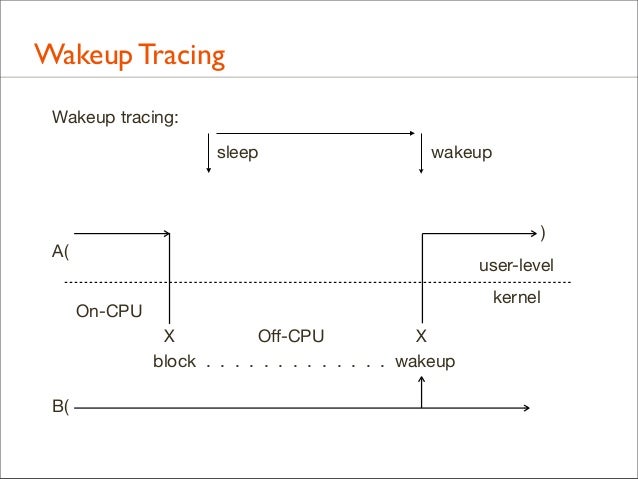
145. Wakeup Tracing Wakeup tracing: sleep
wakeup
)
A(
user-level kernel
On-CPU X Off-CPU X block . . . . . . . . . . . . . wakeup B(
146. Tracing Wakeups • The systems knows who woke up who • Tracing who performed the wakeup – and their stack – can show the real reason for waiting
• Wakeup Latency Flame Graph • Advanced activity • Consider overheads – might trace too much • Eg, consider ssh, starting with the Off CPU Time Flame Graph
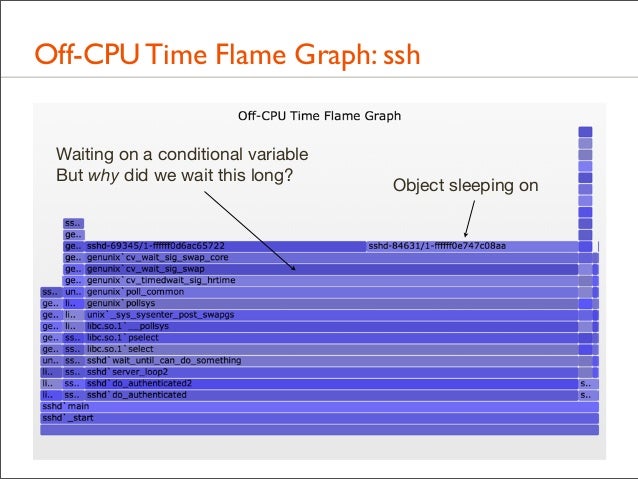
147. Off-CPU Time Flame Graph: ssh Waiting on a conditional variable But why did we wait this long?
Object sleeping on
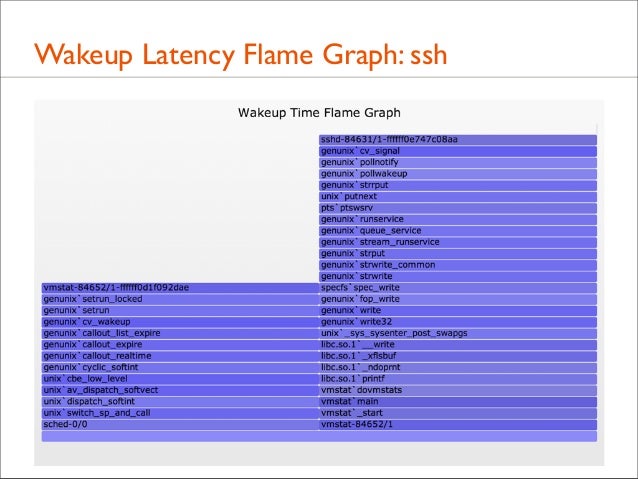
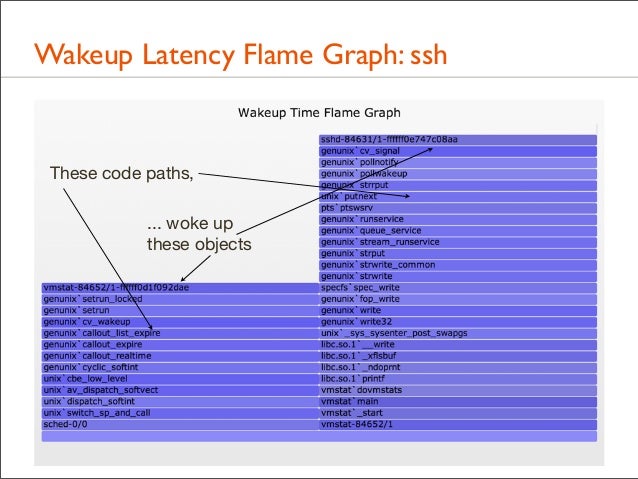
148. Wakeup Latency Flame Graph: ssh
149. Wakeup Latency Flame Graph: ssh
These code paths, ... woke up these objects
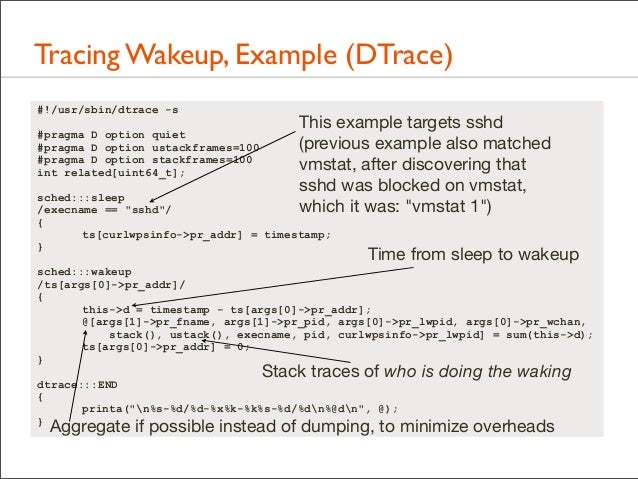
150. Tracing Wakeup, Example (DTrace) #!/usr/sbin/dtrace -s #pragma D option quiet #pragma D option ustackframes=100 #pragma D option stackframes=100 int related[uint64_t];
This example targets sshd (previous example also matched vmstat, after discovering that sshd was blocked on vmstat, which it was: "vmstat 1")
sched:::sleep /execname == "sshd"/ { ts[curlwpsinfo->pr_addr] = timestamp; }
Time from sleep to wakeup
sched:::wakeup /ts[args[0]->pr_addr]/ { this->d = timestamp - ts[args[0]->pr_addr]; @[args[1]->pr_fname, args[1]->pr_pid, args[0]->pr_lwpid, args[0]->pr_wchan, stack(), ustack(), execname, pid, curlwpsinfo->pr_lwpid] = sum(this->d); ts[args[0]->pr_addr] = 0; }
Stack traces of who is doing the waking
dtrace:::END { printa("n%s-%d/%d-%x%k-%k%s-%d/%dn%@dn", @); }
Aggregate if possible instead of dumping, to minimize overheads
151. Following Stack Chains • 1st level of wakeups often not enough • Would like to programmatically follow multiple chains of wakeup stacks, and visualize them
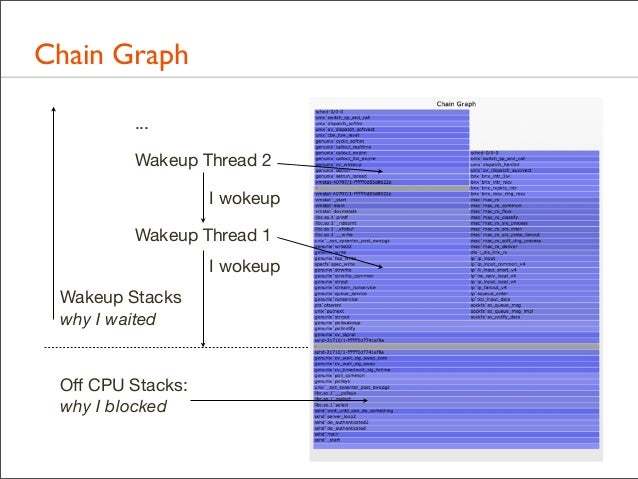
• I've discussed this with others before – it's a hard problem • The following is in development!: Chain Graph
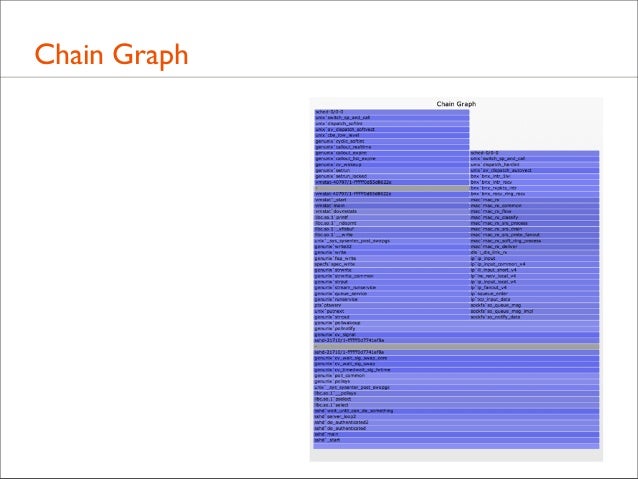
152. Chain Graph
153. Chain Graph ... Wakeup Thread 2 I wokeup Wakeup Thread 1 I wokeup Wakeup Stacks why I waited
Off CPU Stacks: why I blocked
154. Chain Graph Visualization • New, experimental; check for later improvements • Stacks associated based on sleeping object address • Retains the value of relative widths equals latency • Wakeup stacks frames can be listed in reverse (may be less confusing when following towers bottom-up)
• Towers can get very tall, tracing wakeups through different software threads, back to metal
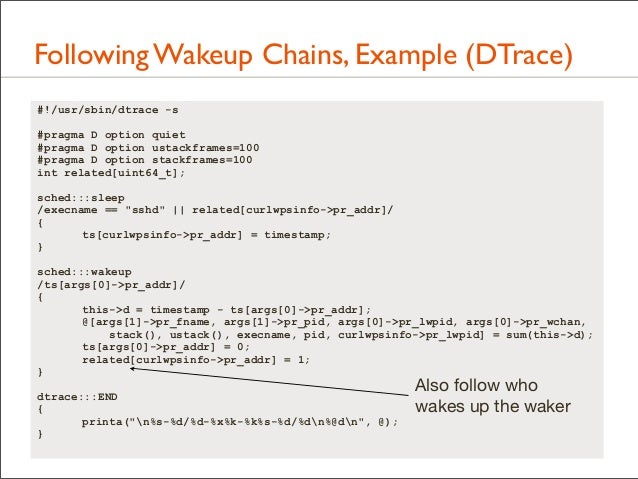
155. Following Wakeup Chains, Example (DTrace) #!/usr/sbin/dtrace -s #pragma D option quiet #pragma D option ustackframes=100 #pragma D option stackframes=100 int related[uint64_t]; sched:::sleep /execname == "sshd" || related[curlwpsinfo->pr_addr]/ { ts[curlwpsinfo->pr_addr] = timestamp; } sched:::wakeup /ts[args[0]->pr_addr]/ { this->d = timestamp - ts[args[0]->pr_addr]; @[args[1]->pr_fname, args[1]->pr_pid, args[0]->pr_lwpid, args[0]->pr_wchan, stack(), ustack(), execname, pid, curlwpsinfo->pr_lwpid] = sum(this->d); ts[args[0]->pr_addr] = 0; related[curlwpsinfo->pr_addr] = 1; } dtrace:::END { printa("n%s-%d/%d-%x%k-%k%s-%d/%dn%@dn", @); }
Also follow who wakes up the waker
156. Developments
157. Developments • There have been many other great developments in the world of Flame Graphs. The following is a short tour.
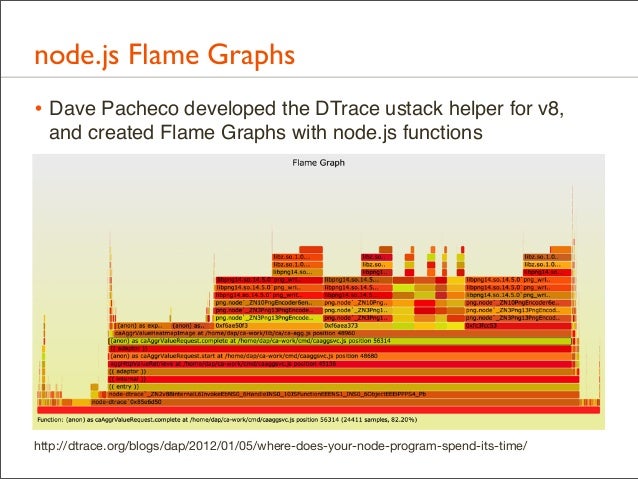
158. node.js Flame Graphs • Dave Pacheco developed the DTrace ustack helper for v8, and created Flame Graphs with node.js functions
http://dtrace.org/blogs/dap/2012/01/05/where-does-your-node-program-spend-its-time/
159. OS X Instruments Flame Graphs • Mark Probst developed a way to produce Flame Graphs from Instruments
1. Use the Time Profile instrument 2. Instrument -> Export Track 3. stackcollapse-instruments.pl 4. flamegraphs.pl
http://schani.wordpress.com/2012/11/16/flame-graphs-for-instruments/
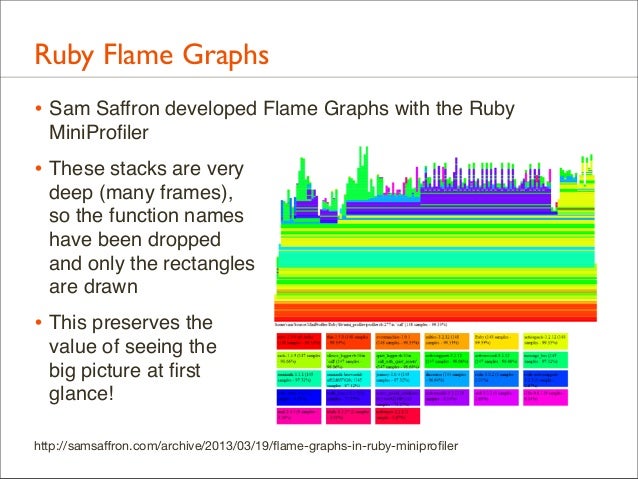
160. Ruby Flame Graphs • Sam Saffron developed Flame Graphs with the Ruby MiniProfiler
• These stacks are very deep (many frames), so the function names have been dropped and only the rectangles are drawn
• This preserves the value of seeing the big picture at first glance! http://samsaffron.com/archive/2013/03/19/flame-graphs-in-ruby-miniprofiler
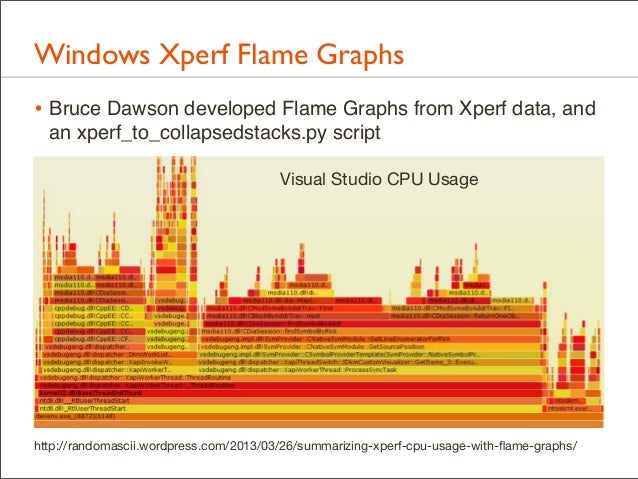
161. Windows Xperf Flame Graphs • Bruce Dawson developed Flame Graphs from Xperf data, and an xperf_to_collapsedstacks.py script Visual Studio CPU Usage
http://randomascii.wordpress.com/2013/03/26/summarizing-xperf-cpu-usage-with-flame-graphs/
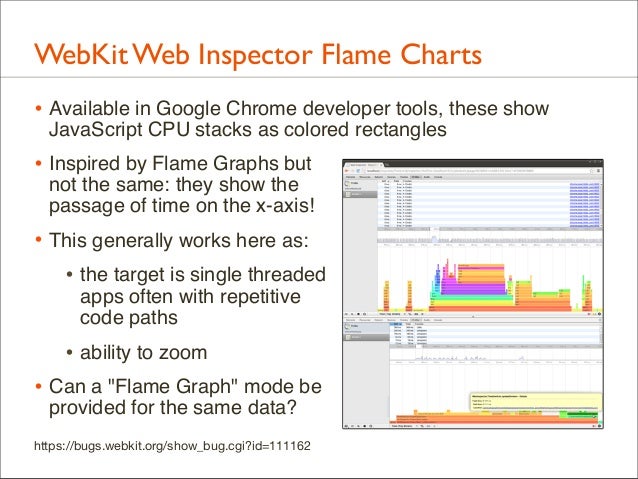
162. WebKit Web Inspector Flame Charts • Available in Google Chrome developer tools, these show JavaScript CPU stacks as colored rectangles
• Inspired by Flame Graphs but
not the same: they show the passage of time on the x-axis!
• This generally works here as: • the target is single threaded apps often with repetitive code paths
• ability to zoom • Can a "Flame Graph" mode be provided for the same data?
https://bugs.webkit.org/show_bug.cgi?id=111162
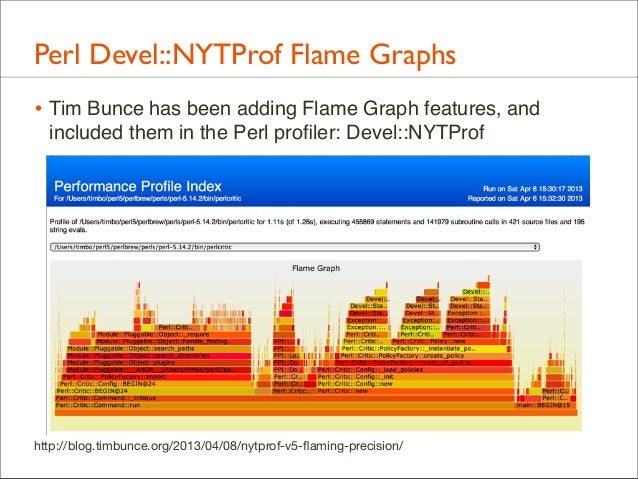
163. Perl Devel::NYTProf Flame Graphs • Tim Bunce has been adding Flame Graph features, and included them in the Perl profiler: Devel::NYTProf
http://blog.timbunce.org/2013/04/08/nytprof-v5-flaming-precision/
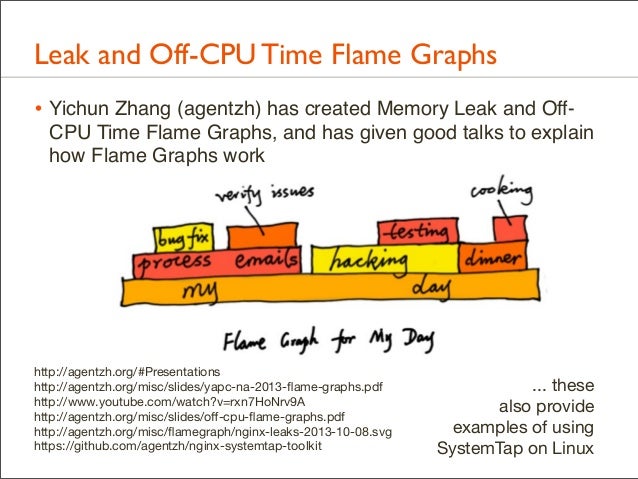
164. Leak and Off-CPU Time Flame Graphs • Yichun Zhang (agentzh) has created Memory Leak and OffCPU Time Flame Graphs, and has given good talks to explain how Flame Graphs work
http://agentzh.org/#Presentations http://agentzh.org/misc/slides/yapc-na-2013-flame-graphs.pdf http://www.youtube.com/watch?v=rxn7HoNrv9A http://agentzh.org/misc/slides/off-cpu-flame-graphs.pdf http://agentzh.org/misc/flamegraph/nginx-leaks-2013-10-08.svg https://github.com/agentzh/nginx-systemtap-toolkit
... these also provide examples of using SystemTap on Linux
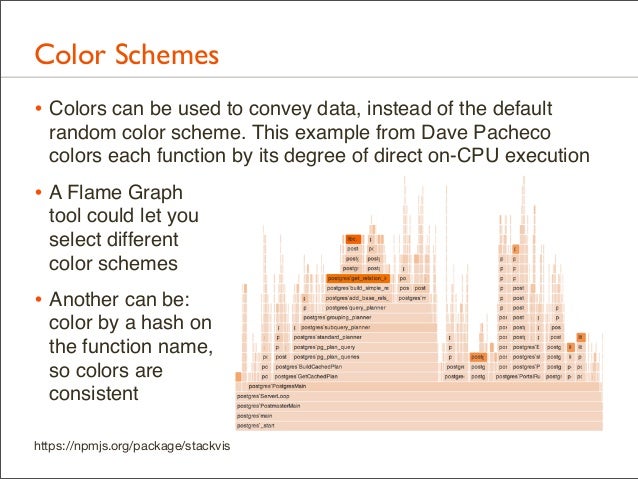
165. Color Schemes • Colors can be used to convey data, instead of the default random color scheme. This example from Dave Pacheco colors each function by its degree of direct on-CPU execution
• A Flame Graph tool could let you select different color schemes
• Another can be: color by a hash on the function name, so colors are consistent https://npmjs.org/package/stackvis
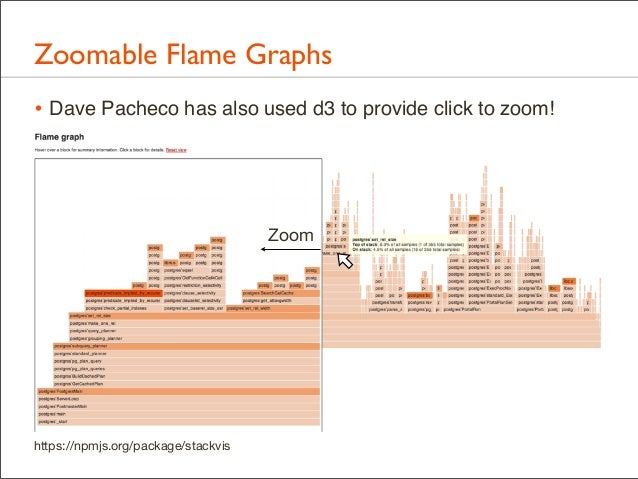
166. Zoomable Flame Graphs • Dave Pacheco has also used d3 to provide click to zoom!
Zoom
https://npmjs.org/package/stackvis
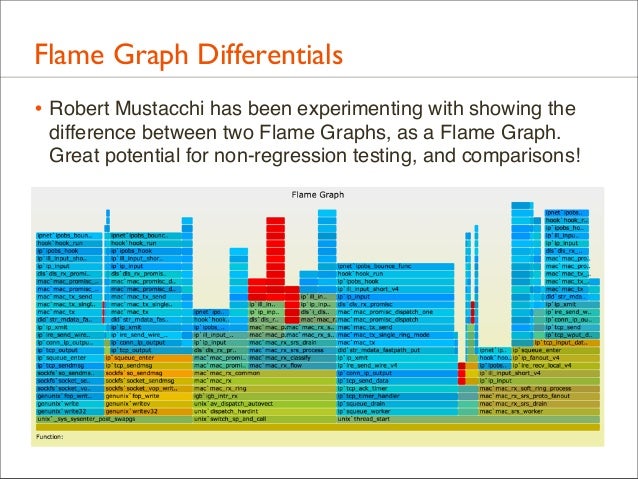
167. Flame Graph Differentials • Robert Mustacchi has been experimenting with showing the difference between two Flame Graphs, as a Flame Graph. Great potential for non-regression testing, and comparisons!
168. Flame Graphs as a Service • Pedro Teixeira has a project for node.js Flame Graphs as a service: automatically generated for each github push!
http://www.youtube.com/watch?v=sMohaWP5YqA
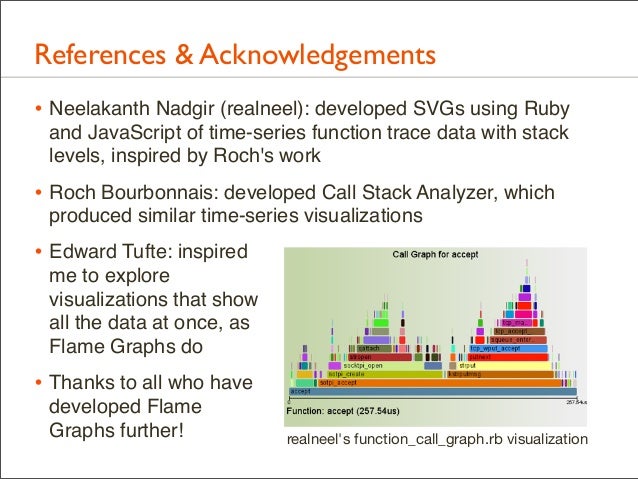
169. References & Acknowledgements • Neelakanth Nadgir (realneel): developed SVGs using Ruby and JavaScript of time-series function trace data with stack levels, inspired by Roch's work
• Roch Bourbonnais: developed Call Stack Analyzer, which produced similar time-series visualizations
• Edward Tufte: inspired me to explore visualizations that show all the data at once, as Flame Graphs do
• Thanks to all who have developed Flame Graphs further!
realneel's function_call_graph.rb visualization
170. Thank you! • Questions? • Homepage: http://www.brendangregg.com (links to everything) • Resources and further reading: •
http://dtrace.org/blogs/brendan/2011/12/16/flame-graphs/: see "Updates"
•
http://dtrace.org/blogs/brendan/2012/03/17/linux-kernel-performance-flamegraphs/
•
http://dtrace.org/blogs/brendan/2013/08/16/memory-leak-growth-flame-graphs/
•
http://dtrace.org/blogs/brendan/2011/07/08/off-cpu-performance-analysis/
•
http://dtrace.org/blogs/dap/2012/01/05/where-does-your-node-program-spendits-time/
Recommend
About Joyk
Aggregate valuable and interesting links.
Joyk means Joy of geeK