
7

Performance Wins with eBPF: Getting Started (2021)
source link: https://www.slideshare.net/brendangregg/performance-wins-with-ebpf-getting-started-2021
Go to the source link to view the article. You can view the picture content, updated content and better typesetting reading experience. If the link is broken, please click the button below to view the snapshot at that time.

Performance Wins with eBPF: Getting Started (2021)
- 1. Performance Wins with eBPF Getting Started Brendan Gregg Aug 2021
- 2. 2 This article is not for beginners … not the best start … out of date BPF has evolved Many docs were true in 2015 but not today Newcomers keep re-posting old info as new This talk is Aug 2021
- 3. 3 BPF is a technology name, and no longer an acronym aka eBPF (extended) BPF is a bytecode and execution environment
- 4. 4 How to get quick and easy BPF performance wins
- 5. Think like a sysadmin Not like a programmer
- 6. 6 Think like a sysadmin # apt-get install bcc-tools # PATH=$PATH:/usr/share/bcc/tools # execsnoop # opensnoop # tcplife # ext4slower # biosnoop [...] Get it installed everywhere and use it.
- 7. 7 Think like a sysadmin # apt-get install bcc-tools # PATH=$PATH:/usr/share/bcc/tools # execsnoop # opensnoop # tcplife # ext4slower # biosnoop [...] Get it installed everywhere and use it. Anything periodic running? crontab? Any misconfigurations? File not found? Any unexpected TCP sessions? Any file system I/O slower than 10ms? Any unusual disk access patterns? Outliers?
- 8. 8 Case Study: BCC biosnoop # iostat -xz 1 Linux 4.15.0-1052-aws (cass-xxx) 12/04/2019 _x86_64_ (8 CPU) […] avg-cpu: %user %nice %system %iowait %steal %idle 4.67 0.13 0.25 0.00 0.00 94.95 Device: rrqm/s wrqm/s r/s w/s rkB/s wkB/s avgrq-sz avgqu-sz await r_await w_await svctm %util xvda 0.00 0.00 1.00 0.00 8.00 0.00 16.00 0.00 0.00 0.00 0.00 0.00 0.00 xvdb 0.00 0.00 32.00 0.00 152.00 0.00 9.50 0.16 5.00 5.00 0.00 5.00 16.00 xvdc 0.00 0.00 36.00 1.00 192.00 4.00 10.59 0.19 5.19 5.33 0.00 5.19 19.20 xvdd 4.00 0.00 37.00 0.00 181.00 0.00 9.78 0.18 4.97 4.97 0.00 4.54 16.80 xvde 0.00 0.00 27.00 0.00 156.00 0.00 11.56 0.18 6.67 6.67 0.00 6.67 18.00 xvdf 0.00 0.00 35.00 0.00 164.00 0.00 9.37 0.19 5.37 5.37 0.00 5.37 18.80 xvdg 0.00 0.00 25.00 1.00 136.00 4.00 10.77 0.14 5.23 5.44 0.00 5.23 13.60 md0 0.00 0.00 195.00 2.00 965.00 8.00 9.88 0.00 0.00 0.00 0.00 0.00 0.00 […]
- 9. 9 Case Study: BCC biosnoop, cont. # /usr/share/bcc/tools/biosnoop TIME(s) COMM PID DISK T SECTOR BYTES LAT(ms) 0.000000 perl 7755 xvdc R 610822184 4096 8.57 0.000812 biosnoop 32196 xvda R 269480 4096 0.43 0.006197 perl 3285 xvde R 610737856 4096 6.10 0.006390 perl 23937 xvde R 377704624 4096 0.10 0.015040 perl 7755 xvdb R 732825200 4096 8.51 0.022842 perl 3285 xvdc R 732953880 4096 7.72 0.023019 perl 23937 xvdb R 377707064 4096 0.09 0.034443 perl 7755 xvdg R 732998328 4096 11.28 0.039648 perl 23937 xvdd R 733127392 4096 5.08 0.039863 perl 31913 xvdg R 732868048 4096 0.10 0.049431 perl 3285 xvdg R 732906896 4096 9.45 0.058521 perl 27565 xvdg R 610744920 4096 8.99 0.070843 perl 27565 xvdg R 377706520 4096 12.26 0.080564 perl 31913 xvdc R 610951744 4096 9.62 0.080804 perl 7755 xvdc R 732858664 4096 0.14 0.086932 perl 27565 xvdg R 732937416 4096 6.01 0.087093 perl 27565 xvde R 610853240 4096 0.09 […]
- 10. 10 Case Study: BCC biosnoop, cont. # ps -ef | grep perl root 3285 3274 1 14:16 ? 00:04:24 /usr/bin/perl /apps/…ec2rotatelogs.pl root 7755 7748 1 04:16 ? 00:10:20 /usr/bin/perl /apps/…ec2rotatelogs.pl root 11366 11359 1 10:16 ? 00:06:39 /usr/bin/perl /apps/…ec2rotatelogs.pl root 15054 15049 2 16:16 ? 00:03:07 /usr/bin/perl /apps/…ec2rotatelogs.pl root 19675 19670 1 06:16 ? 00:08:53 /usr/bin/perl /apps/…ec2rotatelogs.pl root 23937 23930 1 12:16 ? 00:05:30 /usr/bin/perl /apps/…ec2rotatelogs.pl root 27565 27561 2 18:16 ? 00:00:28 /usr/bin/perl /apps/…ec2rotatelogs.pl root 28232 28223 1 02:16 ? 00:11:43 /usr/bin/perl /apps/…ec2rotatelogs.pl root 31913 31907 1 08:15 ? 00:07:40 /usr/bin/perl /apps/…ec2rotatelogs.pl […]
- 11. Many more tools to try! bcc tools bpftrace tools (from my book, open source) Solve >90% of perf issues with canned observability (tracing) tools This is BPF observability in one pic
- 12. Print on your office/home wall, use as a checklist Suspected disk issue? Try these first:
- 13. Print on your office/home wall, use as a checklist Suspected disk issue? Try these first: Then walk up the stack: file system tools, VFS tools, syscall tools, etc.
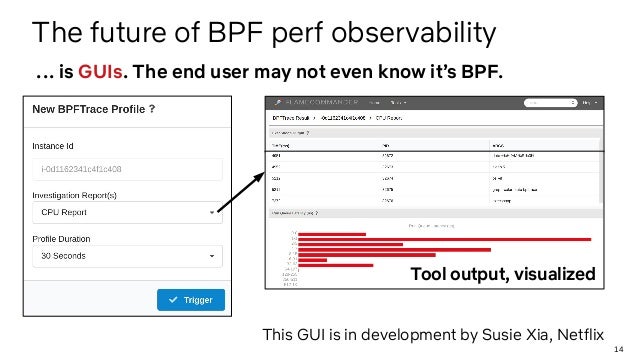
- 14. 14 The future of BPF perf observability … is GUIs. The end user may not even know it’s BPF. Tool output, visualized This GUI is in development by Susie Xia, Netflix
- 15. 15 bcc tools Instance agent Server Application bcc tools Instance agent Server Application Client GUI GUI Webpage Web Server Example real-time BPF observability UI Netflix Vector (now retired) uses this model ● Instance agent pcp pmdabcc ● https://github.com/Netflix/vector
- 16. 16 Instance agent Server Application Instance agent Server Application Client GUI GUI Webpage Web Server Example real-time BPF observability UI #2 bpftrace tools bpf- trace bpf- trace Netflix FlameCommander UI ● (not yet open source)
- 17. 17 Many tools are sandcastles, and require frequent rebuilding to match kernel changes Fortunately many companies and engineers maintain these versions Think like a sysadmin Please try to use bcc/bpftrace tools as-is and fetch updates bcc & bpftrace tools Facebook Isovalent Netflix (many more)
- 18. 18 Sysadmins sometimes program shell scripting awk sed one-liners bpftrace tools bpftrace one-liners
- 19. 19 Think like a programmer if You have a real-world problem that tools don’t solve You’re a BPF-based startup You’re debugging your own code* You’re doing networking/security/etc. You really want to learn BPF internals * JIT-ed runtimes like Java are currently complex to trace
- 20. 20 Recommended tracing front-ends I want to run some tools ● bcc, bpftrace I want to hack up some new tools ● bpftrace I want to spend weeks developing a BPF product ● bcc libbpf C, bcc Python (maybe), gobpf, libbbpf-rs Requires LLVM; becoming obsolete / special-use only New, lightweight, CO-RE & BTF based
- 21. 21 Recommended tracing front-ends I want to run some tools ● bcc, bpftrace /usr/bin/* I want to hack up some new tools ● bpftrace bash, awk I want to spend weeks developing a BPF product ● bcc libbpf C, bcc Python (maybe), gobpf, libbpf-rs C, C++ Unix analogies Requires LLVM; becoming obsolete / special-use only New, lightweight, CO-RE & BTF based
- 22. 22 bpftrace example # readahead.bt Attaching 5 probes... ^C Readahead unused pages: 128 Readahead used page age (ms): @age_ms: [1] 2455 |@@@@@@@@@@@@@@@ | [2, 4) 8424 |@@@@@@@@@@@@@@@@@@@@@@@@@@@@@@@@@@@@@@@@@@@@@@@@@@@@| [4, 8) 4417 |@@@@@@@@@@@@@@@@@@@@@@@@@@@ | [8, 16) 7680 |@@@@@@@@@@@@@@@@@@@@@@@@@@@@@@@@@@@@@@@@@@@@@@@ | [16, 32) 4352 |@@@@@@@@@@@@@@@@@@@@@@@@@@ | [32, 64) 0 | | [64, 128) 0 | | [128, 256) 384 |@@ |
- 23. 23 #!/usr/local/bin/bpftrace kprobe:__do_page_cache_readahead { @in_readahead[tid] = 1; } kretprobe:__do_page_cache_readahead { @in_readahead[tid] = 0; } kretprobe:__page_cache_alloc /@in_readahead[tid]/ { @birth[retval] = nsecs; @rapages++; } kprobe:mark_page_accessed /@birth[arg0]/ { @age_ms = hist((nsecs - @birth[arg0]) / 1000000); delete(@birth[arg0]); @rapages--; } END { printf("nReadahead unused pages: %dn", @rapages); printf("nReadahead used page age (ms):n"); print(@age_ms); clear(@age_ms); clear(@birth); clear(@in_readahead); clear(@rapages); } Fits on one slide! bpftrace example
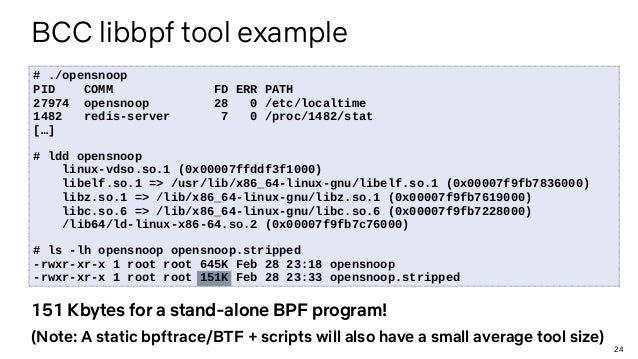
- 24. 24 BCC libbpf tool example # ./opensnoop PID COMM FD ERR PATH 27974 opensnoop 28 0 /etc/localtime 1482 redis-server 7 0 /proc/1482/stat […] # ldd opensnoop linux-vdso.so.1 (0x00007ffddf3f1000) libelf.so.1 => /usr/lib/x86_64-linux-gnu/libelf.so.1 (0x00007f9fb7836000) libz.so.1 => /lib/x86_64-linux-gnu/libz.so.1 (0x00007f9fb7619000) libc.so.6 => /lib/x86_64-linux-gnu/libc.so.6 (0x00007f9fb7228000) /lib64/ld-linux-x86-64.so.2 (0x00007f9fb7c76000) # ls -lh opensnoop opensnoop.stripped -rwxr-xr-x 1 root root 645K Feb 28 23:18 opensnoop -rwxr-xr-x 1 root root 151K Feb 28 23:33 opensnoop.stripped 151 Kbytes for a stand-alone BPF program! (Note: A static bpftrace/BTF + scripts will also have a small average tool size)
- 25. 25 PSA CONFIG_DEBUG_INFO_BTF=y E.g., Ubuntu 20.10, Fedora 30, and RHEL 8.2 have it
- 26. 26 Kernel User-mode Applications Hardware Events (incl. clock) BPF Future: Event-based Applications Kernel-mode Applications (BPF) Scheduler Kernel Events U.E.
- 27. 27 A New Type of Software Execution model User defined Compil- ation Security Failure mode Resource access User task yes any user based abort syscall, fault Kernel task no static none panic direct BPF event yes JIT, CO-RE verified, JIT error message restricted helpers
- 28. 28 Take Away To get started with BPF performance wins, think like a sysadmin: 1. Install BCC & bpftrace tools 2. Run them 3. Get some wins
- 29. 29 References This is also where I recommend you go to learn more: ● https://github.com/iovisor/bcc/blob/master/docs/tutorial.md ● https://github.com/iovisor/bpftrace/blob/master/docs/tutorial_one_liners.md ● BPF Performance Tools, Addison Wesley 2020 ● Systems Performance 2nd Edition, Addison Wesley 2021 ● http://www.brendangregg.com/blog/2019-01-01/learn-ebpf-tracing.html ● http://www.brendangregg.com/ebpf.html ● https://ebpf.io/what-is-ebpf
- 30. 30 Thanks BPF: Alexei Starovoitov (Facebook), Daniel Borkmann (Isovalent), David S. Miller (Red Hat), Jakub Kicinski (Facebook), Yonghong Song (Facebook), Martin KaFai Lau (Facebook), John Fastabend (Isovalent), Quentin Monnet (Isovalent), Jesper Dangaard Brouer (Red Hat), Andrey Ignatov (Facebook), and Stanislav Fomichev (Google), Linus Torvalds, and many more in the BPF community BCC: Brenden Blanco (VMware), Yonghong Song, Sasha Goldsthein (Google), Teng Qin (Facebook), Paul Chaignon (Isovalent), Vicent Martí (PlanetScale), and many more in the BCC community bpftrace: Alastair Robertson (Yellowbrick Data), Dan Xu (Facebook), Bas Smit, Mary Marchini (Netflix), Masanori Misono, Jiri Olsa, Viktor Malík, Dale Hamel, Willian Gaspar, Augusto Mecking Caringi, and many more in the bpftrace community
Recommend
About Joyk
Aggregate valuable and interesting links.
Joyk means Joy of geeK