

Introduction to Time Series Forecasting (Part-1)
source link: https://blog.knoldus.com/introduction-to-time-series-forecasting-part-1/
Go to the source link to view the article. You can view the picture content, updated content and better typesetting reading experience. If the link is broken, please click the button below to view the snapshot at that time.

This blog is Part-1 for Introduction to Times Series Forecasting. In this blog, the main focus is to provide you an idea about what is a time series, types of forecasting, components of a time series, and the goal of a time series. Part-2 will provide you with the basics algorithms to analyze time-series data.
Introduction to Time Series
Time series is an ordered sequence of data points spread over a period of time, typically in equally spaced intervals. It can be monthly, yearly, weekly, daily, hourly, and by the minute. A few examples of a time series include weekly gas prices, yearly temperature change, hourly passenger count on the subway, and any stock market app you look at.
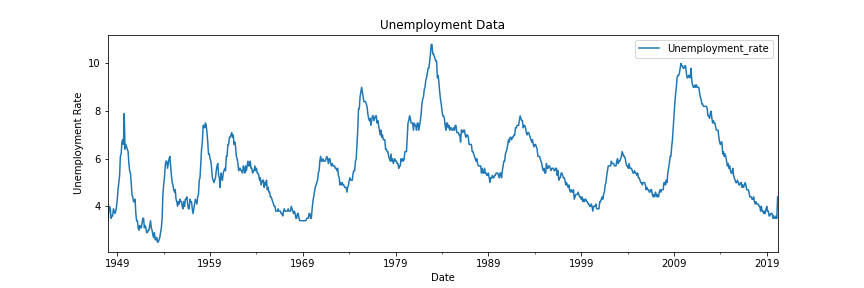
Forecasting means predicting some values that might occur in the future. For example, stock market traders often tend to forecast the stock prices based on the current stock prices or on the trend followed in the past. Similarly, the sales department of a company plans to forecast the sales for this quarter based on various factors affecting the company’s profitability. And time series forecasting is basically forecasting future values based on the present or previous values. And the data used in such forecasting is called time-series data. Graph of time-series data for the unemployment rate in the last 72 years taken at monthly intervals ha.
Types of Forecasting
There are two types of forecasting. They are:
- Qualitative forecasting
- Quantitative forecasting
The following are the differences between the quantitative and qualitative forecasting
Quantitative ForecastingQualitative ForecastingBased on the data and any repeating historical patterns in the data.This procedure is taken when data is not available and historical patterns do not repeat. This is based on expert decisions.Captures complex patterns that humans cannot identify.It may not capture complex patterns.No bias (Data-Driven)Bias (Expert Inputs)E.g. Time series forecastingE.g. Delphi method
Components of a Time Series
Let’s say you have your observed values, D. These observed values D, can be broken down into 2 main components: Systematic components and Random components. Systematic components are data that can be forecasted, while random components are data that cannot be forecasted. I will break down both the systematic components and random components in a series of definitions below.
Systematic Components: It can be further broken down into 3 parts.
- Level (L): It is the intercept of the straight-line approximation of the current observed values D, like a regression line or line of best fit. Level is generally used as initial input to forecast models.

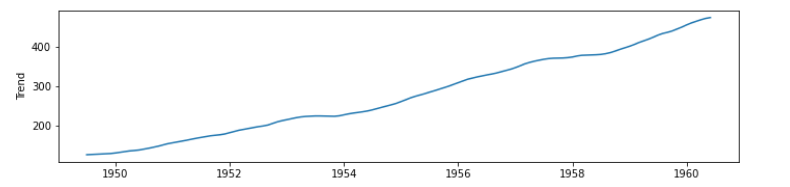
- Trend (T): It is the slope of the rate of growth or decline of your observed values, D. This slope or rate will decline, incline, or be constant throughout the time series.
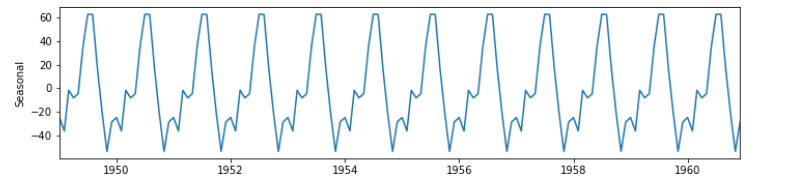
- Seasonality (S) or Cycles: They are the predictable seasonal or non-seasonal fluctuations in your observed values, D. In other words, your data has seasonality if the data has variations that occur in regular intervals (weekly, monthly, etc.) throughout a year. For example, the number of airline passengers goes down in winters ( may be due to visibility, not enough flight operating ) and comes back up in summer. This is the seasonal component.
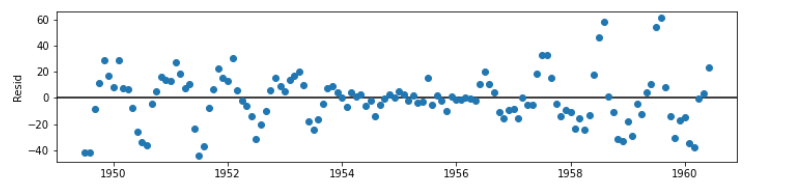
Random Components: This might be anomalous behavior, irregularities in the data, and unexplained variation. There is typically not much control on these things, and are inevitable in almost every dataset.
Goal of a Time Series
When given a time series, you either want to decompose the components of your time-series data or forecast and make predictions based on your data. Let’s talk about both techniques below.
Decomposition: There are three sub-components to time series data. They are trend, seasonality, and randomness. And can provide important insights into the time series data. Maybe sales on your services have a seasonal or cyclical component to them and you want to use that to improve sales at a certain part of the season. That is where decomposing a time series can be helpful. You can visualize and identify specific factors and trends in your data that impact its growth or decline. Below is a breakdown of the components of Airline passenger data.

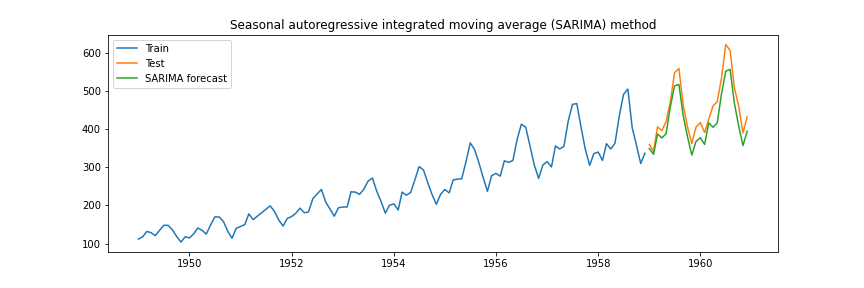
Forecasting: Another goal of time series is forecasting the future. For example, you may want to predict when some hardware or device might crash in the future based on their historical data. This can help companies make proactive or preventative measures to fix the problem before it happens instead of reacting to the problem as it happens. As a result, this can save time and money for companies and clients. An example of the forecast of Airline passenger data given its current seasonality, cycles, and trends in the following.
References
Recommend
About Joyk
Aggregate valuable and interesting links.
Joyk means Joy of geeK