

Configuring a MongoDB Sharded Cluster with PMM2 - Part 2 - Percona Database Perf...
source link: https://www.percona.com/blog/configuring-a-mongodb-sharded-cluster-with-pmm2-part-2/
Go to the source link to view the article. You can view the picture content, updated content and better typesetting reading experience. If the link is broken, please click the button below to view the snapshot at that time.

Configuring a MongoDB Sharded Cluster with PMM2 – Part 2
 As a DBA, it is important to monitor a database to help us troubleshoot or to understand the health of an instance. Percona Monitoring and Management (PMM v2) is open-source and does a great job in monitoring the databases like MongoDB, MySQL, PostgreSQL, etc.
In this blog post, we will see how to configure a sharded cluster in PMM2. This is a part two version of the previous one which was done with PMM v1, titled Configuring PMM Monitoring for MongoDB Cluster. I have listed the steps to configure the sharded cluster into PMM2 below:
Prepare DB for Monitoring
Before configuring with PMM2, we will need to create a USER for monitoring from the database side. If you need to enable QAN (query analytics), then you will need to enable profiler and some more custom permission like “explainRole” to the user as well. Adding profiler adds up some more little load to the database, so it is better you do prior tests to analyze the load if you want to assess the extra load.
-
Add PMM Users to the DB
-
Enabling Profiler
This is optional. Run the instance with the profiler or add profiling at the database level to monitor queries in QAN (not applicable for mongos).
To start at the instance level (enables profiling for all databases):
or in mongod.conf:
To enable p[rofiling at DB level:
-
Add MongoDB Instance to the pmm-client
Here use the same –cluster option name for all members from the same cluster and provide service-name to identify it:
-
Check the Inventory Service
Then check whether the service was added successfully or not:
From My Test
I used localhost to deploy the sharded cluster for the testing purpose as below:
Members list:
Listing one mongod instance from the ps command:
Adding mongodb services to pmm-admin:
Listing the services added:
PMM Dashboards
From PMM Dashboards, you can then view the replSet summary as well as the sharded cluster summary.
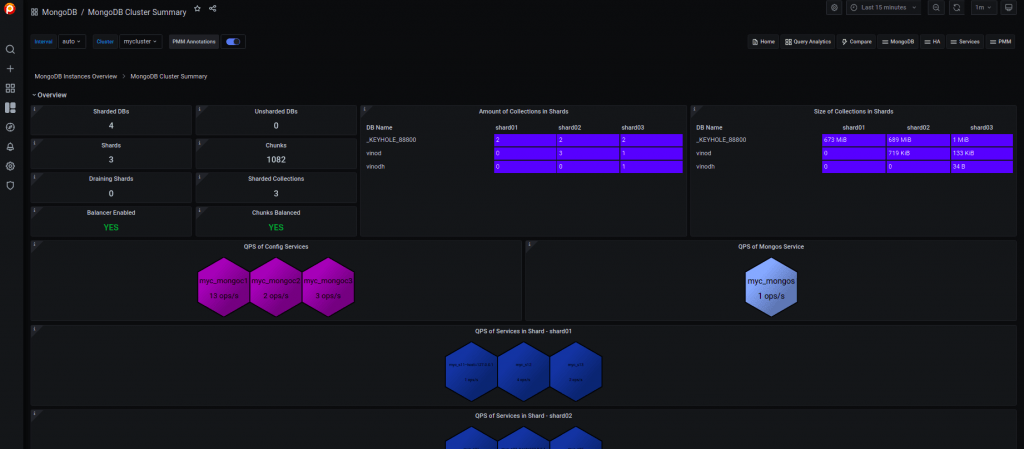
Cluster Summary
This dashboard gives information about the sharded/unsharded databases, shards, chunks, cursor details, etc.
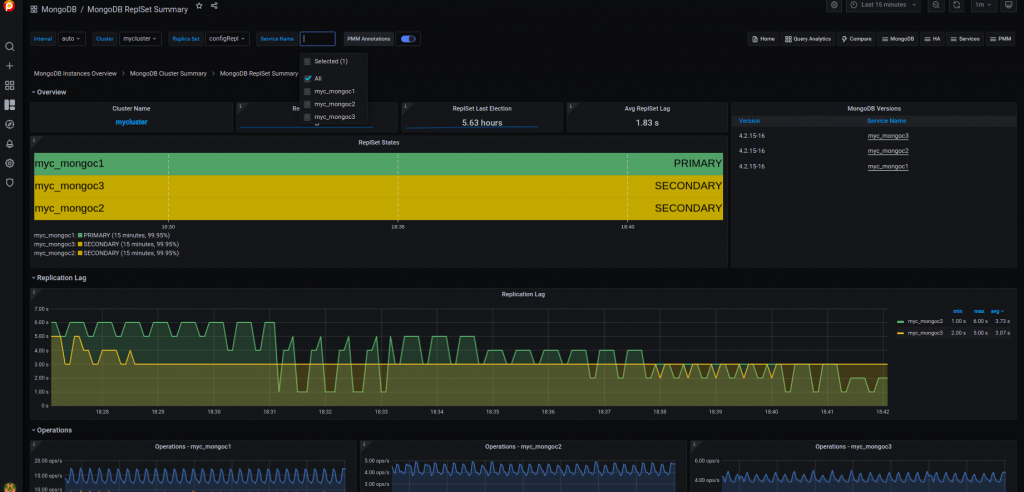
ReplSet Summary:
This dashboard tells about the replication information like replica lag, operations, heartbeat, ping time, etc.
MongoDB Instance Overview:
This is the general dashboard for a MongoDB instance which provides generic information about the connections, memory usage, latency, etc

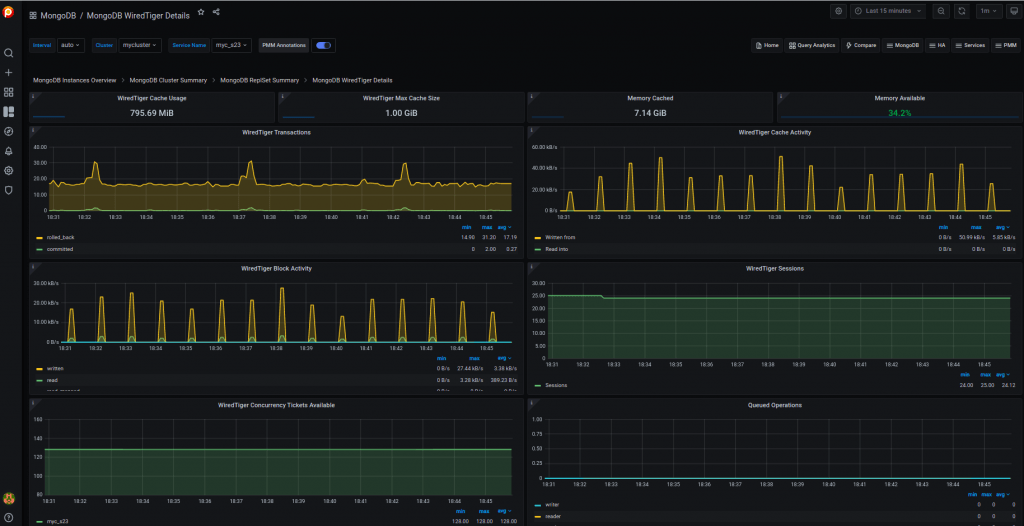
WiredTiger Details:
This is the main dashboard that you’ll need most to analyze the problems here as it shows the wiredTiger information. The main metrics that you need to monitor here are the WT cache utilization, evictions of modified or unmodified pages, write/read tickets utilization, index/objects scans, etc.
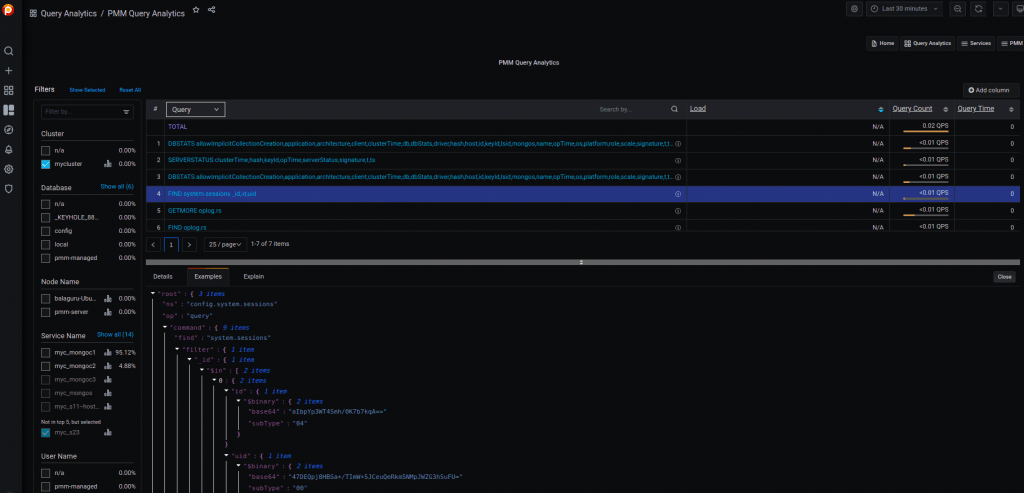
If you enable the profiling, then you could see the queries used in the database here. You can filter them easily as shown in the screenshot below. Also, you can get the explain plan to check whether they utilize the COLLSCAN (disk reads) or IXSCAN (uses index). Also, you can check the counts, load, etc.
Conclusion
As said, Percona Monitoring and Management 2 is very easy to configure to monitor the databases and it is recommended too. It’s better now rather than late to configure the monitoring. PMM2 is managed by Percona which is totally free and you can raise any bugs here – https://jira.percona.com/. If you have doubts, you can leave your questions here – https://forums.percona.com.
Complete the 2021 Percona Open Source Data Management Software Survey
STAY UP-TO-DATE With Percona!

Join 50,000+ of your fellow open-source enthusiasts! Our newsletter provides updates on Percona open source software releases, technical resources, and valuable MySQL, MariaDB, PostgreSQL, and MongoDB-related articles. Get information about Percona Live, our technical webinars, and upcoming events and meetups where you can talk with our experts.
By submitting my information I agree that Percona may use my personal data in send communication to me about Percona services. I understand that I can unsubscribe from the communication at any time in accordance with the Percona Privacy Policy.
Author
Vinodh Krishnaswamy is a member of Support Team! Prior to joining Percona, he worked as a MySQL and MongoDB DBA in companies such as iGate, Datavail, and Sify Ltd. He is a trainer and has provided training programs on MySQL and MongoDB. He enjoys writing Shell script and loves driving, reading books, and playing table tennis.
Leave a Reply Cancel reply
Recommend
-
79
Hipmunk is all about discovering a better travel experience, and that requires knowing the alternatives. So each night, Hipmunk conducts proactive searches of a little over 100 million possible trips, which are then place...
-
60
In this blog, we will see how to configure Percona Monitoring and Management (PMM) monitoring for a MongoDB cluster. It’s very simple, like adding a replica set or standalone instances to PMM Monitoring. For th...
-
5
What’s Running in My DB? A Journey with currentOp() in MongoDB Back to the Blog
-
3
V2EX › 程序员 怎么让 Debezium 正常连接到阿里云的 MongoDB sharded cluster JasonLaw...
-
5
Migration of a MongoDB Replica Set to a Sharded Cluster Back to the Blog
-
6
Moving MongoDB Cluster to a Different Environment with Percona Backup for MongoDB Back to the Blog
-
4
Upgrade Process of Percona Server for MongoDB (Replica Set and Shard Cluster) Back to the Blog Percona Server for MongoDB (PSMDB) upgrade, m...
-
1
-
14
-
4
Many MongoDB clusters use storage-level snapshots to provide fast and reliable backups. In this blog post, you’ll learn how to restore such a snapshot from a traditional VM-based sharded MongoDB cluster to a freshly deployed
About Joyk
Aggregate valuable and interesting links.
Joyk means Joy of geeK