

See what sounds look like with Raspberry Pi Pico
source link: https://www.raspberrypi.org/blog/see-what-the-sounds-around-you-look-like-with-raspberry-pi-pico/
Go to the source link to view the article. You can view the picture content, updated content and better typesetting reading experience. If the link is broken, please click the button below to view the snapshot at that time.

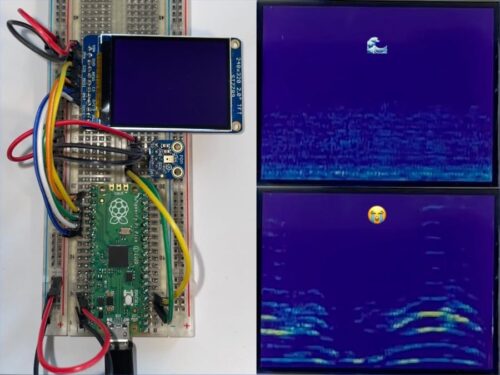
Raspberry Pi Pico powers this real-time audio spectrogram visualiser using a digital microphone to pick up the sound and an LCD display to show us what those sounds “look” like.
First things first
First off, let’s make sure we know what all of those words mean, because “audio spectrogram visualiser” is a bit of a mouthful:
- A spectrogram is a way of representing the range of frequencies in a signal and their strength, or “loudness”. For example, a spectrogram could show the mixture of higher and lower frequency sounds that make up the sound of a spoken word.
- The visualiser bit comes in when these frequencies are presented as waveforms that you can see on the screen.
- And the audio part is simply because Sandeep is visualising sounds in this project (rather than, for example, radio frequencies or seismic waves).
Perfectly portable sound monitor
This pocket-sized device can be carried around with you and lets you see a visual representation of your surrounding audio environment in real time. So, if you wander into a peaceful bird reserve or something, the LCD display will show you something very different to what you’d see if you were in, say, Wembley Stadium during an FA Cup final.
Above, you can see Sandeep’s creation in action in the vicinity of a crying baby.
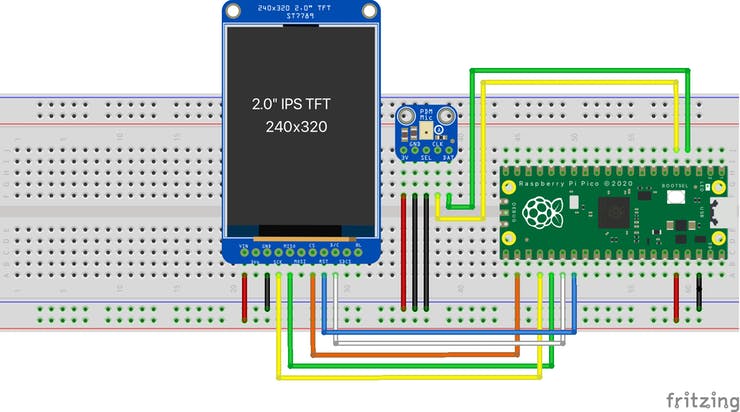
Hardware
That is a satisfyingly affordable hardware list.
How does it work?
In the video below, you can see there is a direct correlation between the original audio signal’s amplitude (on the left) and the audio spectrogram’s representation of the signal on the right.
The Microphone Library for Pico captures data from Sandeep’s digital microphone. Arm’s CMSIS-DSP library processes the audio in real-time, then transforms it into spectrograms. These are then displayed one row at a time on the LCD screen, using the ST7789 Library for Pico.
Maker Sandeep Mistry created the original project guide on behalf of the Arm Software Developers team. Check out his other tutorial on how to create a USB Microphone with the Raspberry Pi Pico.
Recommend
About Joyk
Aggregate valuable and interesting links.
Joyk means Joy of geeK