

Making Aurora Write Latency 15x Higher (or More!) by Choosing a Bad Primary Key
source link: https://www.percona.com/blog/making-aurora-write-latency-15x-higher-or-more-by-choosing-a-bad-primary-key/
Go to the source link to view the article. You can view the picture content, updated content and better typesetting reading experience. If the link is broken, please click the button below to view the snapshot at that time.

 Primary Key design is an important thing for InnoDB performance, and choosing a poor PK definition will have an impact on performance and also write propagation in databases. When this comes to Aurora, this impact is even worse than you may notice.
In short, we consider a poor definition of a Primary Key in InnoDB as “anything but quasi sequential values”, which may cause very random access to data and thus increase the IO dependency.
In this post, I’ll try to demonstrate the potential impact of the primary key design when running on Aurora, and how a bad design can lead to a 15x write latency penalty (or more).
The Analysis
Recently I worked on a case where a customer was having issues with scaling writes in Aurora MySQL. While this is a known limitation in Aurora considering how the distributed storage layer syncs out data among all nodes of the cluster, we observed additional latency occurring when more clients were writing to the database.
The first thing I noticed is that their main table had a poor definition of the Primary Key as they were using UUID-like columns based on VARCHAR data types. In this case, the nature of values for the Primary Key was very random, which is really bad for a b-tree based storage like InnoDB.
With this in mind, I referred to a great post from my colleague Yves Trudeau explaining why UUIDs are bad for performance, so based on this premise I decided to try to measure how big this impact can be in the Aurora world.
The set of tests I’ve run were using a db.r5.2xlarge Aurora MySQL Cluster (8vCPU and 64GB of ram) which is pretty similar to the cluster my customer was using.
First, I’ve started with two very basic tables to avoid any extra overhead but something close to a real case:
Then I created two simple lua scripts to execute with sysbench – super simple, I’d say – as they were just for doing inserts using either the auto_increment property in table test_sequential_PK or creating random values for test_random_PK table.
The final purpose was not to measure Aurora performance as a whole but the write latency when the Primary Key is not optimal.
I’ve started the process by warming up the instances for few days by running both sysbench scripts and pushing the instance really hard while I was filling up the InnoDB Buffer Pool, results were pretty good for some time until the traffic became IO-bound:
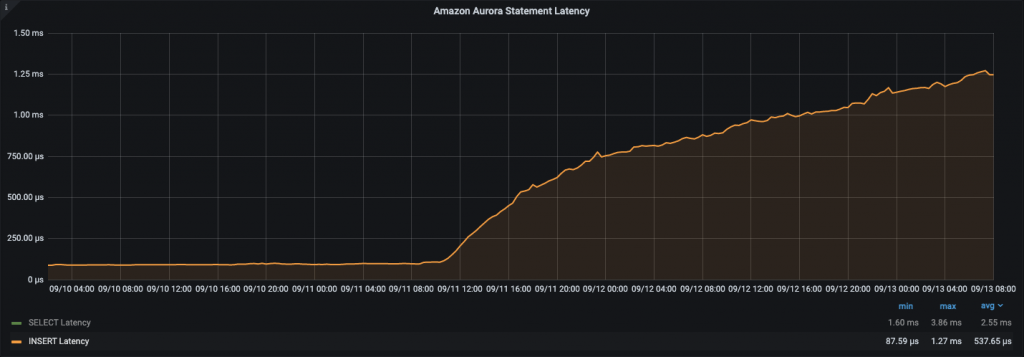
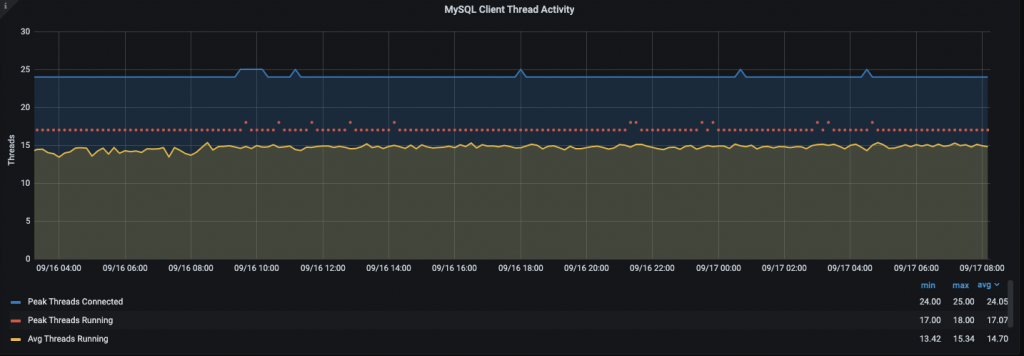
It took a few days but after some time we started to see an increase in the write latency. I created an initial set of data using 50 concurrent threads, which means the graphic above is not very helpful for the analysis I’m going to make.
After I was sure the buffer pool was filled and the instance was warmed up, I verified that the dataset is bigger than the buffer pool:
I’ll explain the difference between table sizes later in this post.
After this, I started to run separate tests to check how the write latency is affected by our table design.
First I ran sysbench as follows:
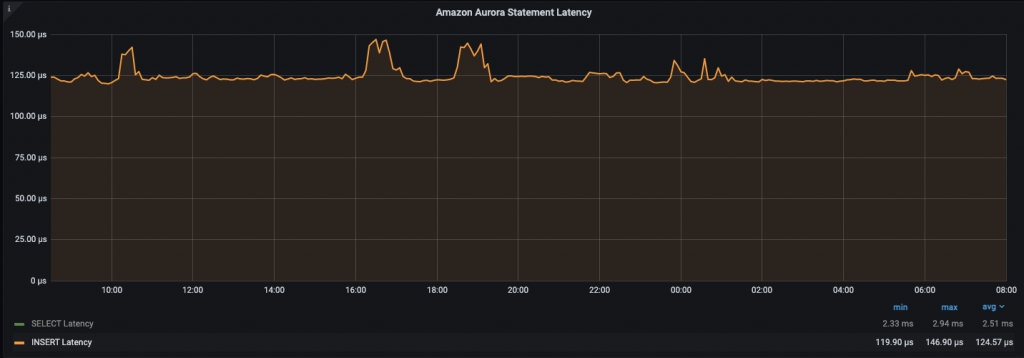
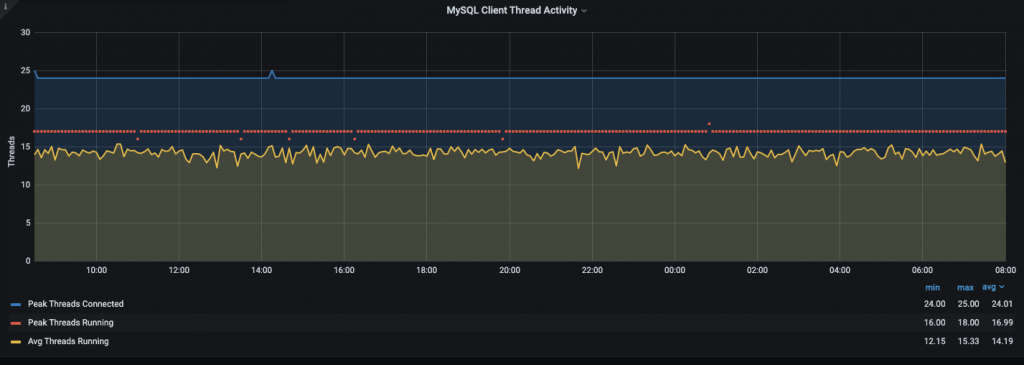
We can see that performance remains steady roughly at 124 microseconds average with all threads running so it looks there is no impact for about 24 hours.
Then I tested the random insert by running:
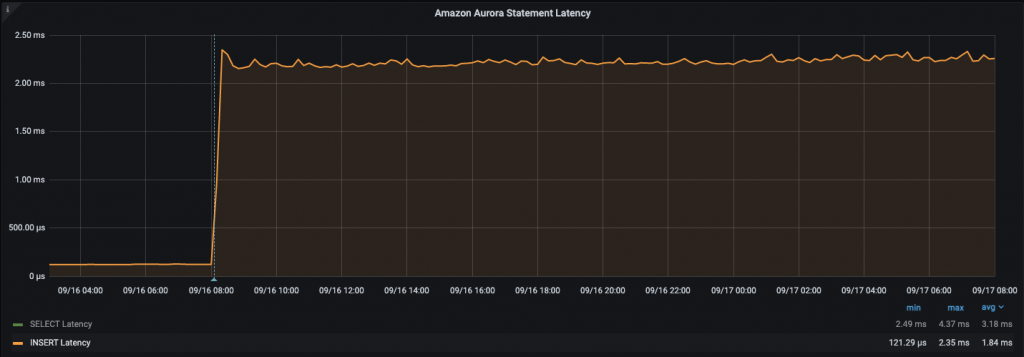
This is a huge impact if you consider that random access is causing the instance to suffer from performance, roughly 15x writing latency increase.
These numbers were very impressive compared to my previous experience so, being extra curious, I checked what was reported in Cloudwatch for Aurora Write latency for the previous 3 days.
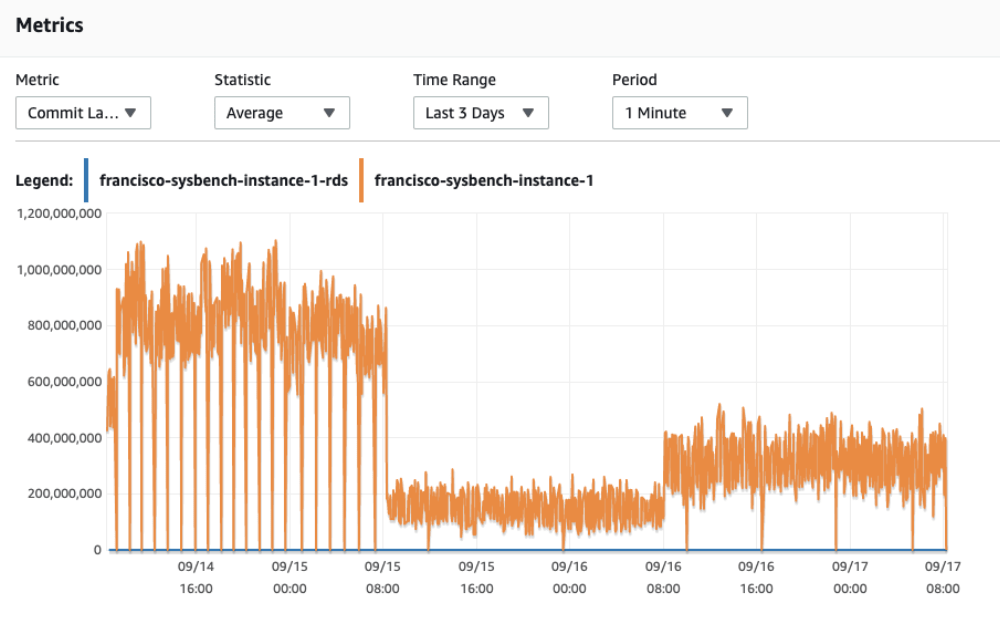
It’s quite clear the 3 stages of the checks:
- Warming up the instance and buffer pool by pushing really hard with sysbench in both tables (peak of load at the beginning)
- First round of sequential inserts using sequential write (sequential writes)
- Last round of random access (random writes)
As I said, the code used on each script was very simple. This is on purpose to avoid adding overhead somewhere other than the database. For reference, this is the interesting portion of code for random writes:
And for sequential writes:
Conclusion
Primary key design for InnoDB tables was largely discussed in several posts, and specially UUID format impact was perfectly described in the post I mentioned, above so there are no surprises. What I’ve found interesting in this analysis is that in Aurora there seems to be an extra impact of this random access.
Given that, what’s happening underneath is not quite clear. I just can try to elaborate a theory:
In Aurora, there are no dirty pages. Basically, every commit is synchronized to disk immediately so all replicas can be virtually in sync with the source server. This is reducing the chance of hitting the same page in memory every time you perform a write operation so the whole sequence of grabbing the page, placing it in memory, updating information, flushing, and committing synchronously to the block storage is particularly expensive in Aurora.
Additionally given that every secondary index adds an entry of the Primary Key, the increase in data size (and thus the disk footprint) can be impacted a lot as we have seen before, so this may also cause an extra disk utilization.
So be warned, plan your PKs properly if you don’t want to see a huge performance degradation in AWS Aurora as the database grows and workload is increased.
Percona Distribution for MySQL is the most complete, stable, scalable, and secure, open-source MySQL solution available, delivering enterprise-grade database environments for your most critical business applications… and it’s free to use!
Recommend
About Joyk
Aggregate valuable and interesting links.
Joyk means Joy of geeK