

ATOP for Linux server performance analysis (Guide)
source link: https://haydenjames.io/use-atop-linux-server-performance-analysis/
Go to the source link to view the article. You can view the picture content, updated content and better typesetting reading experience. If the link is broken, please click the button below to view the snapshot at that time.

We’re all familiar with top, a real-time system monitor. Some prefer htop and previously, I mentioned iotop for use with storage read/write monitoring. Let’s looks at another popular tool for Linux server performance analysis: atop.
Advantages of atop
Atop is an ASCII full-screen performance monitor which can log and report the activity of all server processes. One feature I really like is that atop will stay active in the background for long-term server analysis (up to 28 days by default). Other advantages include:
- Shows resource usage of ALL processes, even those that are closed/completed.
- Monitors threads within processes & ignores unused processes.
- Accumulates resource usage for all processes and users with the same name.
- Highlights critical resources using colors (red).
- Will add or remove columns as the size of the display window changes.
- Includes disk I/O and network utilization.
- Uses netatop kernel module to monitor TCP & UDP and network bandwidth.
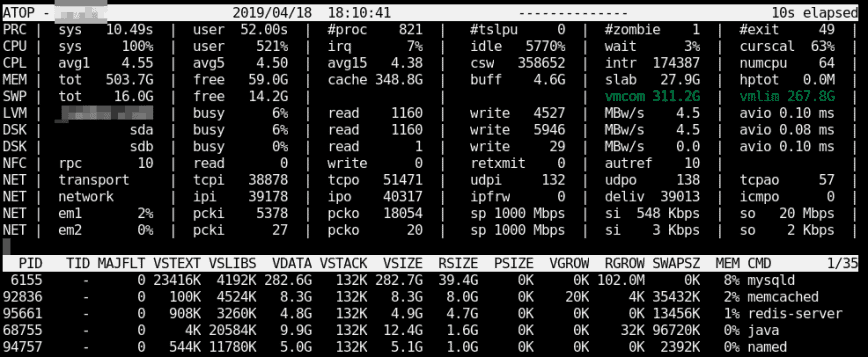
Once atop is launched, by default, it will show system activity for CPU, memory, swap, disks, and network in 10-second intervals. In addition, for each process and thread, you can analyze CPU utilization, memory consumption, disk I/O, priority, username, state, and even exit codes.
Install atop on RHEL/CentOS/Fedora Linux
First, install and enable EPEL (Extra Packages for Enterprise Linux) repo. See: RedHat solution #308983.
dnf install atop
Install atop on Debian/Ubuntu Linux
apt install atop
Once installed on any distro, you can launch it similar to top using:
atop
Using atop – system & process monitor
A good place to start would be to read the man pages:
man atop
Other useful commands:
Launch with average-per-second total values:
atop -1
Launch with active processes only:
atop -a
Launch with command line per process
atop -c
Launch with disk info
atop -d
Launch with memory info
atop -m
Launch with network info
atop -n
Launch with scheduling info
atop -s
Launch with various info (ppid, user, time)
atop -v
Launch with individual threads
atop -y
Once atop is running, press the following shortcut keys to sort processes:
- a – sort in order of most active resource.
- c – revert to sorting by CPU consumption (default).
- d – sort in order of disk activity.
- m – sort in order of memory usage
- n – sort in order of network activity
Guide to reading atop reports/logs
By default after install the atop daemon writes snapshots to a compressed log file (eg. /var/log/atop/atop_20140813). These log files can be read using:
atop -r /full/path/to/atop/log/file
Once you open a log file (e.g., atop -r /var/log/atop/atop_20140813), use t to go forward in 10-minute intervals and T to go back. You can analyze specific times by pressing b then entering the time. The above shortcut keys also work in this mode… a, c, d, m,n.
You can use shortcuts with atopsar. For example, using the flag “-c 30 5” with atopsarwill generate a report for current CPU utilization for 5 minutes (ten times with intervals of 30 seconds):
atopsar -c 30 5
Using the flag -A with return all available reports.
atopsar -A
But you can limit this to a specific time window using beginning “-b” and end “-e” flags:
atopsar -A -b 11:00 -e 11:15
As you can see, it’s easy to use atop for Linux server performance analysis effectively.
Other popular command-line tools for Linux server performance analysis:
top, htop, nmon, net-tools, iptraf, collectl, glances, iostat and vmstat.
Recommend
About Joyk
Aggregate valuable and interesting links.
Joyk means Joy of geeK