

Debug Javascript in VS Code: Going Beyond Console.log()
source link: https://spin.atomicobject.com/2021/09/13/debug-javascript-in-vscode/
Go to the source link to view the article. You can view the picture content, updated content and better typesetting reading experience. If the link is broken, please click the button below to view the snapshot at that time.

Debug Javascript in VS Code: Going Beyond Console.log()
Let’s go beyond console.log() by learning how to debug JavaScript in VS Code.
Have you ever sifted through hundreds of lines of text trying to figure out why a variable is null? If the answer is yes, you’ve heard of a debugger, right? If you’re like me, I don’t always take full advantage of the features my IDE offers me when I debug JavaScript. Being dogmatic about console.log() only makes the development process longer.
Don’t be like me and throw hours of work in the trash because you didn’t want to learn how to use your IDE’s debugger. It’s not a chore; it’s a tool! On Javascript projects, making use of the VS Code debugger can speed up development a lot.
What’s the advantage?
Javascript developers depend on print statements, sometimes to their detriment. Print statements don’t let us see the steps that occurred before a variable of interest. We often find ourselves adding a bunch of print statements to our code to understand what the heck is going on! Debuggers let us see the callers of functions and the state of local and global variables all in one place. And this is all without having to write a single print statement in our code.
Let’s debug in VS Code.
Setting Breakpoints
Let’s add breakpoints to the lines where we want our program to stop. Breakpoints will pause the execution of our code. Set them anywhere after an assignment of a variable.
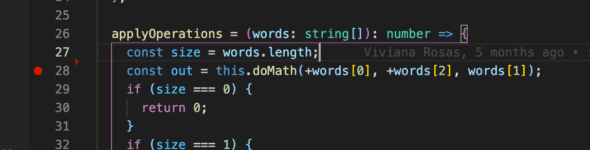
Note: The variables assigned at the breakpoint are not included in the scope.
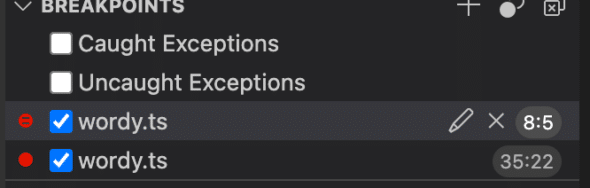
You can see all the breakpoints set on the bottom-most Run & Debug panel. You can select/deselect them to turn them on/off.
Set Debug Configuration
First, let’s create a Javascript debug terminal instance.
Note: You can also use the start debug button. You’d have to set the language as node.js and pick the script you’d like to execute.
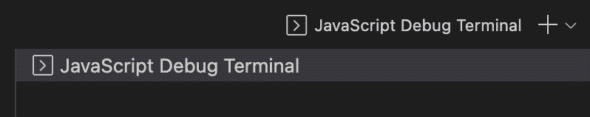 JavaScript Debug Terminal will start the debugger when you run
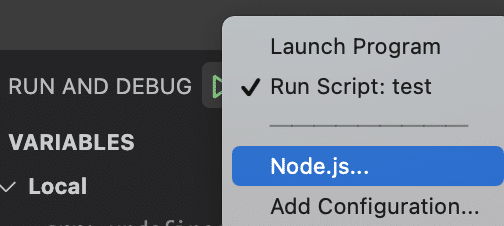 Select the Node.js for Javascript, Typescript, express applications
Running the Program
You can execute the program like you would in your shell. If you’re using the built-in run button, it will ask you to select the script you want to debug.
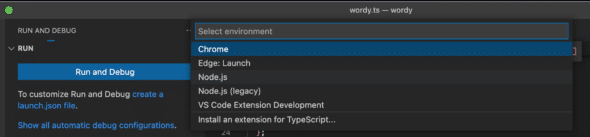 Select the language environment
Evaluating The Results
The program will run until it reaches a breakpoint. At that point, we can start either use the GUI or the Debug Console to see our data.
Using Built-In Debug Console
We can type out the variables that interest us. All the variables you can access are those that are global and local to the scope your breakpoint is in. Variables assigned exactly at the breakpoint won’t be accessible. Tab to autocomplete.
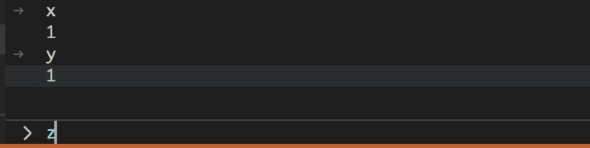 Type out the variables you need.
Using the GUI
The left-hand Run & Debug panel shows us variables available in this scope. To see the variables at the next breakpoint, select play.
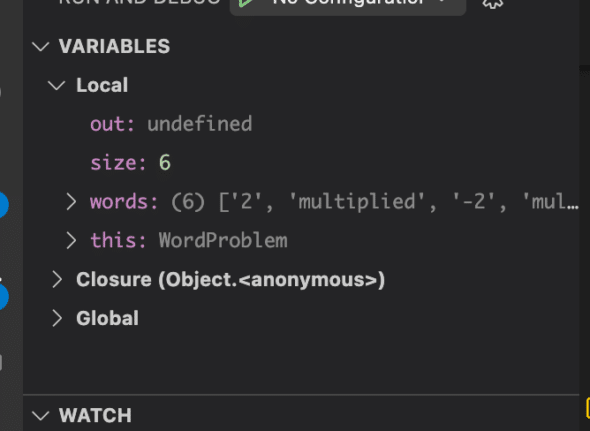 See your local and global variables
Debug with Watch
The watch panel monitors expressions throughout our code. If we meet a condition set here, it will evaluate the expression. You can watch a new expression by selecting the + button in the panel and adding the expression.
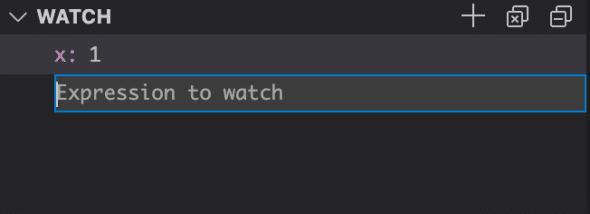 Set expressions or variables to watch
Conditional Breakpoints
Sometimes watching variables isn’t enough. Let’s say we want to break only if we meet a condition. To do this, add a normal breakpoint. Then right-click on the breakpoint, select Edit Breakpoint and add your expression.
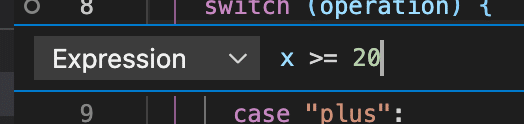 Right click on any breakpoint and edit to add a condition
Call Stack
The call stack is useful for tracing exceptions and seeing who called what. If you want to see who called an item, select the item below it.
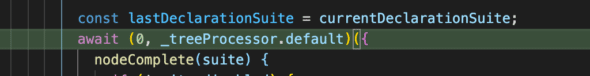
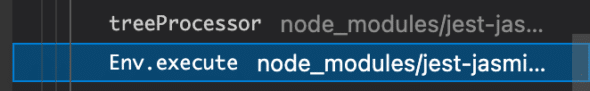 Select a call to see the callee line
This will show you the call.
Bye print statements?
Using the debug console should be another tool in your arsenal to help you debug. Sometimes it can be overkill, but it will often save you time hunting down a bug. It is not a replacement for print statements. Print statements aren’t the best at showing us state, conditional breaking, or more than one variable. It also saves us a lot of scrolling.
Attach the debugger and happy hunting!

Recommend
About Joyk
Aggregate valuable and interesting links.
Joyk means Joy of geeK